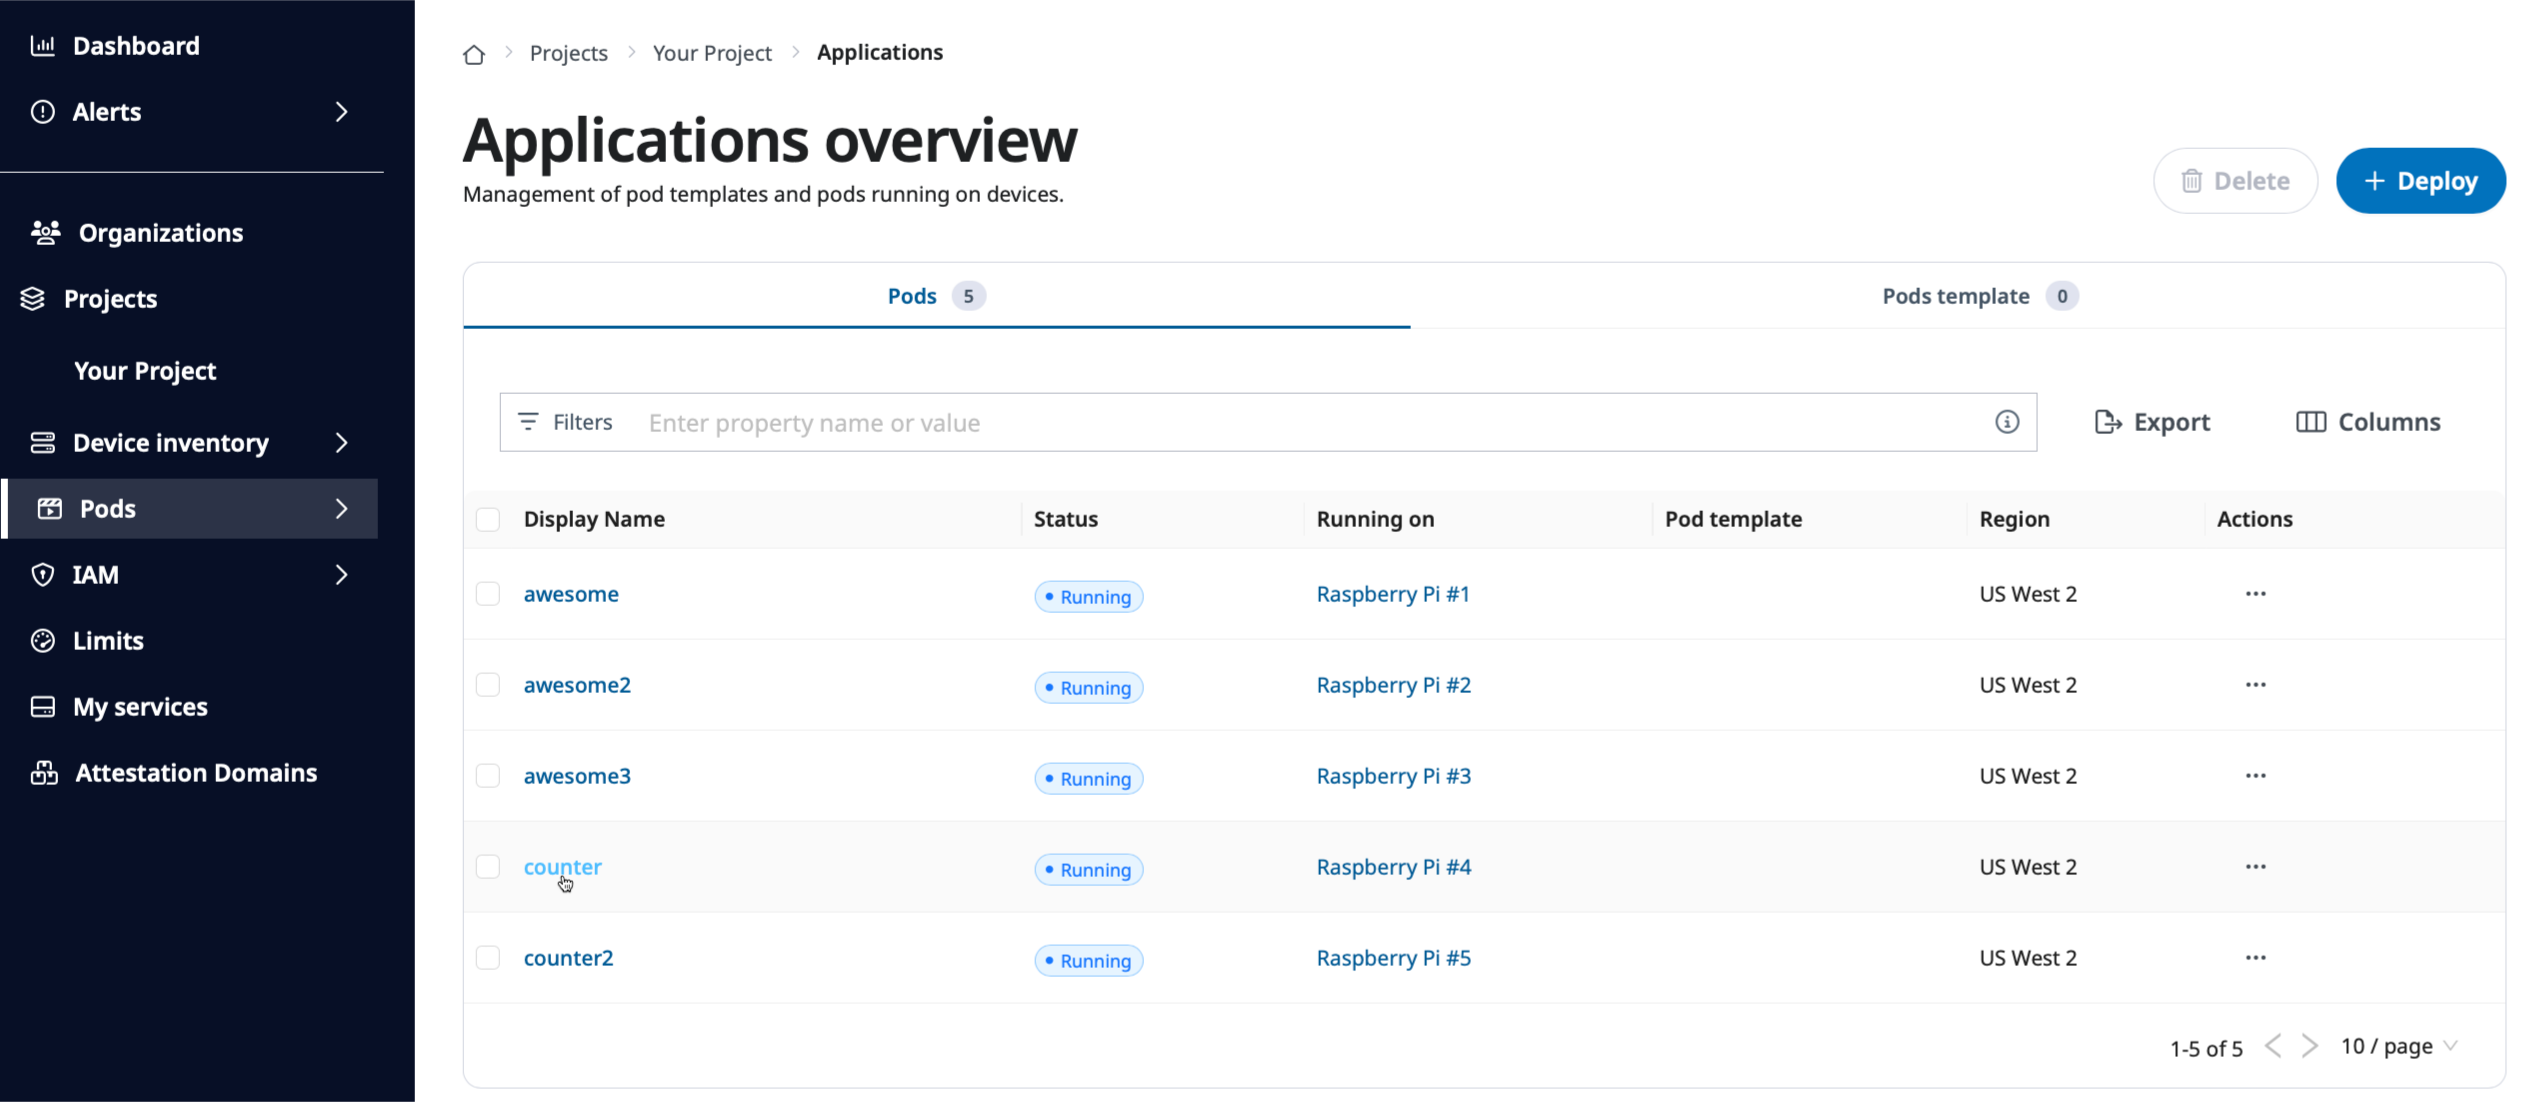
Once you developed and published your application to the container registry,
as in the previous section, now is time to deploy your application
on your device.
SPEKTRA Edge provides the Docker compose environment
on your device so that you can declare your application in the standard
Docker compose file format to run it on your device.
Let’s create a compose.yaml file for the application we developed
in the previous section and deploy it on your device through
the SPEKTRA Edge dashboard.
Private Container Registries
Please take a look at the private registry section
in case you use the private container registries, such as Amazon Elastic Container
Registry, Azure Container Registry, or Google Artifact Registry.
What you need
To deploy your application on your device, you need:
The Docker compose environment on your local
machine for the local verification
A device provisioned through the SPEKTRA Edge dashboard
And also, the cuttle CLI command is necessary to complete this tutorial,
which is used to access the application from the local machine for the
verification purpose. However, it is not required for deploying applications
on SPEKTRA Edge.
Device Provisioning
Please go through the getting started guide
if you haven’t done that.
Local verification
Let’s create and verify compose.yaml file on your local machine.
compose.yaml
Here is the compose.yaml file to deploy the
application we developed in the previous section.
This is the top level element of the compose file to abstract
the definition of a computing resource within an application which
can be scaled or replaced independently from other components.
The ports is used to define the port mappings between the host machine
and the containers. This is crucial for allowing external access to
service running inside containers.
This example exposes the container application’s port 8000 to be
accessible through the local machine’s port 8000.
Please take a look at the official document for
the ports attribute definition.
docker compose up
With the compose.yaml file ready on your local machine, run
docker compose up command in the directory where the file
locates:
$ tree .
.
└── compose.yaml

1 directory, 1 file
$ docker compose up
[+] Running 2/0
✔ Network sample_default Created 0.0s
✔ Container sample-app-1 Created 0.0s
Attaching to app-1
app-1 | * Serving Flask app 'hello'app-1 | * Debug mode: off
app-1 | WARNING: This is a development server. Do not use it in a production deployment. Use a production WSGI server instead.
app-1 | * Running on all addresses (0.0.0.0)app-1 | * Running on http://127.0.0.1:8000
app-1 | * Running on http://172.20.0.2:8000
app-1 | Press CTRL+C to quit
Here you can see the application running and listening on the port
8000 on your local machine.
With the compose.yaml ready, let’s deploy your application on your device
through the SPEKTRA Edge dashboard.
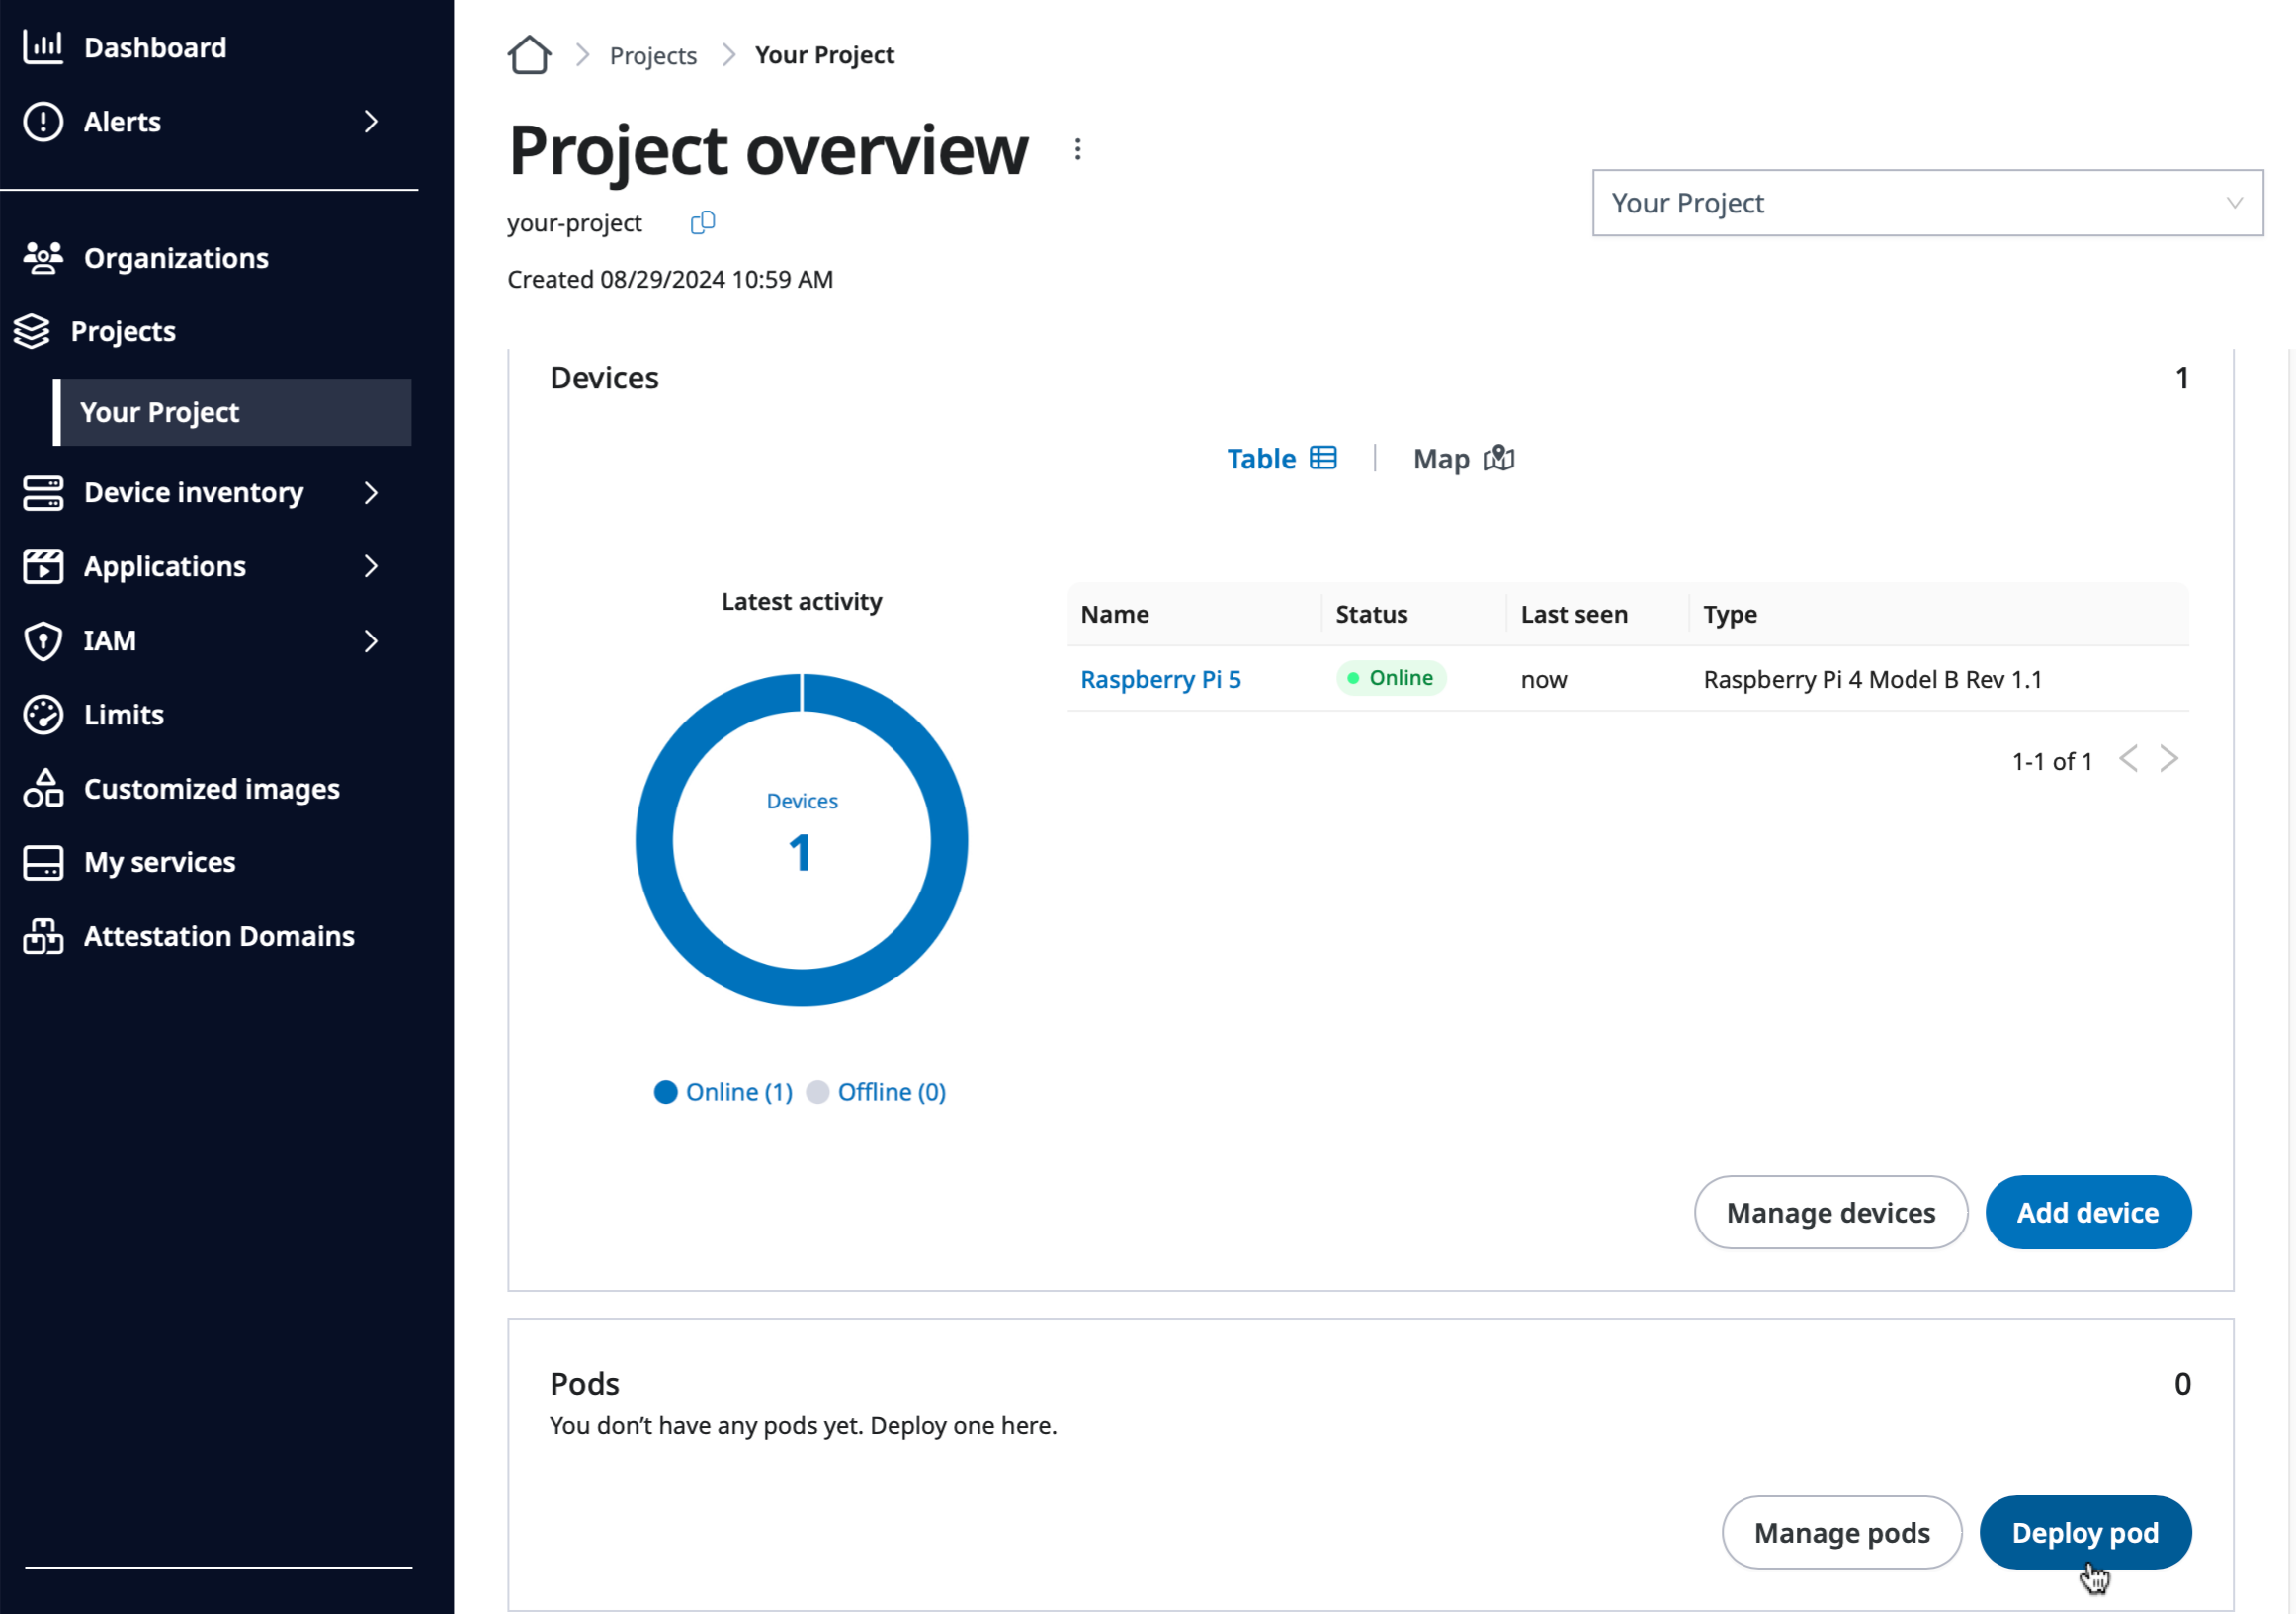
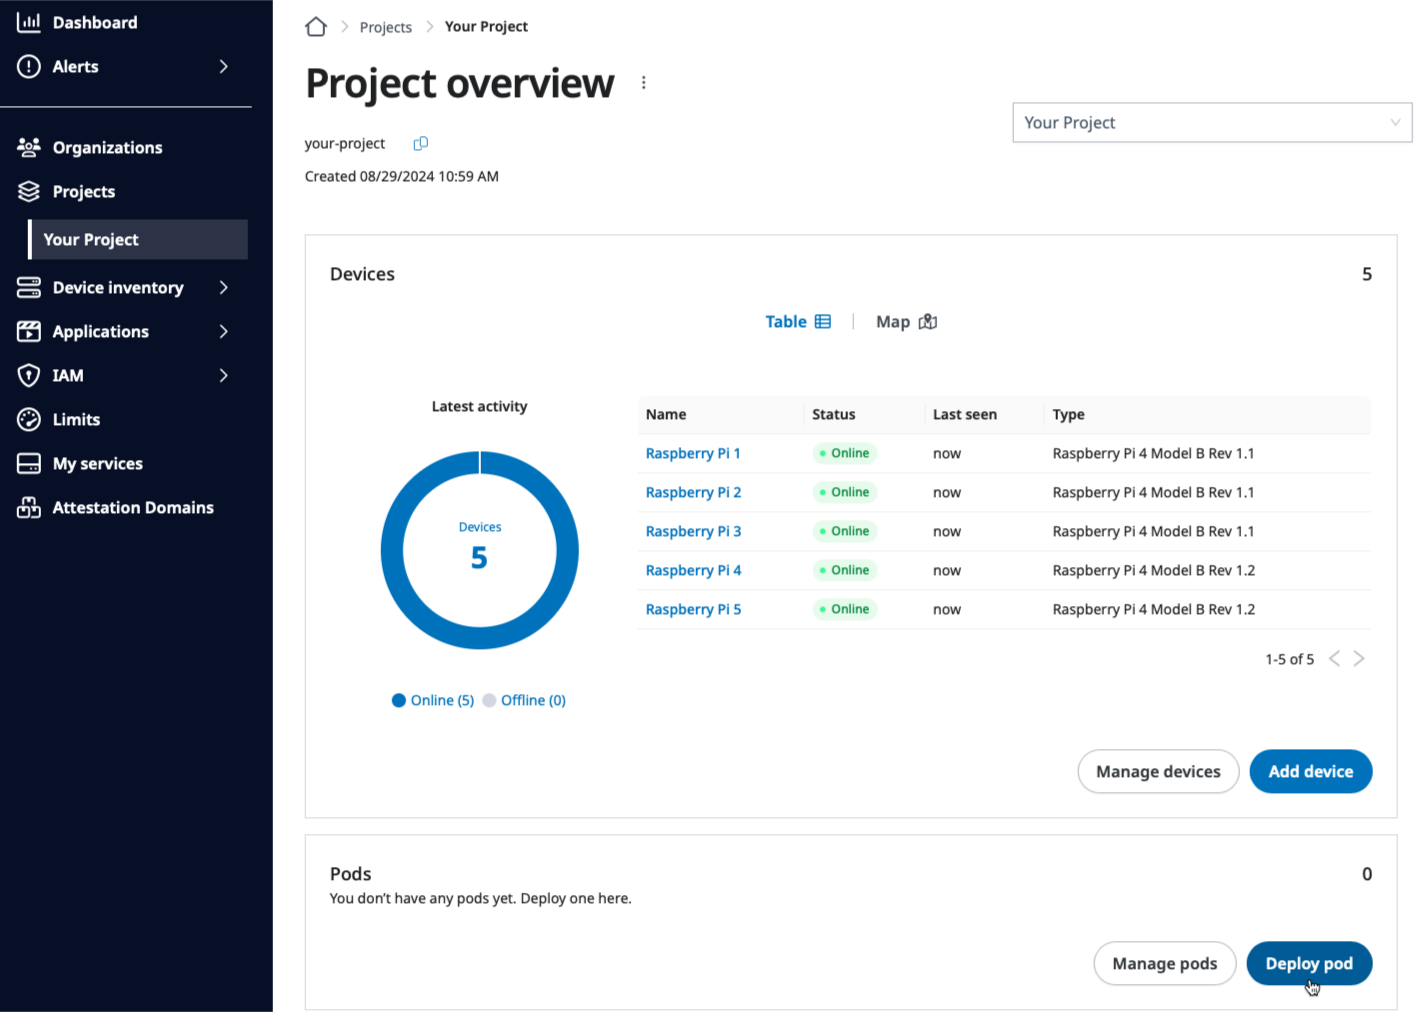
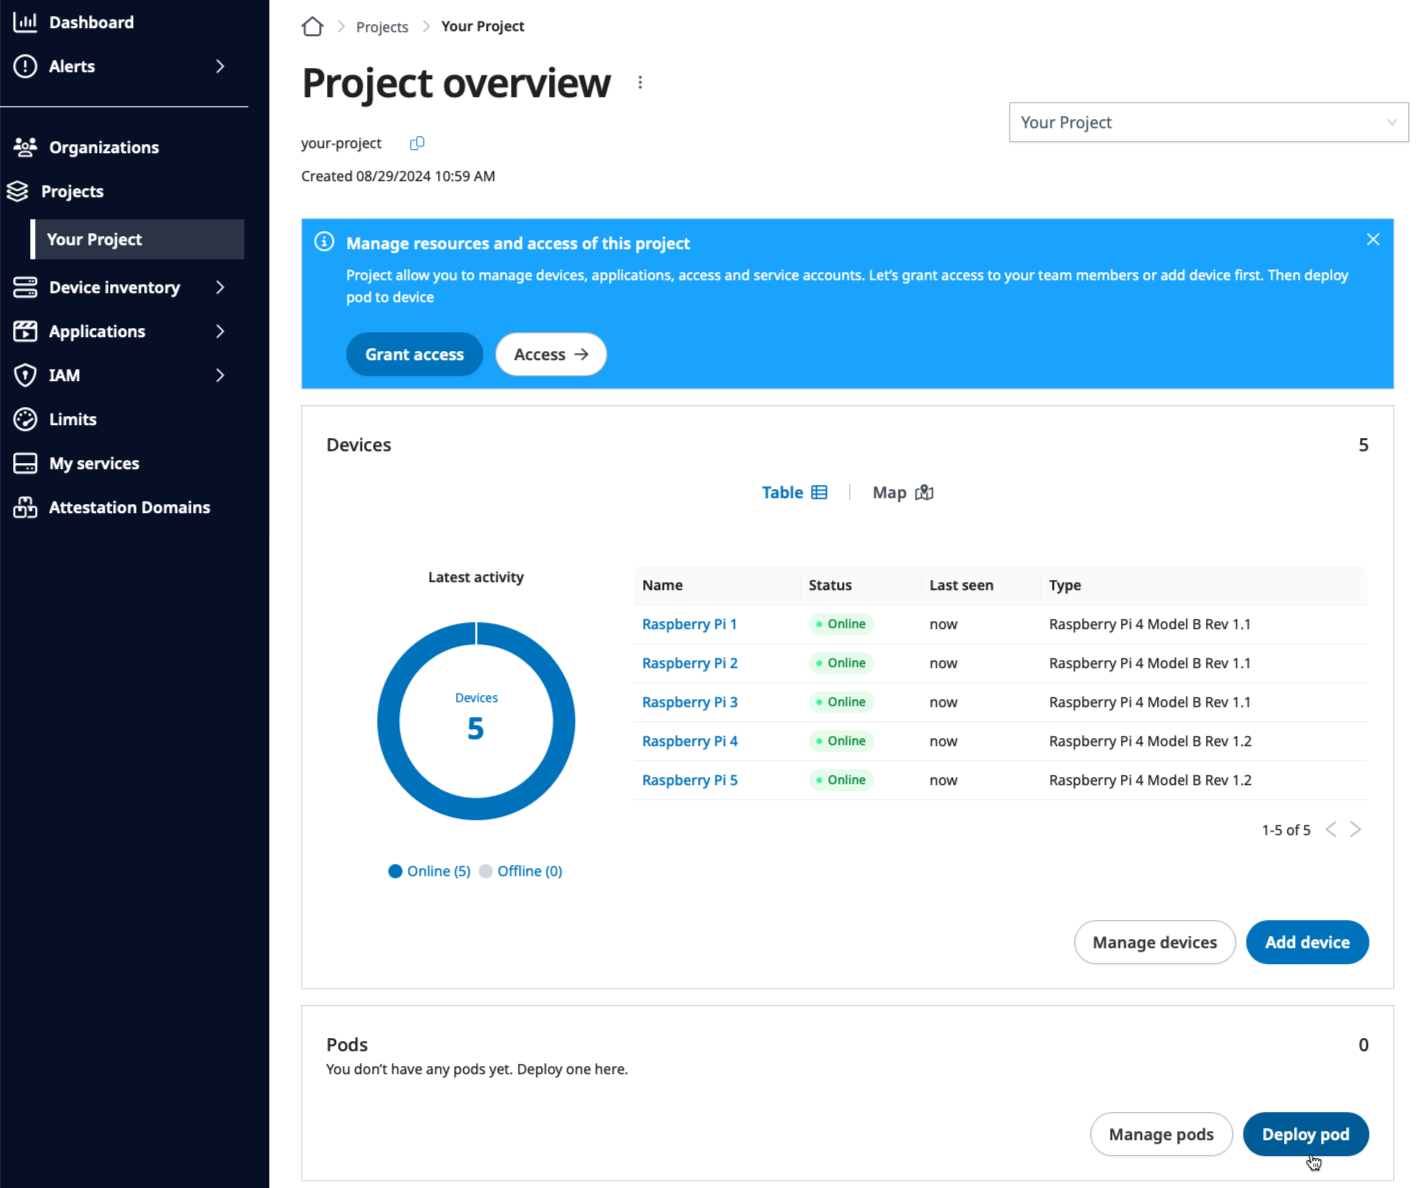
Go to the project overview page and click Deploy pod.
Deploy pod button on the Project overview page.
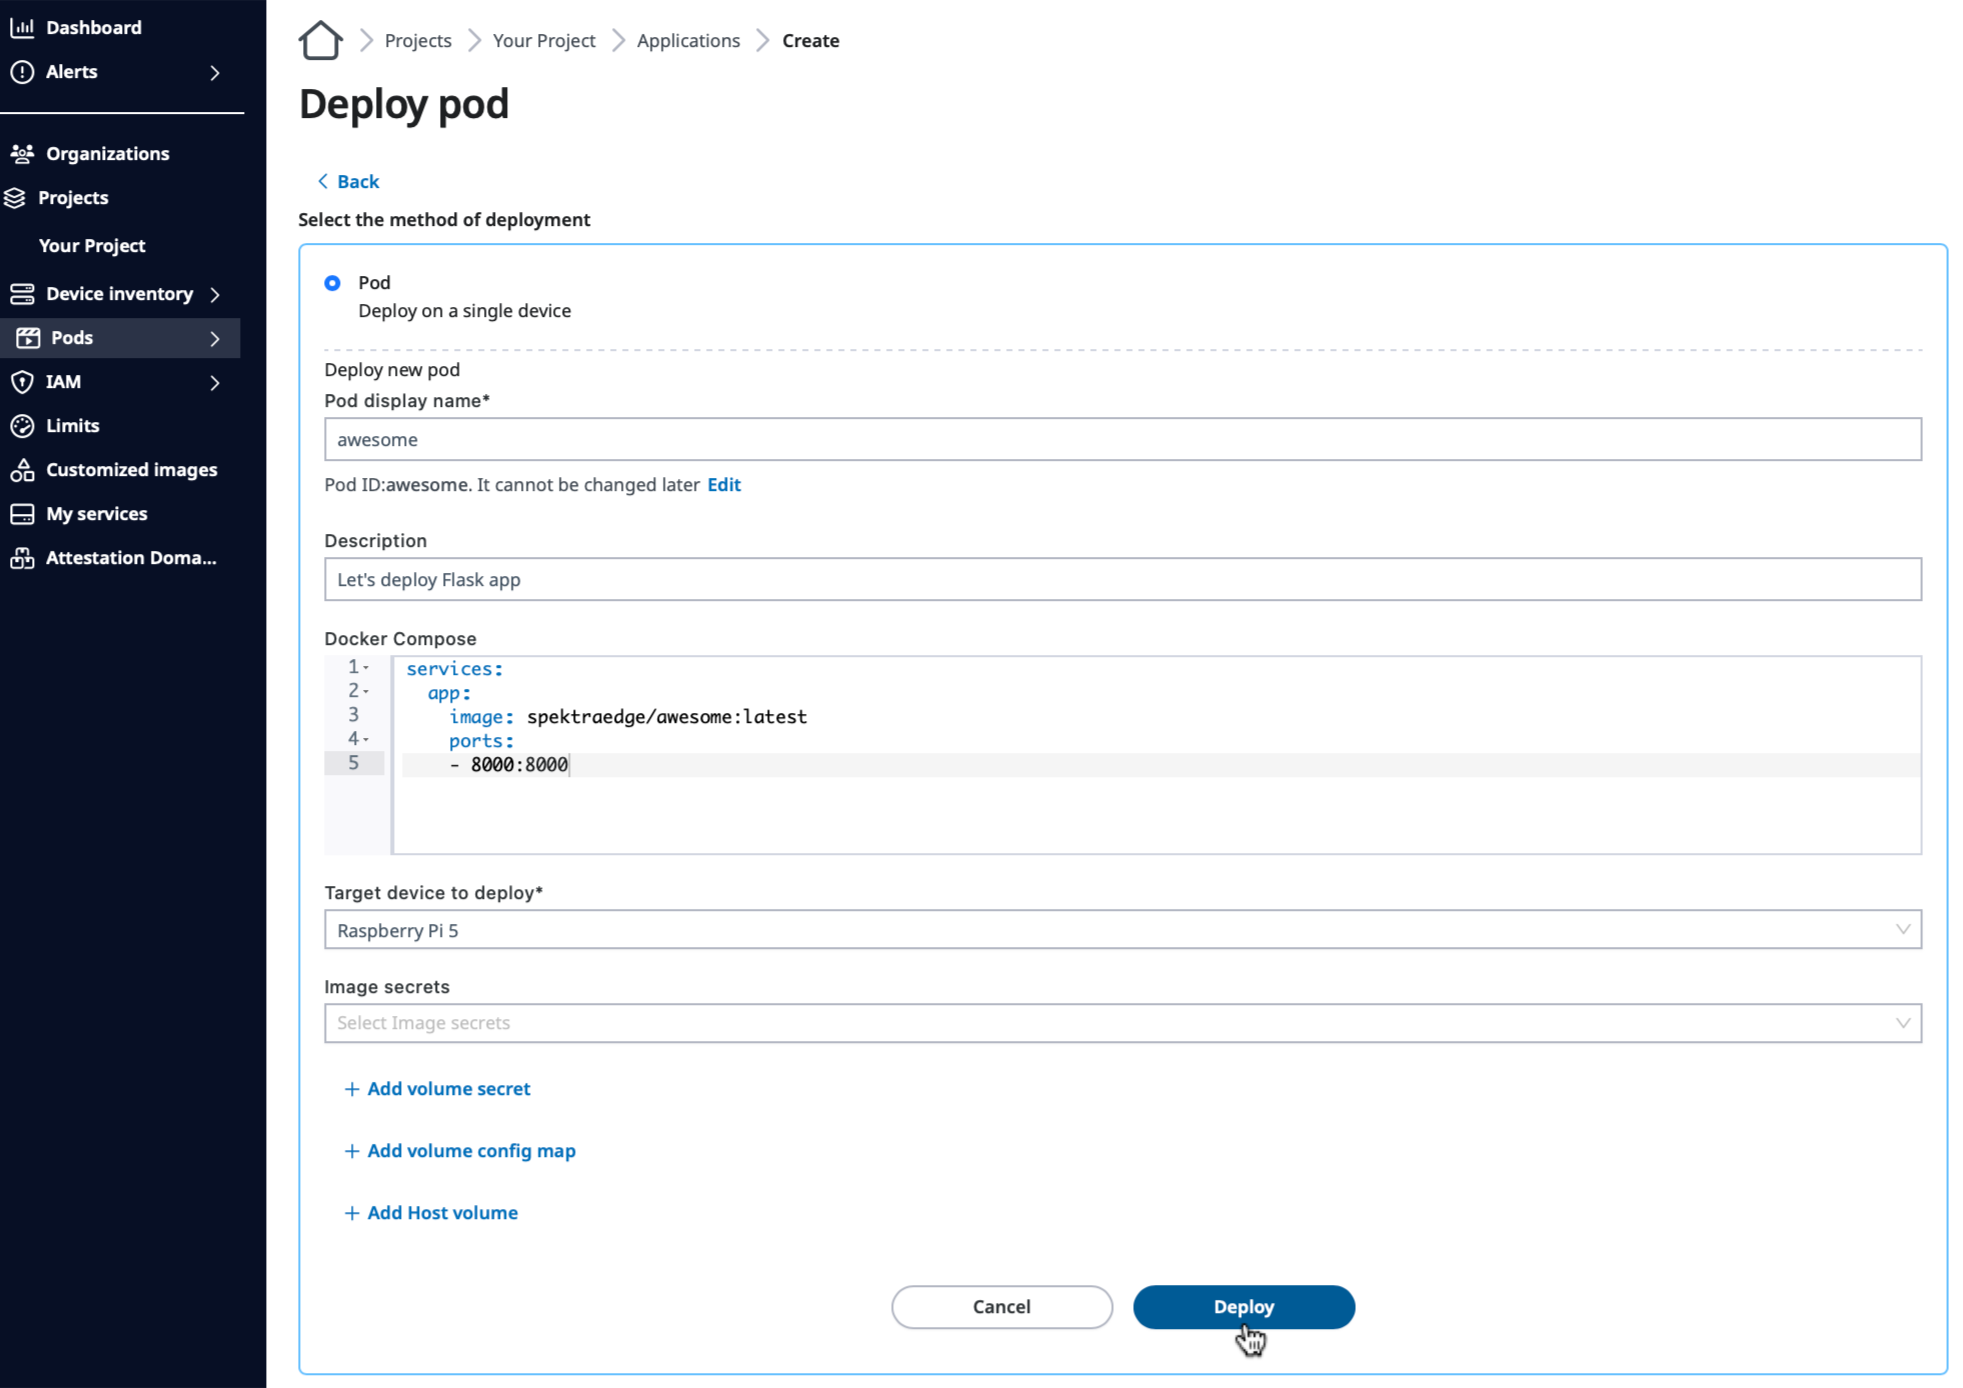
Select Deploy on a single device option and provide the following
information.
Application name
Application description
Docker compose, compose.yaml file for your reference
Target device to deploy
Deploy on multiple devices
You can deploy applications on multiple devices on SPEKTRA Edge. Please
take a look at the multiple devices page for more detail.
Then, click Deploy to deploy your application.
Deploy button on the Deploy pod page.
Congratulations!
You now deployed your application on your device through the SPEKTRA Edge
dashboard.
Verify your application
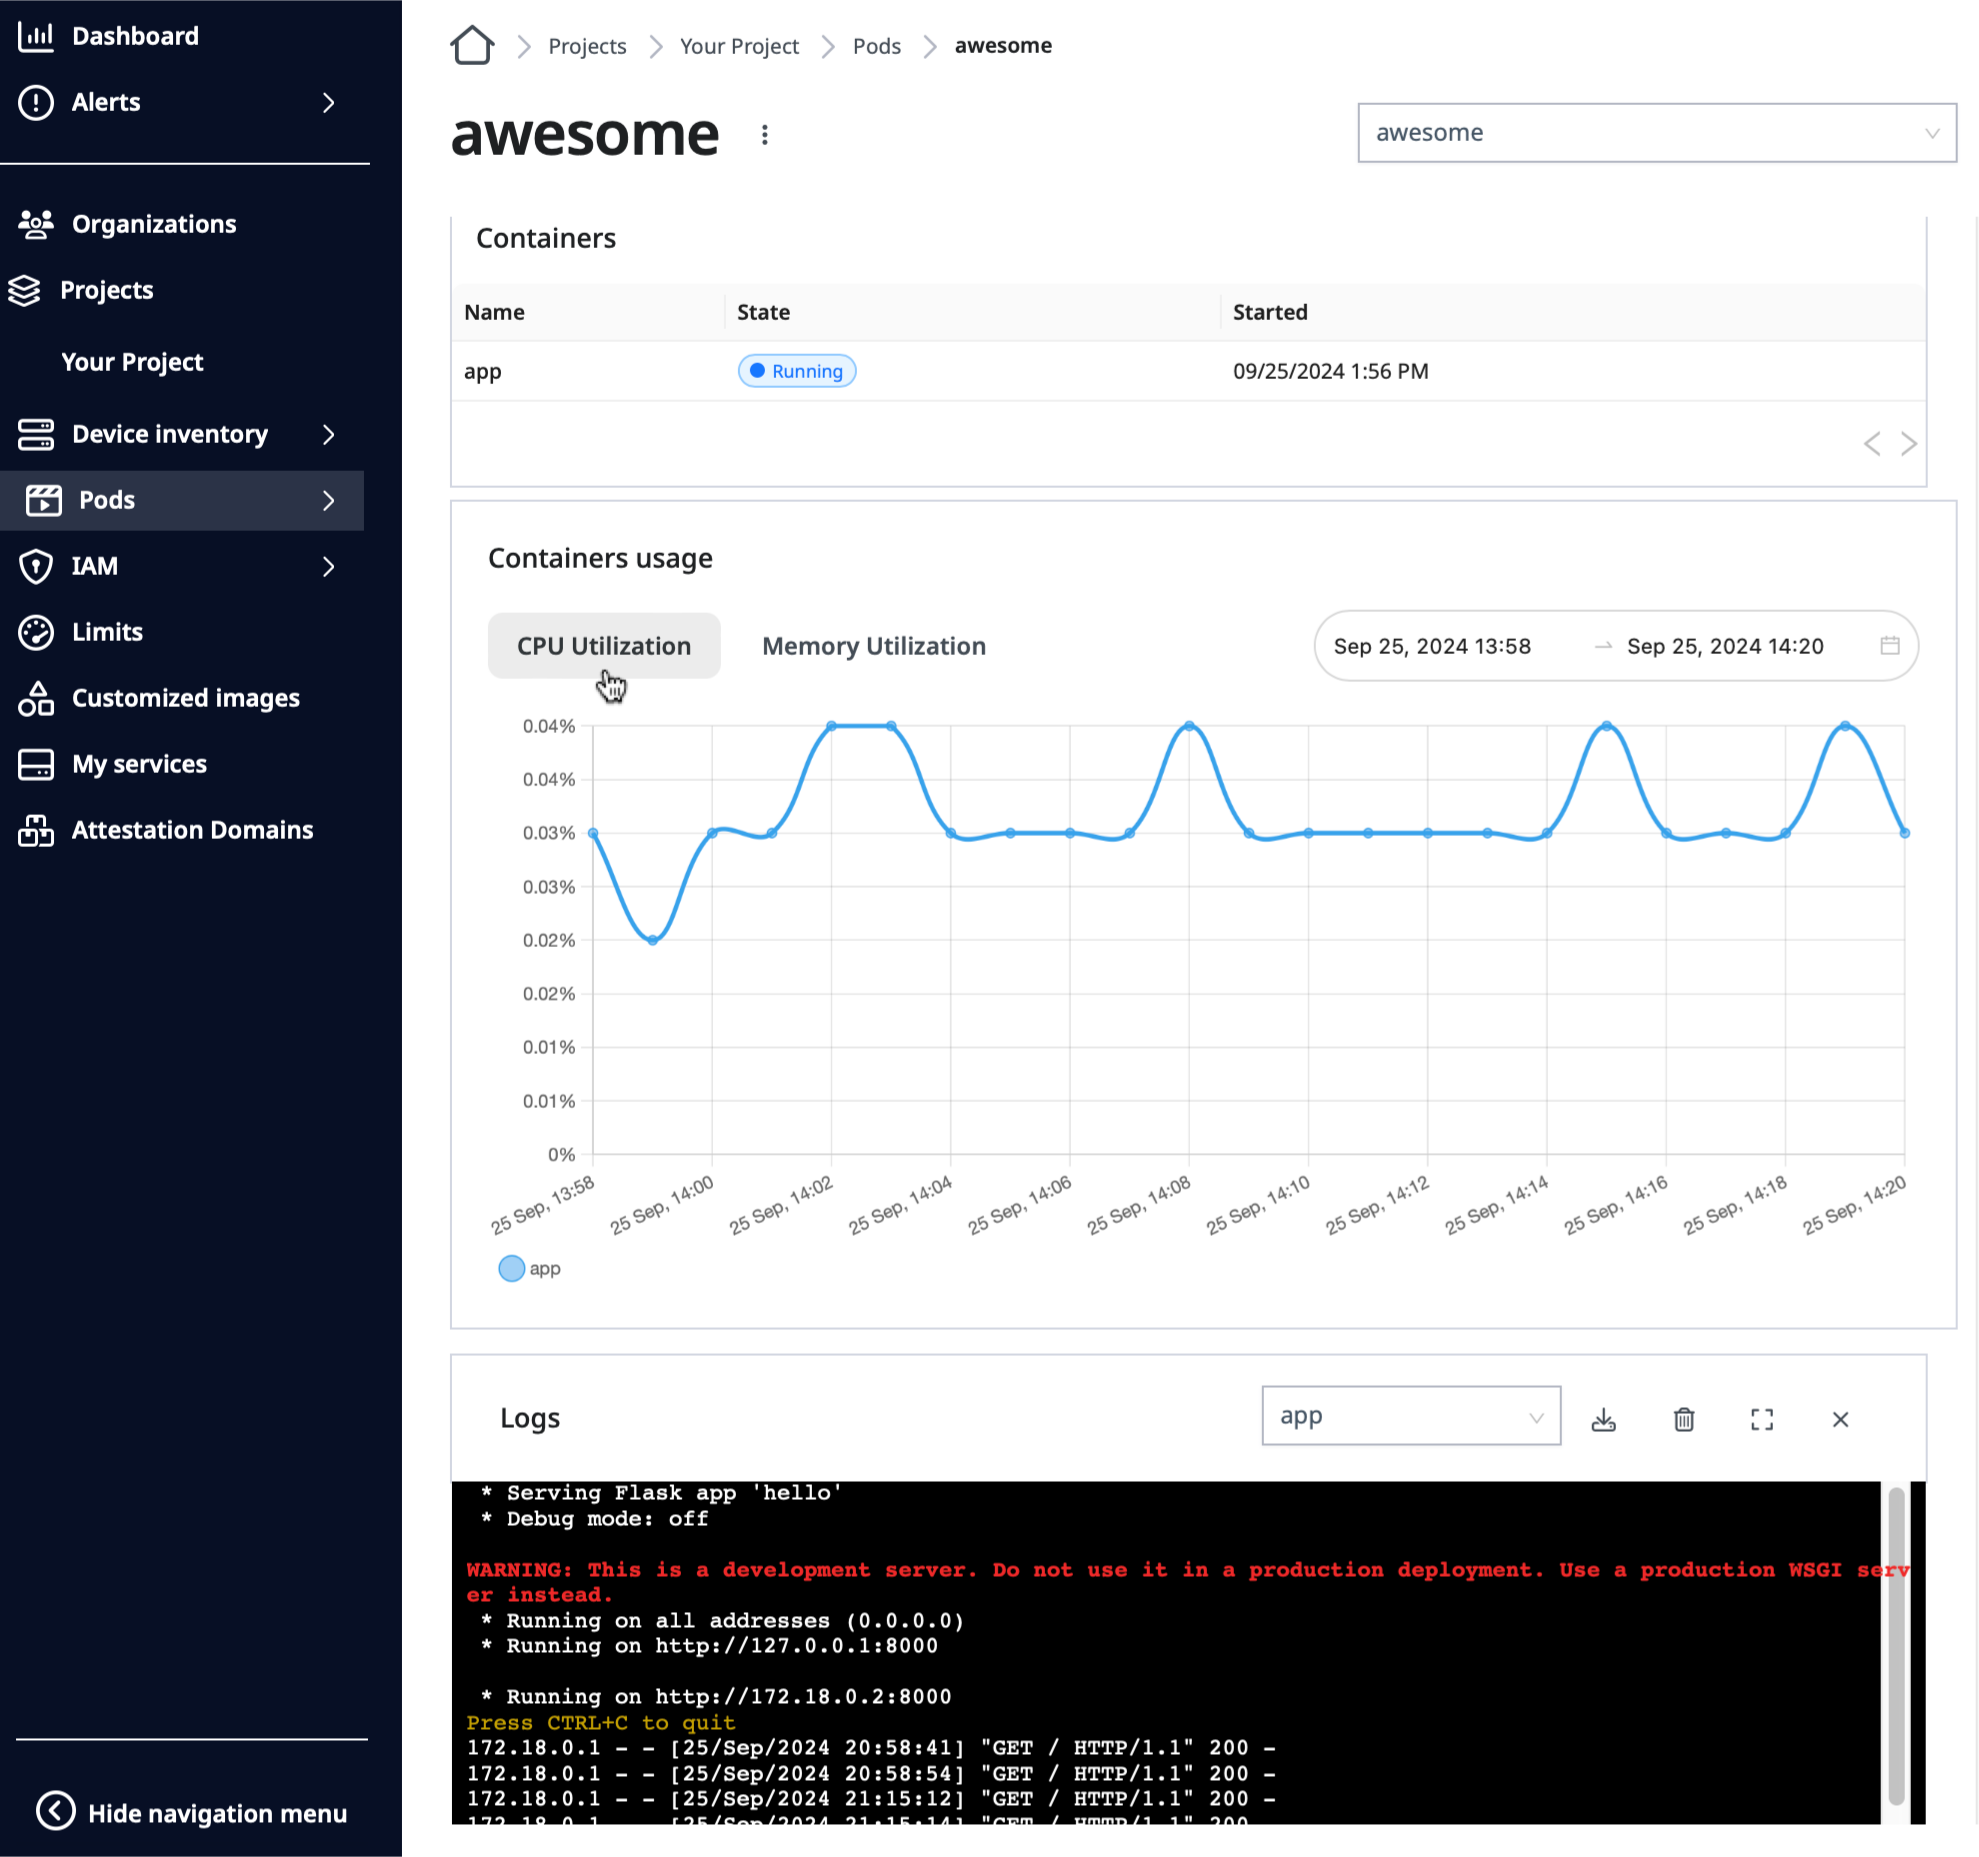
You can verify your application’s health from the SPEKTRA Edge dashboard.
The application page provides the following statistics:
Application’s overall status
Each container’s status
Each container’s CPU utilization
Each container’s memory utilization
Application’s logs
CPU Utilization button on the Application page.
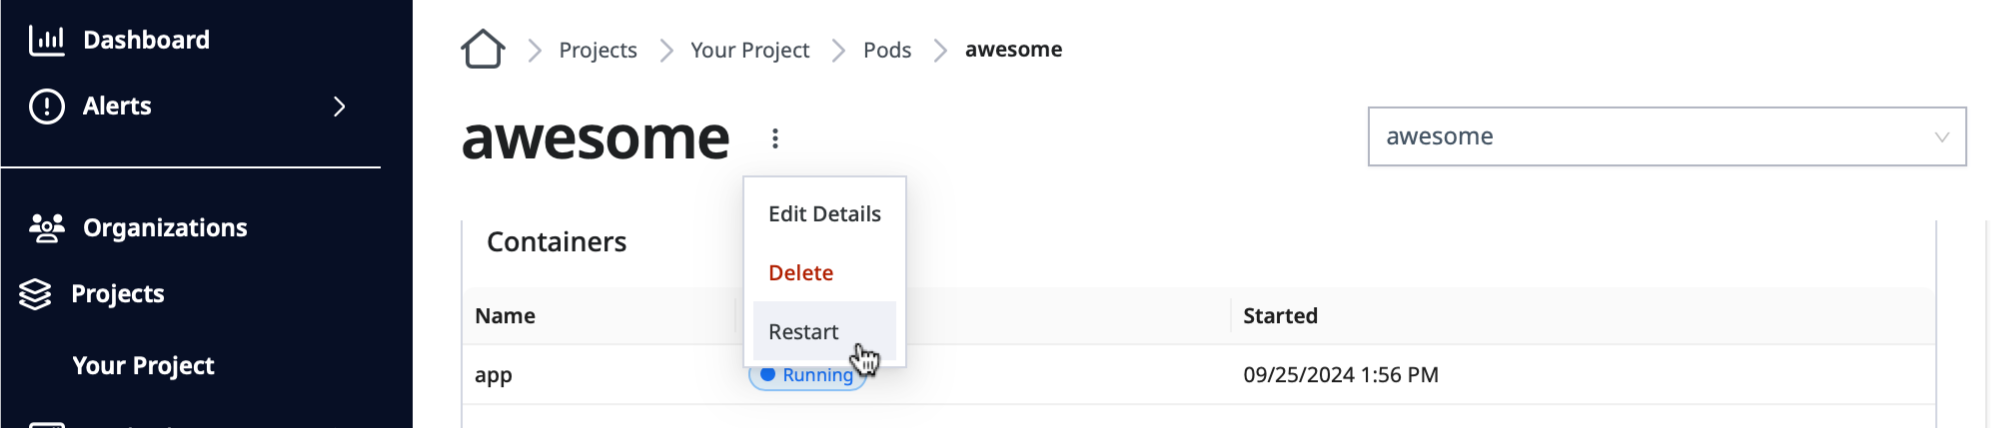
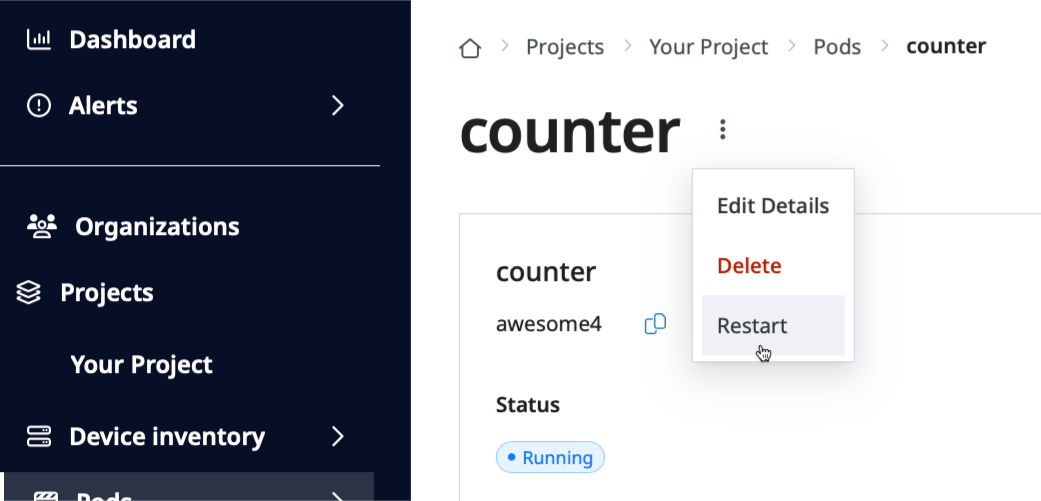
You can also restart the application by clicking the Restart option
of the drop down menu right next to the application’s name:
Restart option on the Application pull-down menu.
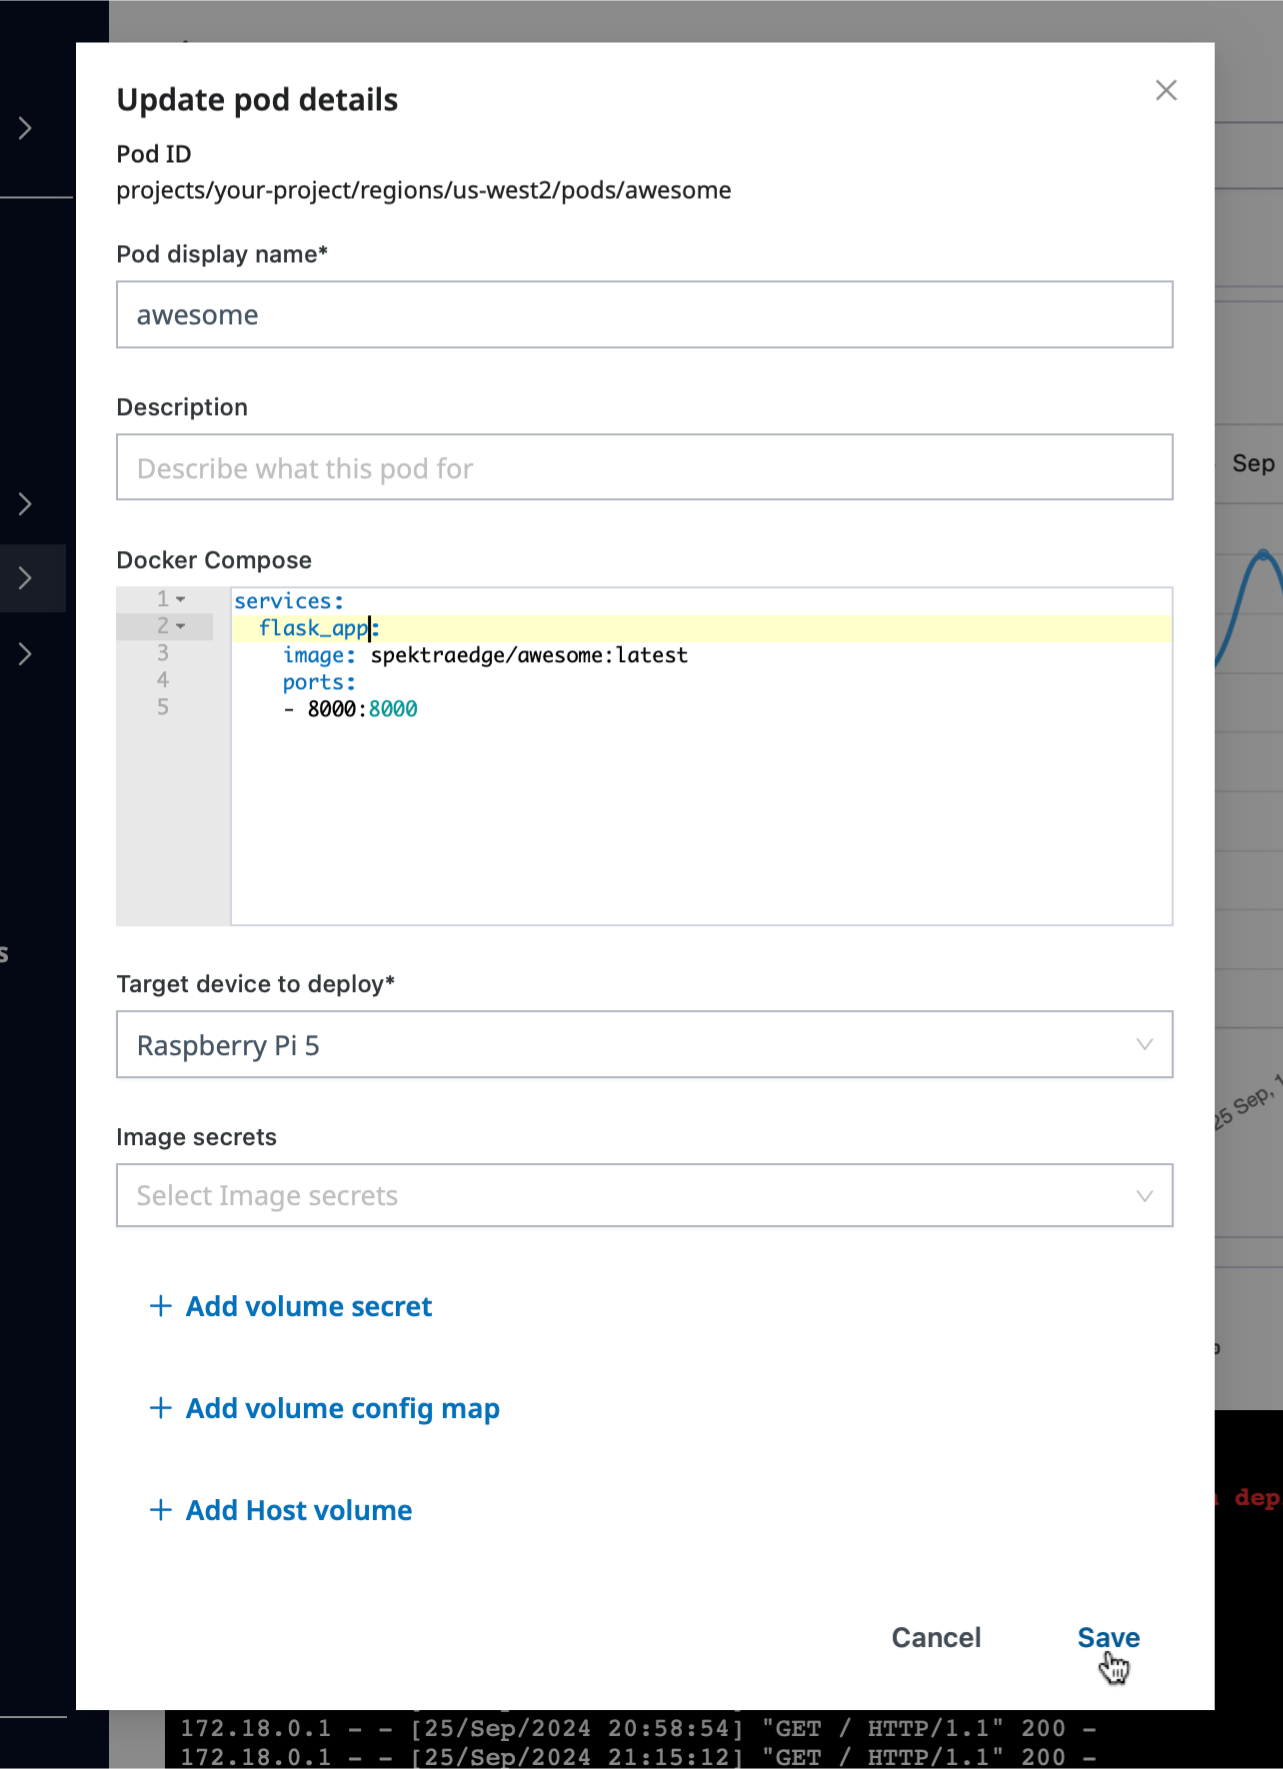
Or you can edit the applications, e.g. compose.yaml, by clicking the
Edit option of the drop down menu right next to the application’s name:
Editting Docker compose file in the Update pod details pane.
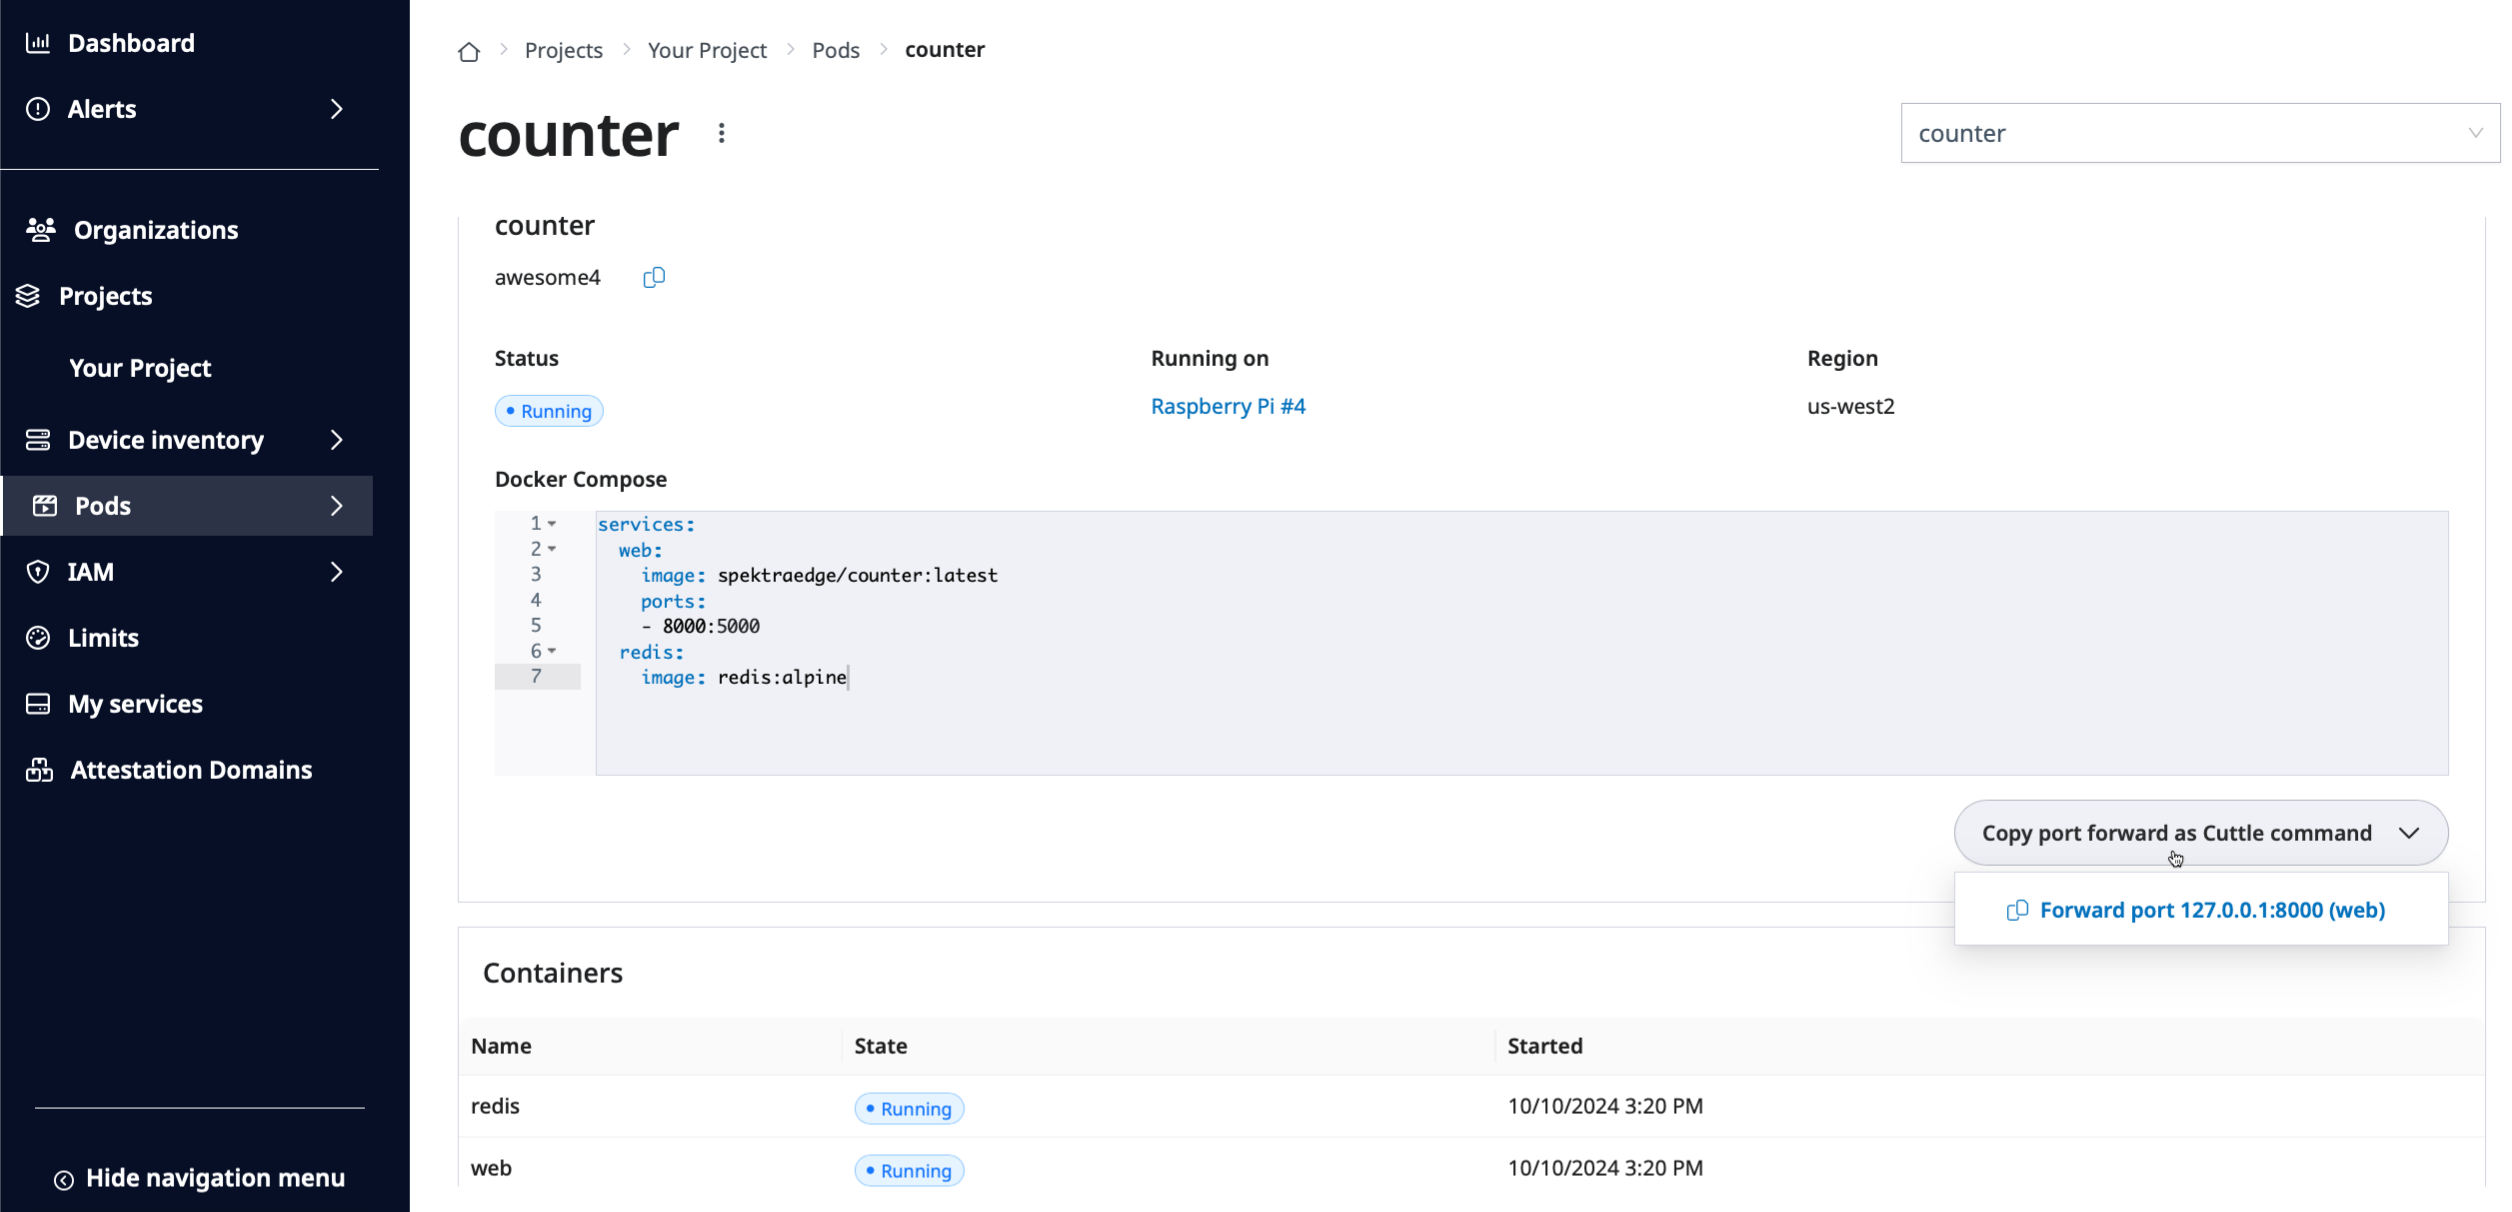
Now, let’s access your application from your local machine by
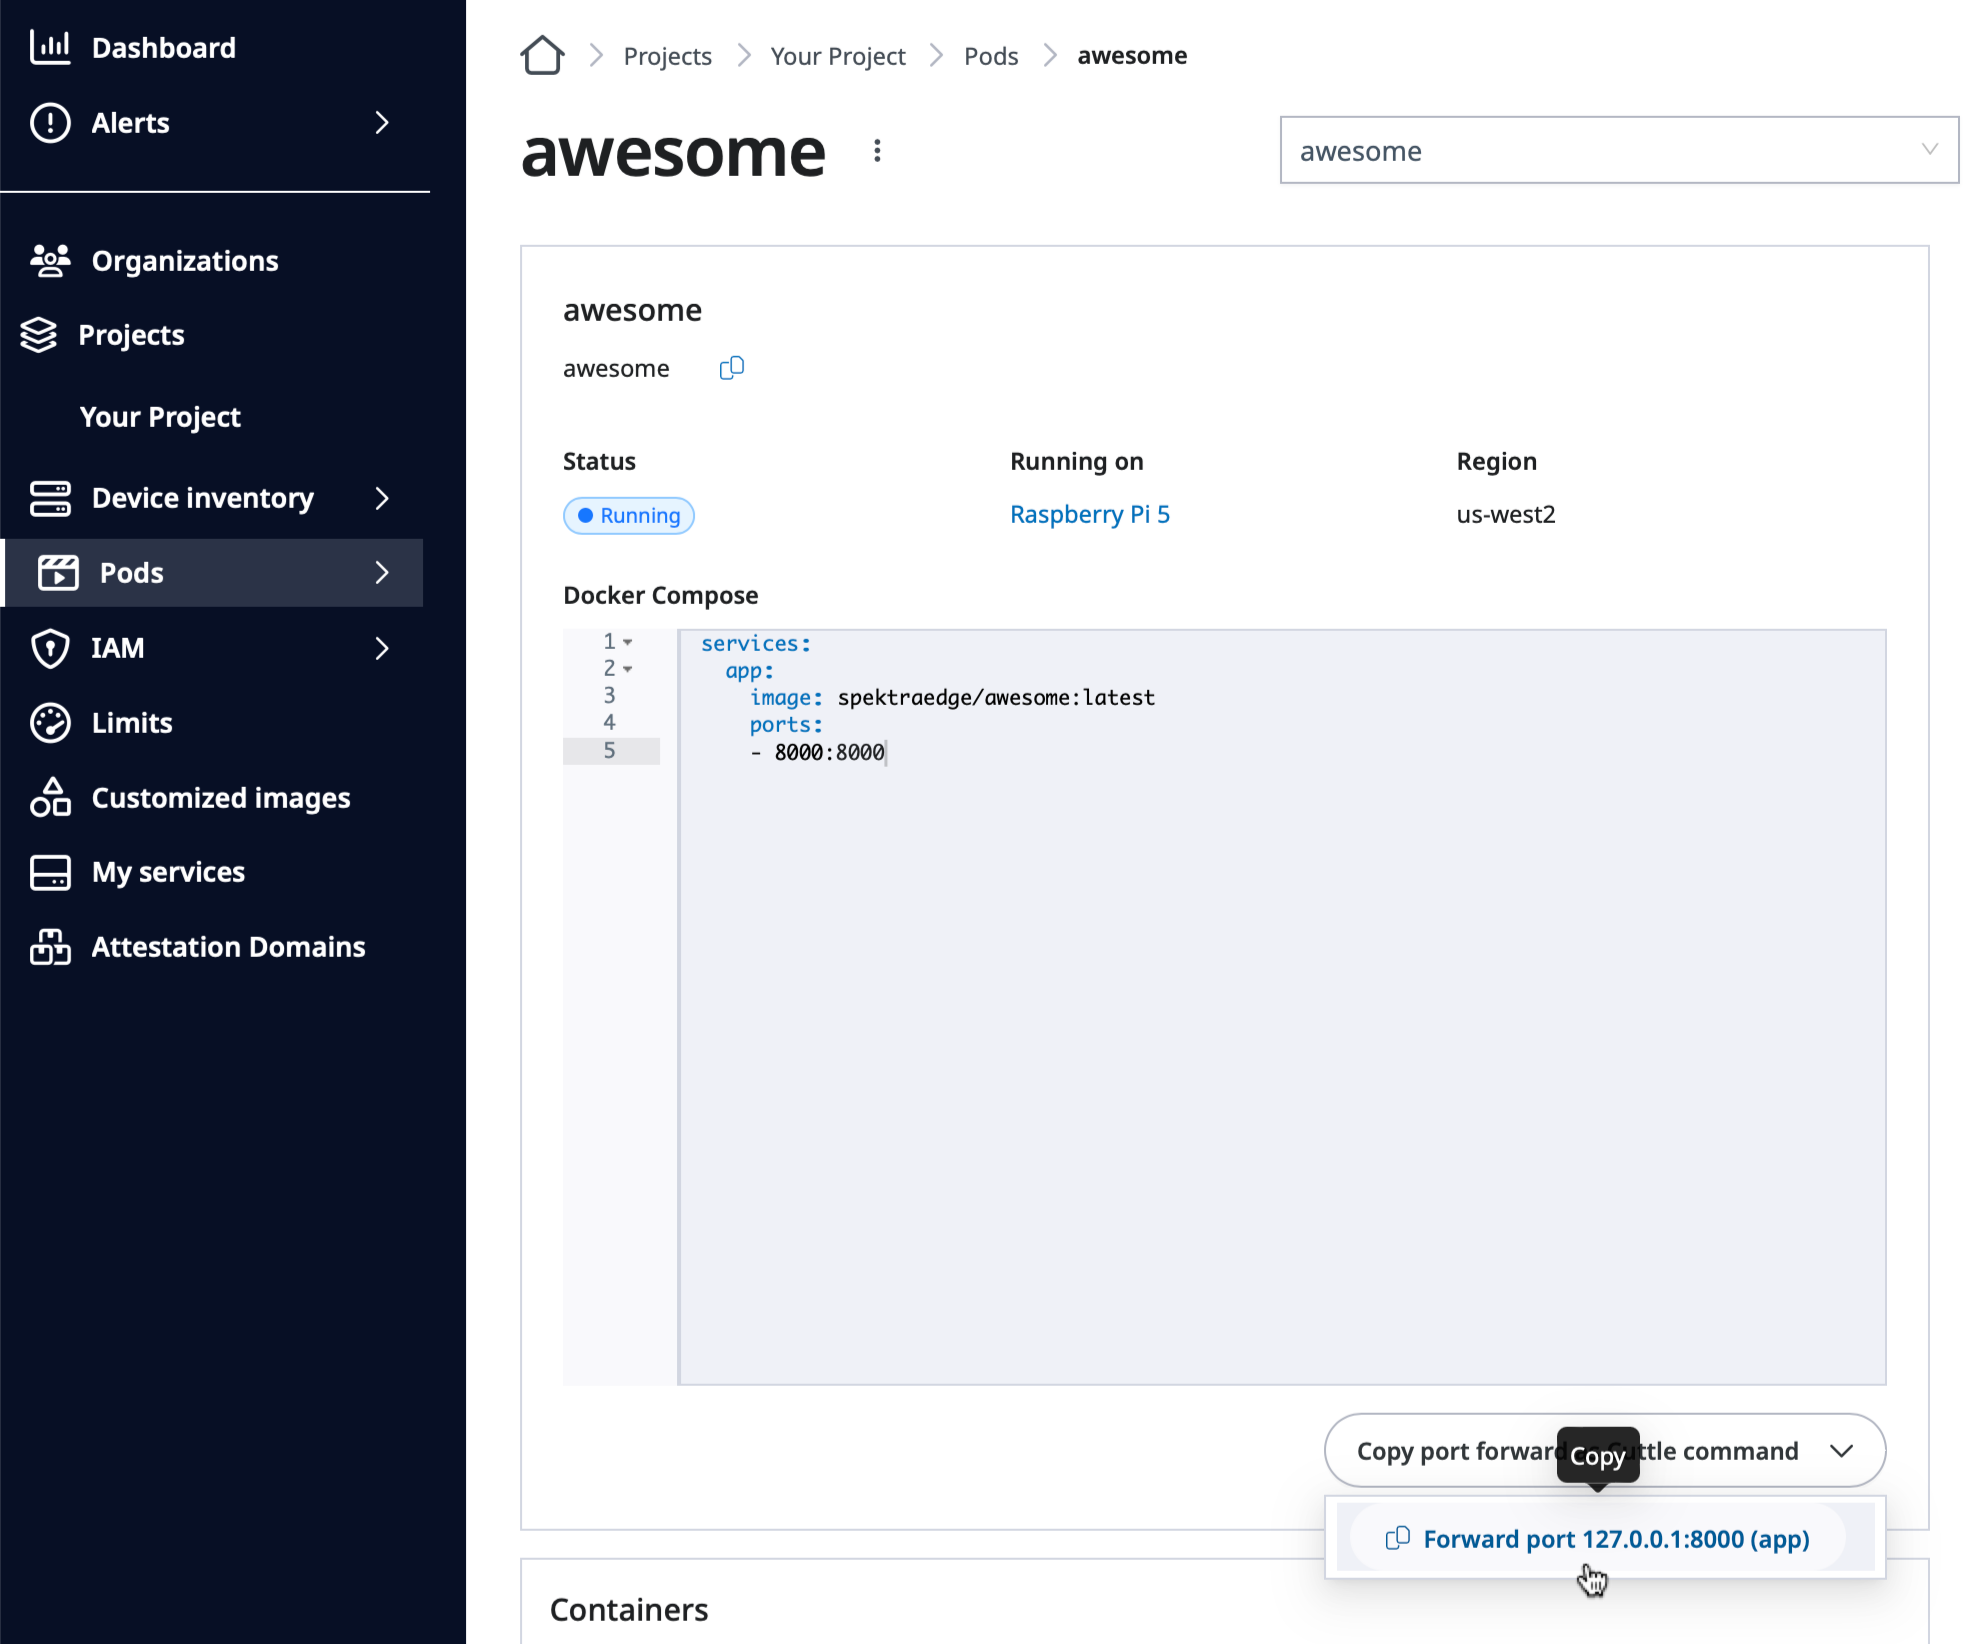
utilizing the SPEKTRA Edge port-forwarding feature. Simply copy
the cuttle command provided by the dashboard located under
the Docker compose section:
Copy Port forward command option on the Application page.
Open the terminal on your local machine. Paste the command you just copied
onto your terminal and run it to enable the port-fowarding to access your
application from the local machine.
Here is the example port-forward command for your reference. It enables
your application, which is listening on device’s port 8000, reachable
through your local machine’s port 8000.
With the above port-forwarding command running, point your browser to
http://localhost:8000 to access your
application from your local machine.
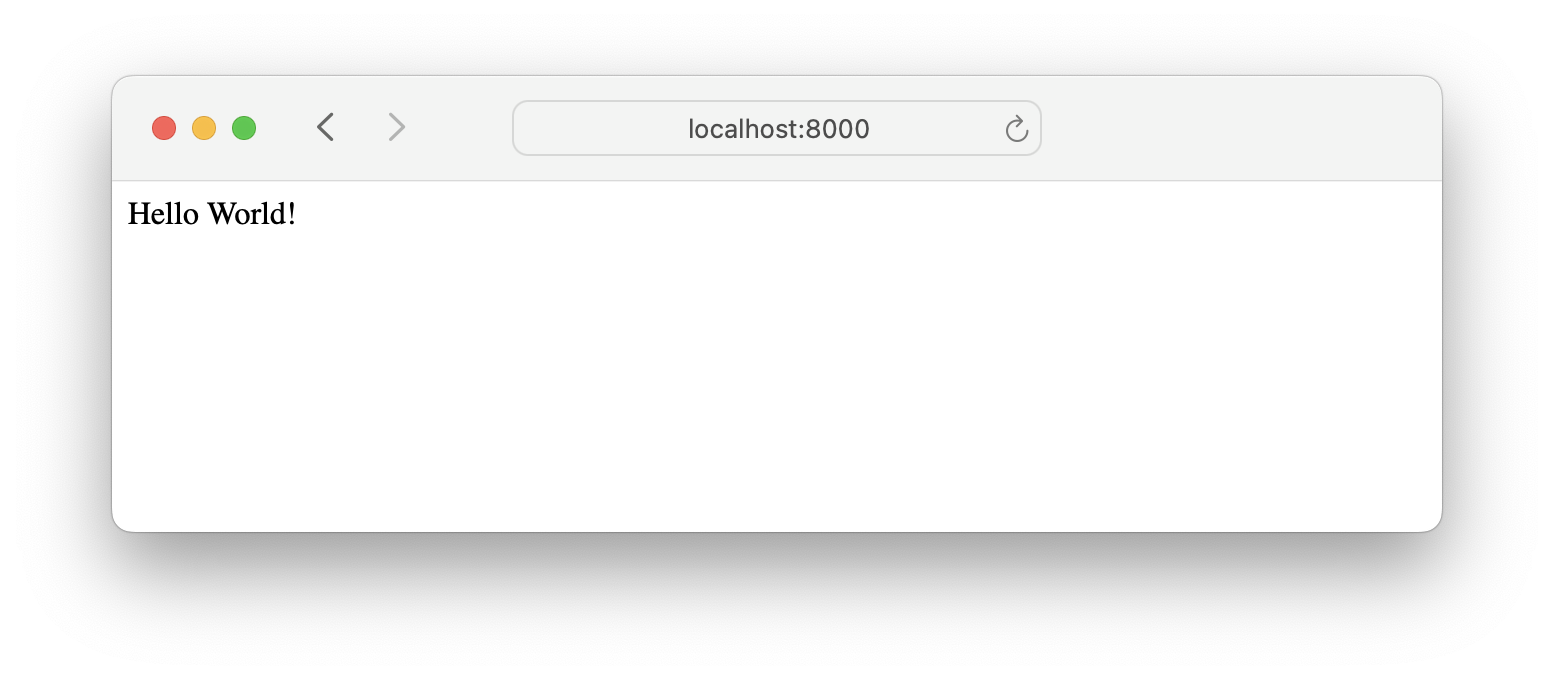
You will get the same result you got during the local verification.
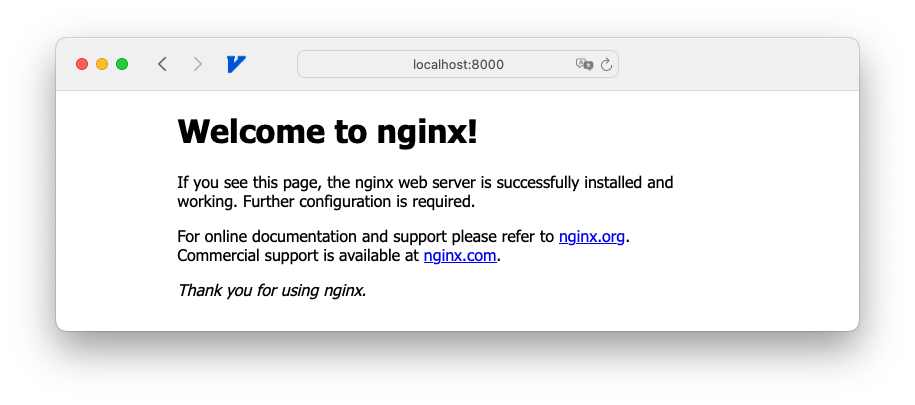
Successfully accessing the application running on your device.
Next step
With the application deployed on your device, let’s learn how to
monitor and control applications on SPEKTRA Edge.
1 -
Configure applications via configuration maps
Let’s learn how to configure applications via configuration maps on SPEKTRA Edge.
A configuration map allows you to decouple environment-specific configuration
from your application images, so that your applications are easily portable.
You can map the application configuration to the particular containers under
the application with the following steps:
Create an application with docker compose volumes service attribute
to describe the configuration to be mounted on the container
through the following two in-direction:
Host volume to mount the configuration to the host
environment so that the application can mount the configuration to
the particular container.
We’ll use the Nginx application and source the configuration file through the
configuration map to demonstrate how to use the configuration map on SPEKTRA Edge.
And also, the cuttle CLI command is necessary to complete this tutorial,
which is used to access the Nginx application from the local machine for the
verification purpose. However, it is not required for deploying applications
on SPEKTRA Edge.
Note
The getting started guide will help you to set
those requirements up. Please go through the guide in case if you
miss some of those.
Application files
compose.yaml
It’s a simple Nginx application with mapping the port 8000 with the configuration
directory mounted through the volumes attributes.
We recommend to use the /isodevice/data directory as the host side of the
volume mount entry point. It’s a persistent file system and will keep the mapped
contents even through the power cycle.
nginx.conf
Here is the Nginx configuration file, which will be mapped to the application
through the SPEKTRA Edge configuration map.
It’s a simple configuration file, which make it listen on the port 8000,
instead of port 80. Since we override the default configuration, we also
sets the content root to the default Ngnix content directory with root
directive.
server {
listen8000;
root/usr/share/nginx/html;
}
Nginx beginner's guide
Please take a look at the Nginx beginner’s guide if you are not
familier with the Nginx configuration file format.
Deploy the application
Let’s deploy the application with the configuration map on SPEKTRA Edge.
the host volume to mount the configuration to the host
environment for the load balancer container to mount the configuration
file to.
Let’s do it.
Create a configuration map
Let’s create a configuration map to store the Nginx configuration file
on SPEKTRA Edge.
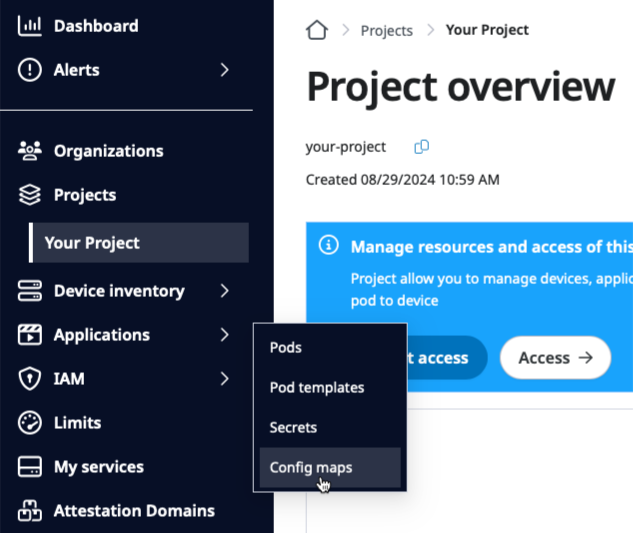
First, select the Config maps option of the Applications pull-down menu.
Select Config maps option from the Applications pull-down menu.
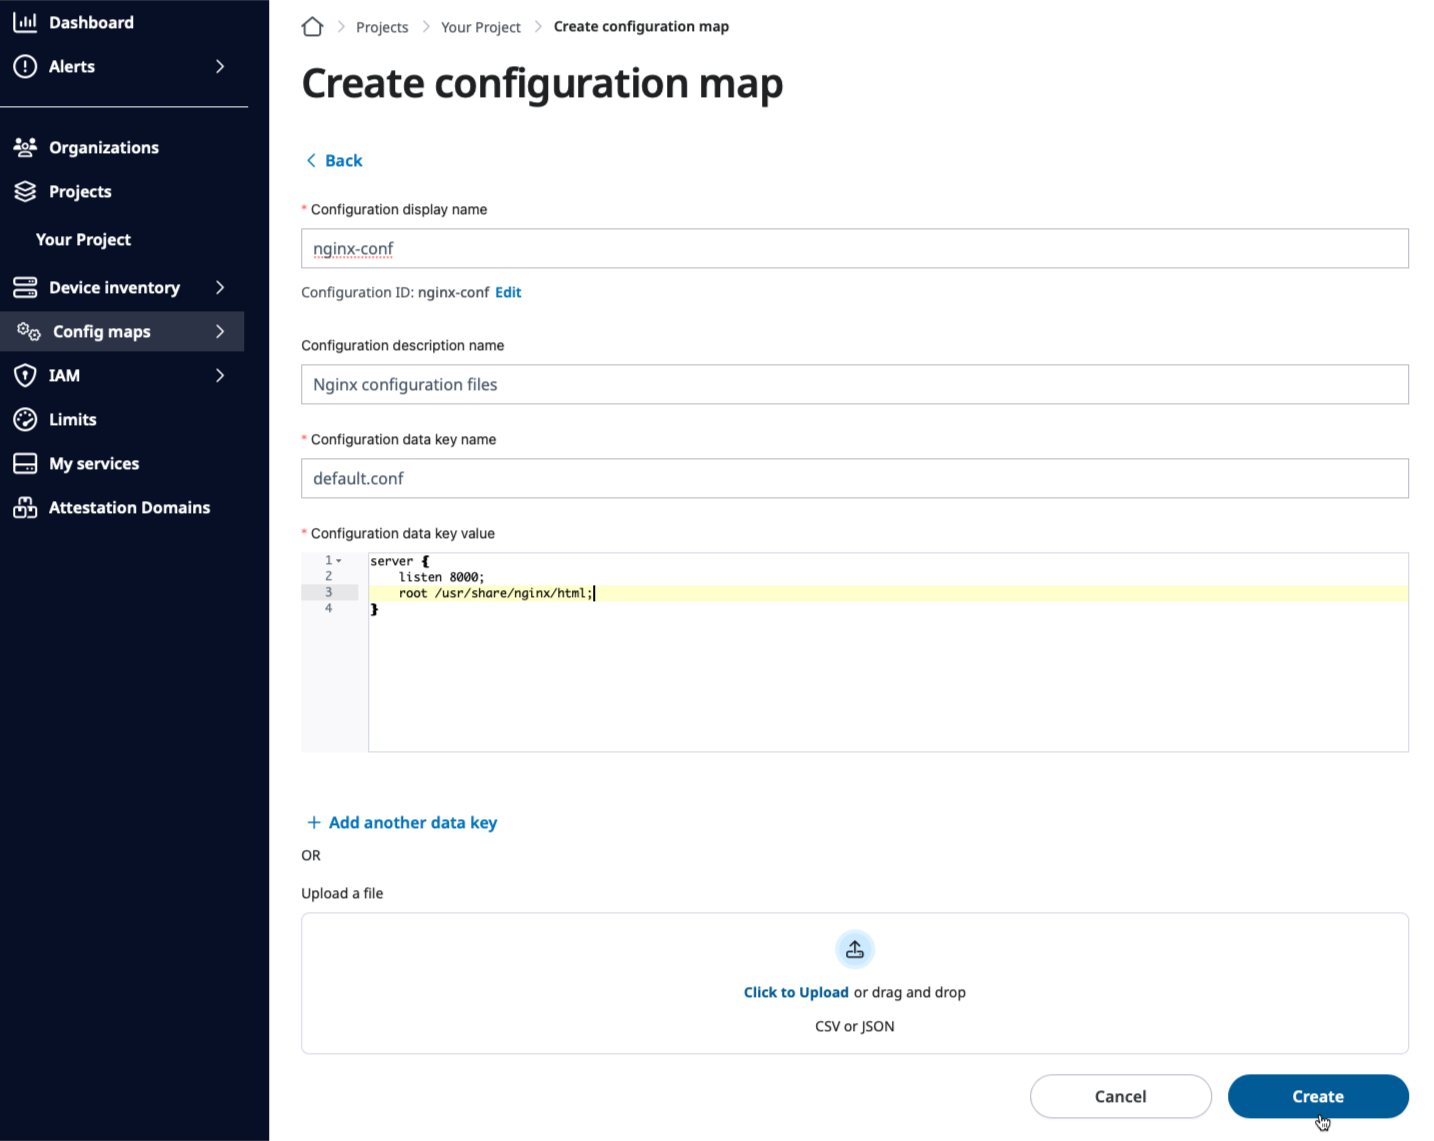
Then, create a configuration map by pasting the nginx.conf file
content in the data key value field with the default.conf as the data key name.
Create configuration map by pasting the nginx.conf content in the data key value field.
Make sure you set:
nginx-conf as the configuration map name
default.conf as the configuration data key name
Those names are important because it’s referenced by the other object in
the later steps.
Create the application
With the Nginx configuration map ready, let’s deploy the application.
Here is what we’ll do:
Paste the docker compose file content to the
Docker Compose field
Create a volume config map for the Nginx configuration file mapping
Create a host volume to mount the above configuration map to the device
We’ll go over those points step-by-step below but first, let’s have
a Deploy pod page ready by clicking the Deploy pod button
on the Project overview page.
Click Deploy pod button on the Project overview page to deploy application.
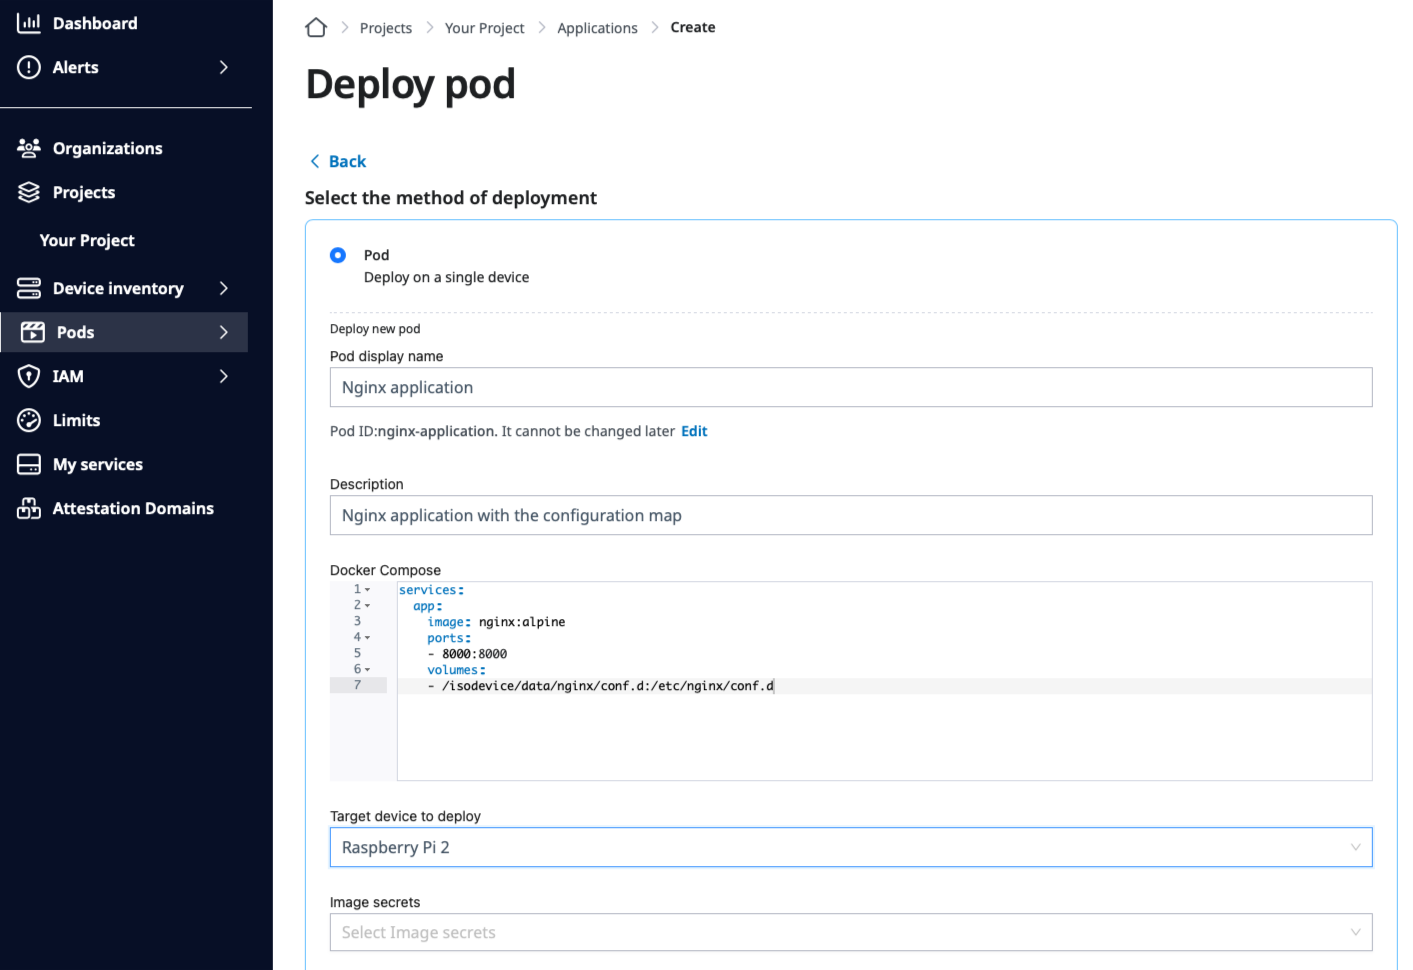
Docker compose file
Let’s paste the docker compose file to the
Docker Compose field of the Deploy pod page.
Docker compose section of the Deploy pod page.
Volume configuration map
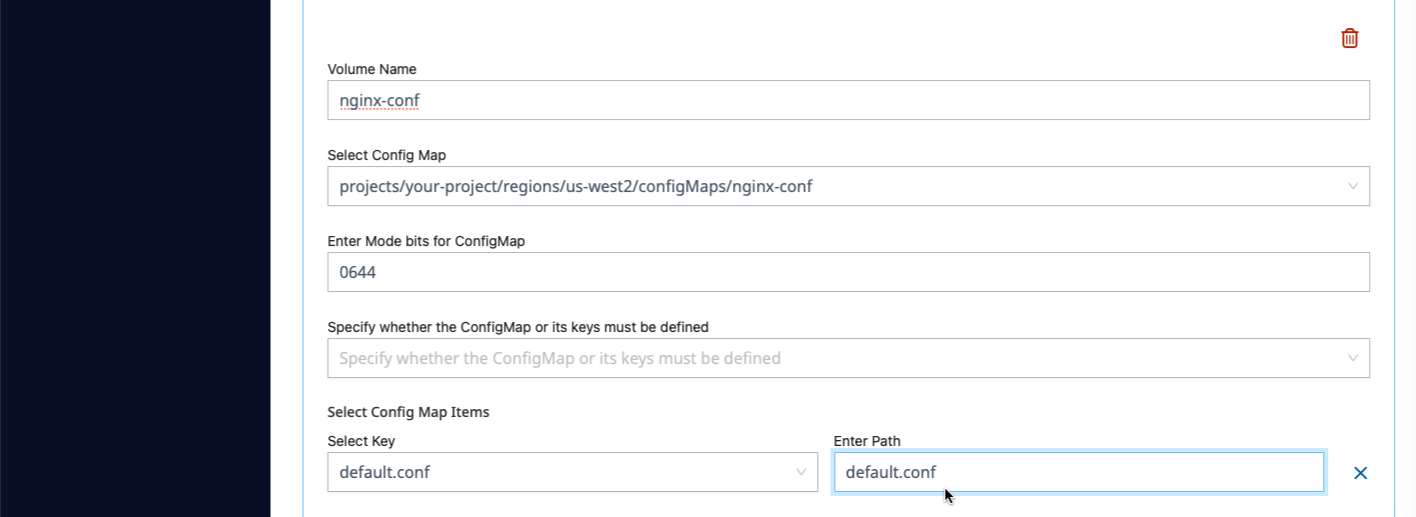
The next is the volume configuration map, which maps the Nginx configuration
file we created before to the application as a volume.
Volume config map section of the Deploy pod page.
Here is the key points to highlight:
Select the correct configuration map
projects/your-project/regions/us-west2/configMaps/nginx-conf for this example
Specify the correct select key of the configuration map item
default.conf in this example, as we specified as the key value name for
the Nginx configuration file when we created the configuration map.
Use default.conf for the path name of the select key
This is the file name which will be shown in the container. Nginx expects
this file name as the default Nginx configuration file.
Host volume
This is the last item to configure on the Deploy pod page.
It mounts the volume configuration map we create above to the host environment
of the device. This file will be mounted to the Nginx load-balancer container
through the docker compose file we explained before.
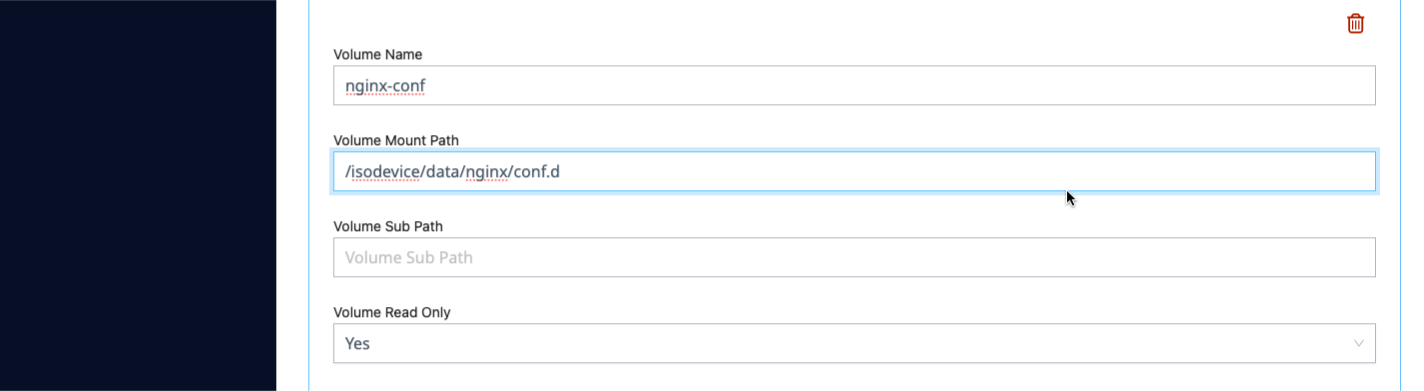
Host volume section of the Deploy pod page.
Again, there are a couple of things to make it right.
the volume name should match the name of the volume configuration map we
created above
nginx-conf in this example
the Volume mount path should be matched to the one specified in the
docker compose
/isodevice/data/nginx/conf.d in this example
Click to deploy
With all those configuration set, click the Deploy button on the Deploy pod
page to deploy the application on your device.
Click Deploy button on Deploy pod page to deploy the application.
With a minute or so, you should be able to see the application running on your
device, as below.
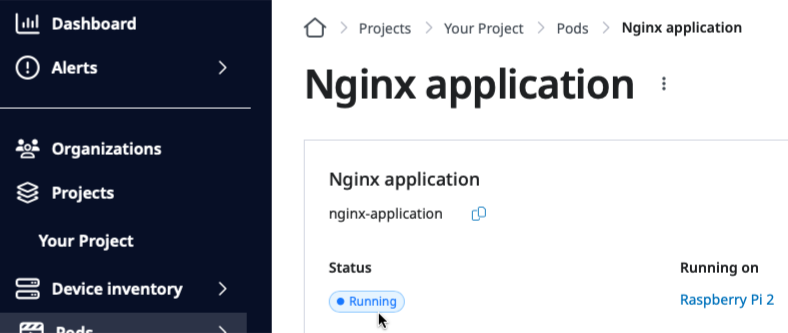
Running status shown on the application overview page.
Verify the application
Let’s verify the application by accessing it through the port forwarding.
Other ways to access your app
Port forwarding is great for reaching a remote device from your workstation.
If your clients are on the device’s local network, or you want containers to
talk to each other, see Access your deployed application.
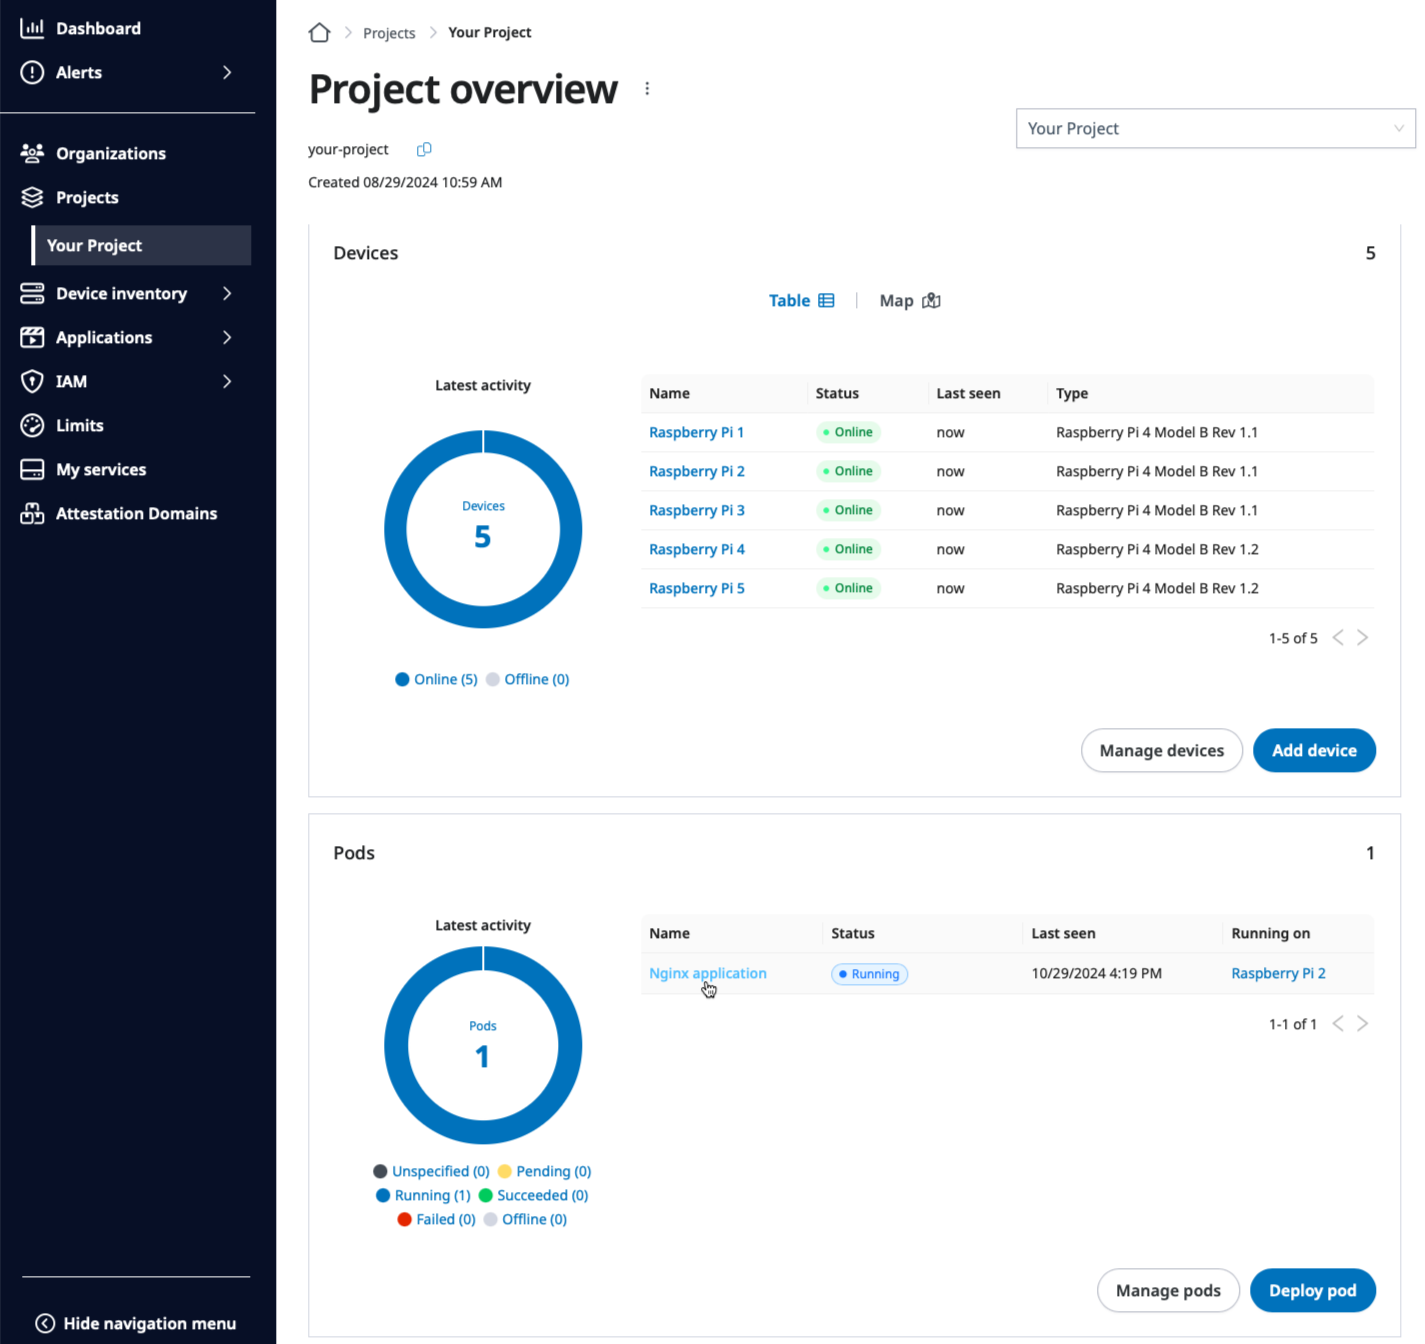
Go to the application overview page by clicking the name of the app,
Three tier web app in this example, on the Project overview page.
Click the name of the application on the Project overview page to go to the application overview page.
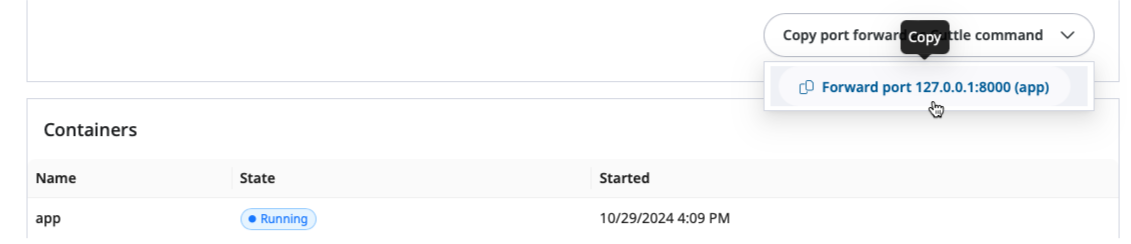
From there, copy the port forward command by clicking the
Copy port forward as Cuttle command button on the application overview page.
Copy the port forward command to access the Nginx service on the application overview page.
Run the command on your local terminal window to make your application accessible
from your browser.
Please note that the device name above will be different for your case.
Device name
The first argument of the port forward command above, which starts with
projects/, is the device name on which the application is running. It
contains both the project and the region name to differenciate from other
devices.
Point your browser to http://localhost:8000 and you should be able
to see the page below.
The Nginx application accessed through http://localhost:8000.
Next step
Congratulations on configuring the Nginx application with the configuration
map on SPEKTRA Edge.
Let’s go ahead and understand how to monitor and control applications
as the next step.
2 -
Deploy with private container registries
Le’s learn how to deploy applications from the private container registries.
SPEKTRA Edge supports private container registrie, sucn as Amazon Elastic Container
Registry, Azure Container Registry, or Google Artifact Registry, as the application
container registries.
In this document, we’ll learn how to configure the application on SPEKTRA Edge
to run the container image hosted on the Azure container registry, a private
container registry offered by Microsoft Azure.
Under that directory, run the following docker build command to create
the application image tagged with the Azure container registry and repotitory
name for the publication in the following step.
Please replace the registry and the repository name, spektraedge.azurecr.io
and awesome part above, to match your setup.
Refer to the official document for the private registry
creation on Azure.
Publish the image to the Azure container registry with docker push command.
docker push spektraedge.azurecr.io/awesome:latest
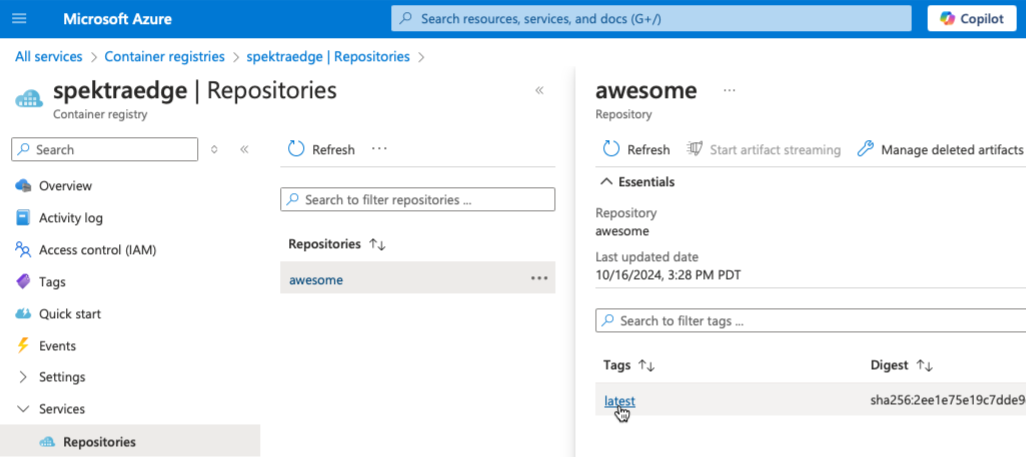
Once it’s pushed, go to the Azure portal and double check if the application
image correctly published on Azure container registry.
The application image on Azure container registry.
Great. You’ve successfully published the application image to the private
container registry.
Now, you’re ready to configure the application to pull the image from the
Azure container registry. But before that, let’s talk about the image
secrets next.
Image secrets
The image secrets is a special secret resource maintained by the SPEKTRA Edge
platform. It’s meant to be used for storing the credentials to access the private
container registries. Hence, we’ll configure the image secrets next before
configuring the applications.
Kubernetes private registry support
The SPEKTRA Edge image secret follows the convention used by the Kubernetes.
Please take a look at thier documentation about how to pull an image
from a private registry for more information.
Let’s create one here.
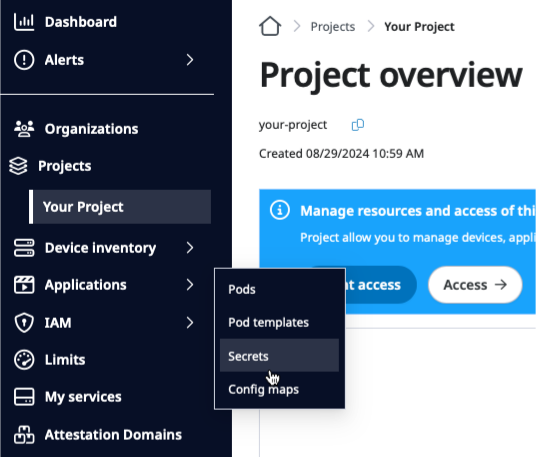
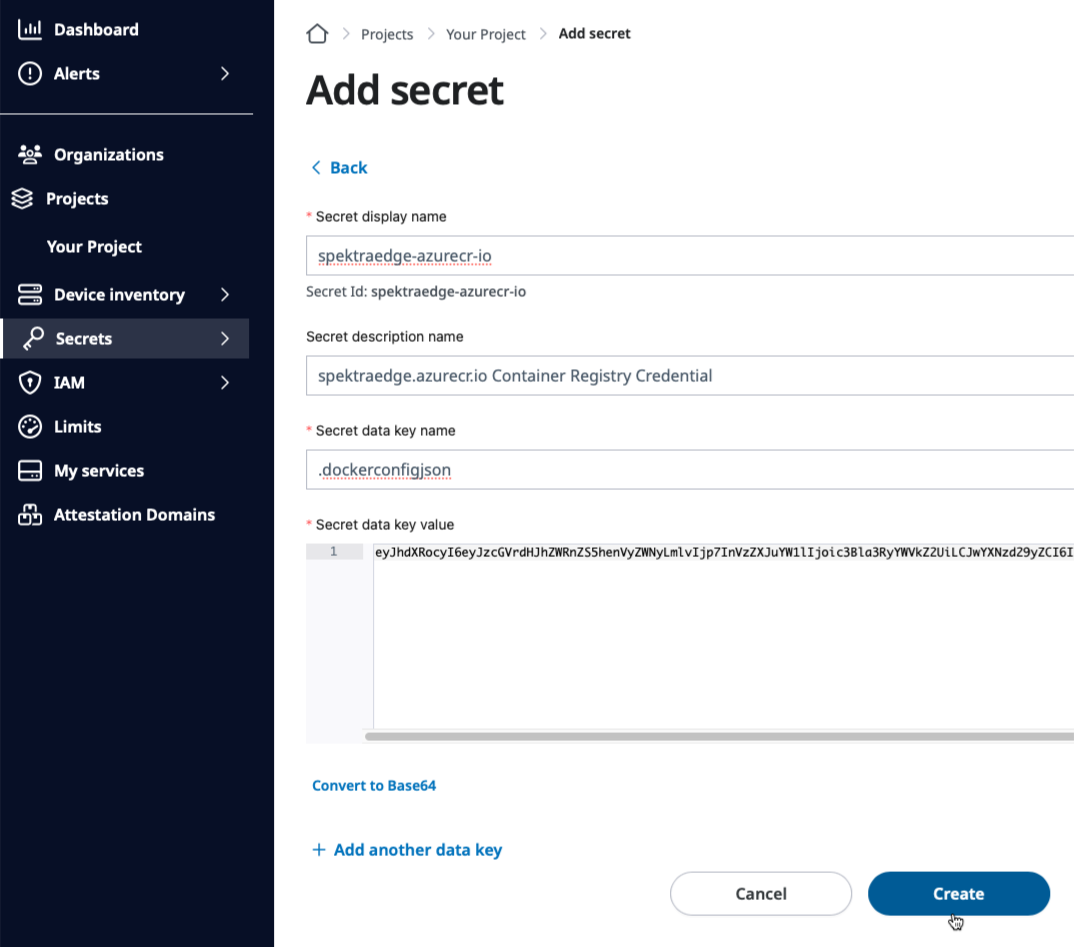
Go to the Secrets page by selecting the Secrets from the Applications
pull-down option from the left navigation menu.
Select Secrets option of Applications pull-down menu.
Click Add Secret button on the Secrets page to create a new secret.
Click Add Secret to create the image secret.
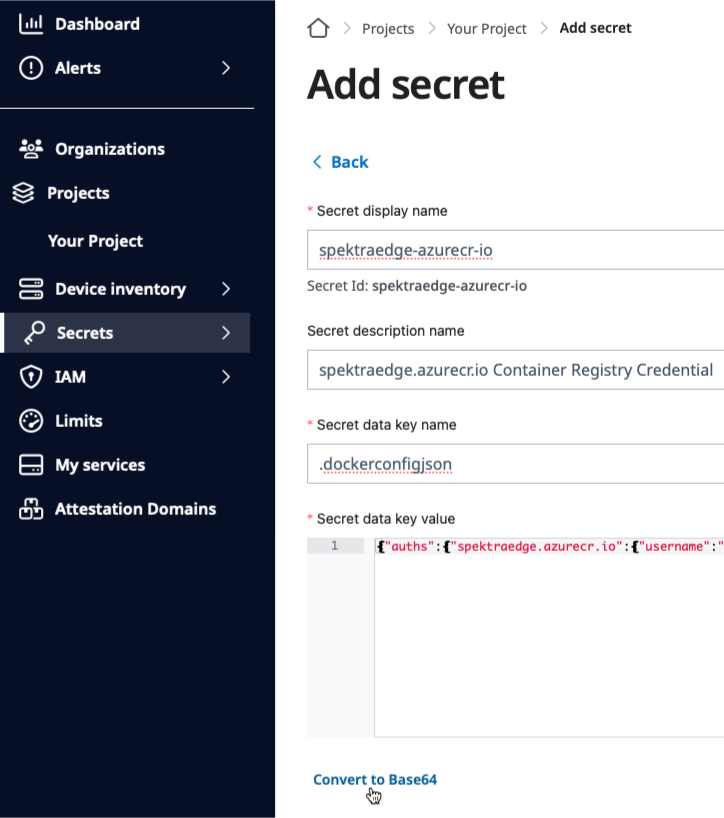
There are three mandately fields to create a secret. We’ll go over those
in detail in the following sections.
This is a case-incensitive alpha-numeric secret name referenced later by
the application configuration. Give it a descriptive name for the better
secret management.
Secret data key name
This field should be .dockerconfigjson. This follows the
Kubernetes convention.
.dockerconfigjson
Please don’t miss the first dot, the period, in the .dockerconfigjson
key name, or it would cause the image download error.
Secret data key value
This fields contains the base64 encoded private registry credential with
the following JSON format.
where you set $REGISTRY_NAME environment variable to your Azure container
registry name, e.g. spektraedge in this example.
Convert to base64
Once you have those three values ready, you paste those in the respective fields
and click Convert to Base64 button of the Add secret page.
Convert Data key value to base64.
Create the image secret
Click Create to create the image secret for the Azure container registry.
Create Image Secret with base64 encoded Data key value.
Please remember the Secret Name (ID), spektraedge-acurecr-io in this example,
for the later reference to deploy your application.
Deploy the application
For the application deployment, we’ll follow the standard application deployment
explained in the previous section except one field, the image secrets.
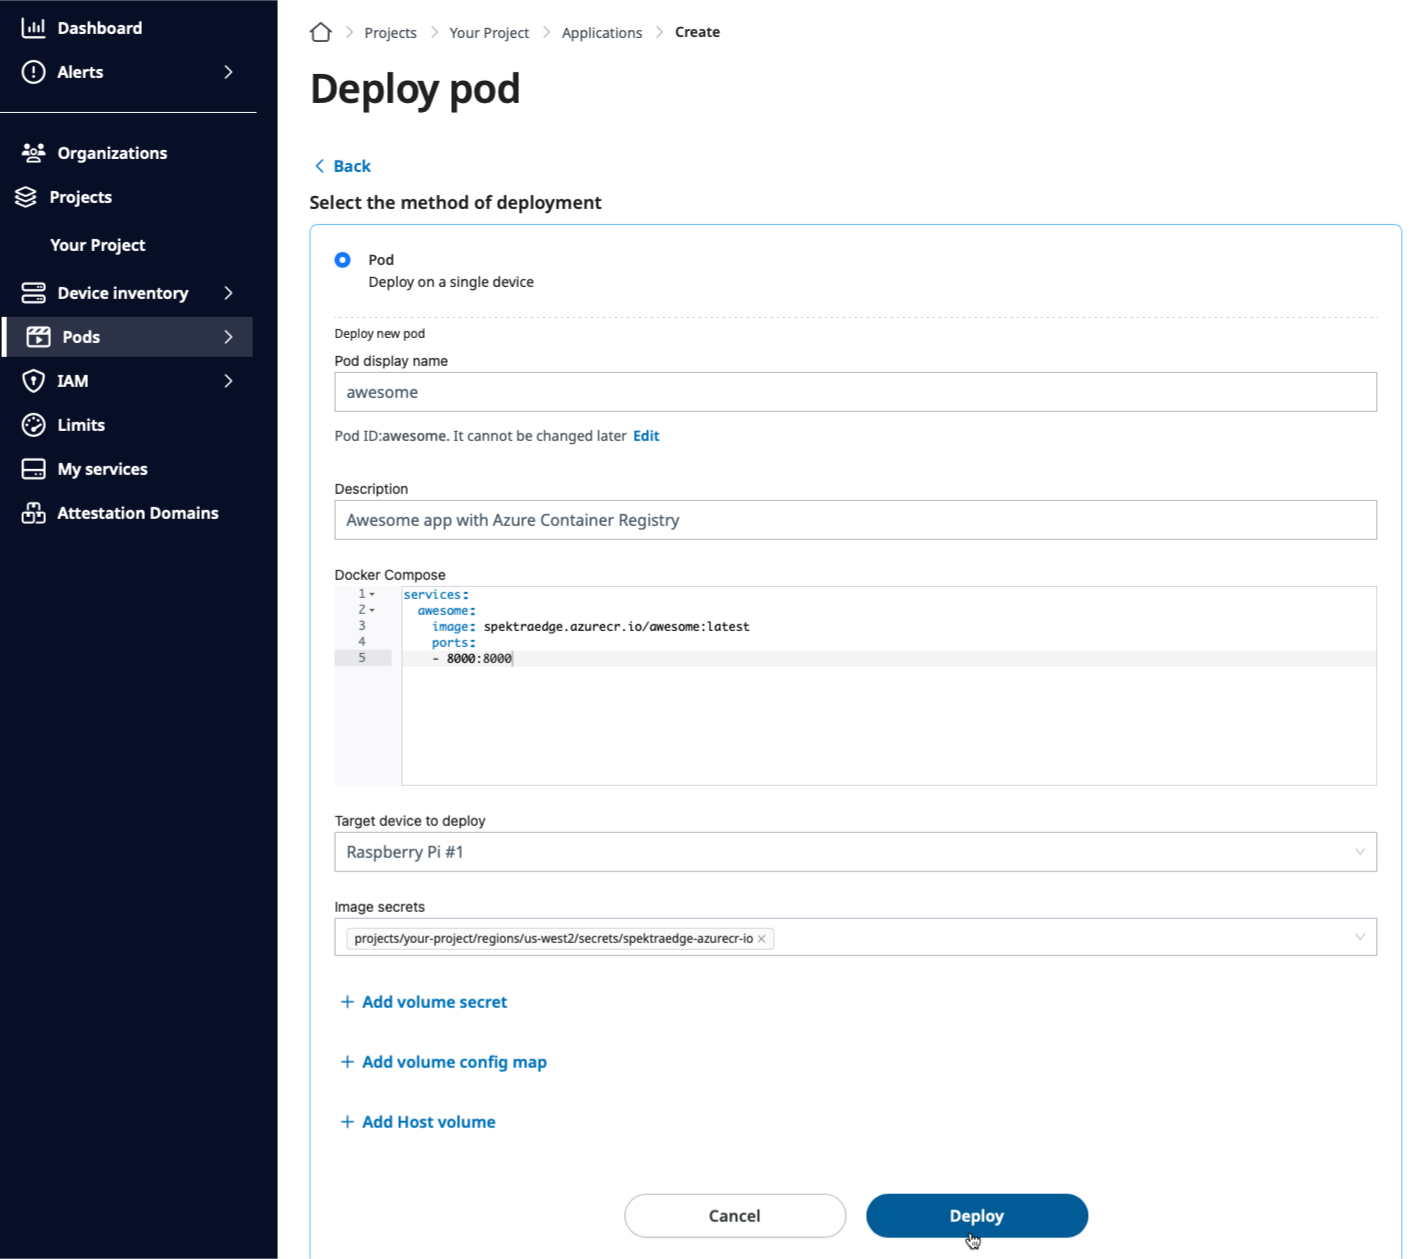
On the Deploy pod page, select the image secret you created in the previous
step and just click Deploy as usual.
Click Deploy button to deploy the application with the image secrets set.
Next steps
Congratulations on mastering the deployment with the private container registry
on SPEKTRA Edge!
As a next step, let’s learn how to monitor and control
applications on SPEKTRA Edge.
3 -
Deploy on multiple devices
Let’s learn how to deploy the application on multiple devices on SPEKTRA Edge.
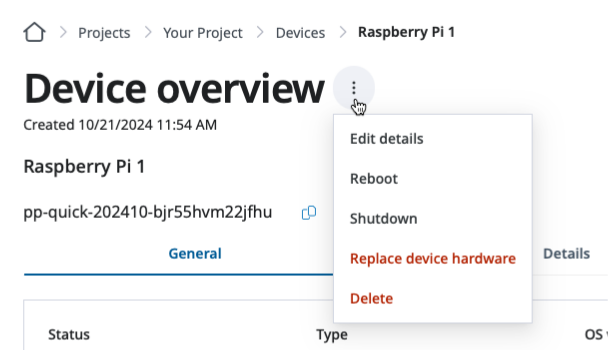
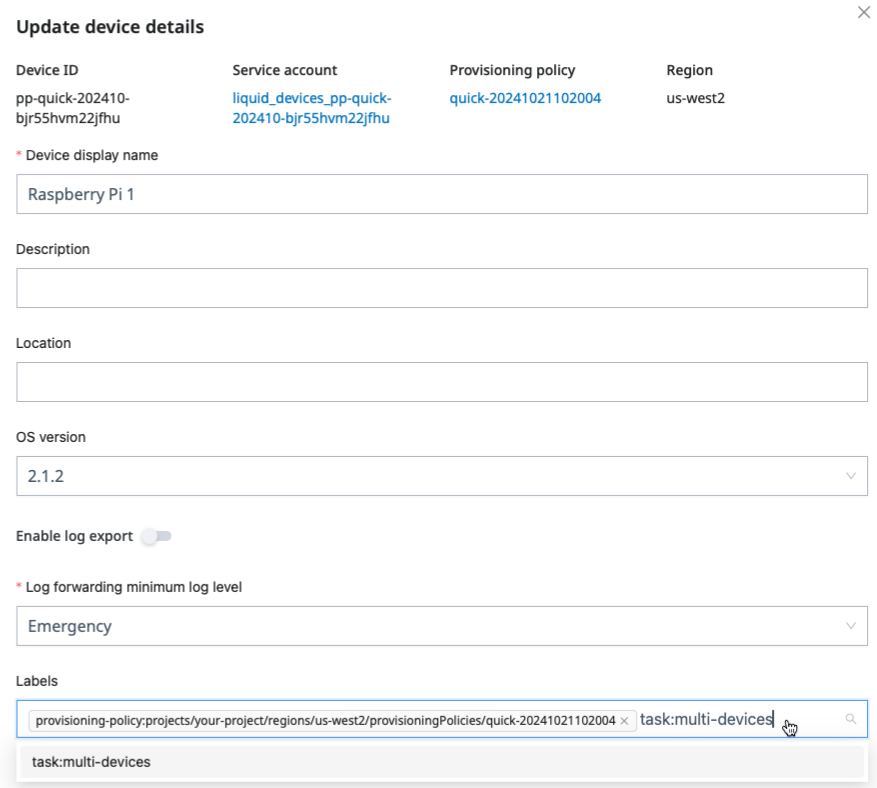
Please do the same for other devices as well before moving on to the deployment
step next.
Deploy with pod templates
Once you set the device labels on your taget devices, now is the time to deploy
applications on all those devices in one-shot with a pod template.
The pod template is a template to apply application deployment against multiple
devices, similar to the template field of the deployments manifest
in Kubernetes.
Let’s create one to see it in action. We’ll use the same application we used
for the single device deployment to demonstrate how easy and similar
deploying applications on multiple devices.
Go to the Project overview page and click Deploy pod button.
Click Deploy pod button on the Project overview page.
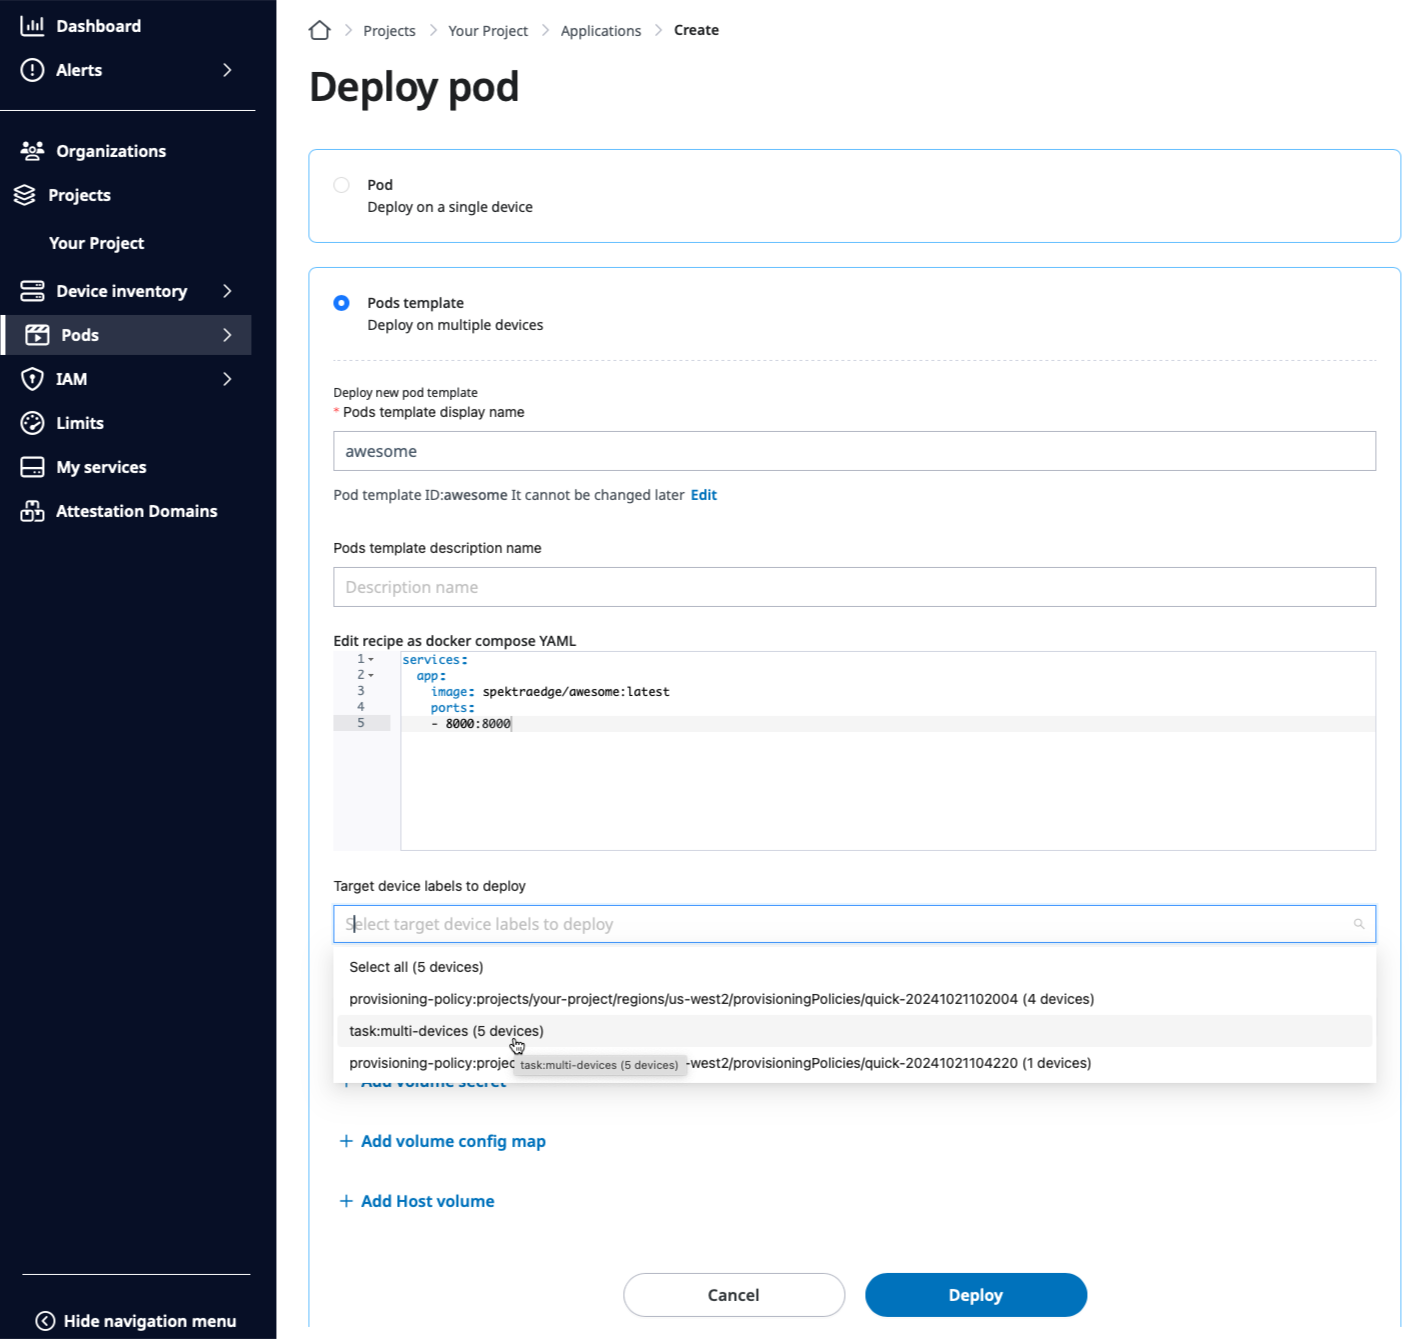
Use the Pod template option in Deploy pod page this time and select
the target devices by providing the device label, task:multi-devices in
this example, in the Target device labels to deploy field, in addition
to the other application information similar to one for the single device
deployment.
Select the target device labels to deploy on Deploy pod page.
Click Deploy to deploy it on multiple devices.
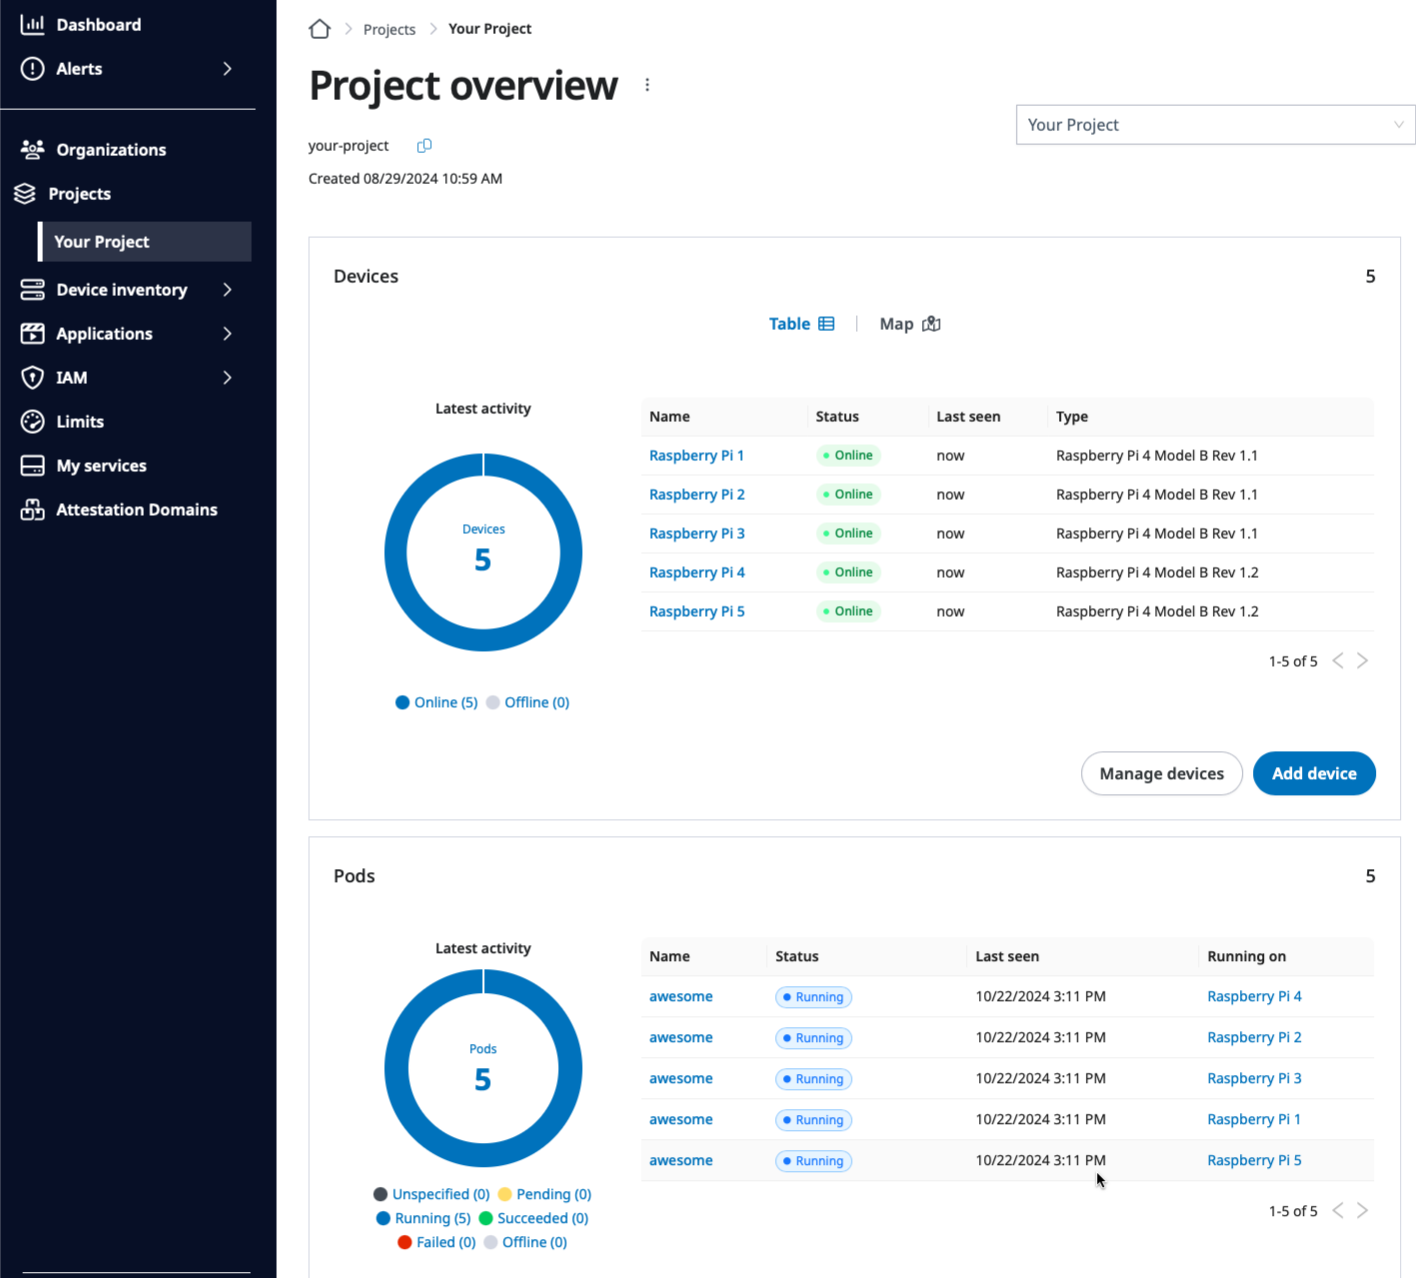
Once it’s done, you should be able to see applications all running
on the target devices, five devices in this example, from the Project overview
page.
awesome application running on all five target devices.
Next step
Congratulations on successfully deploying the application on multiple devices
in a single-shot on SPEKTRA Edge.
Let’s proceed to the monitoring applications section
as the next step to the mastery of SPEKTRA Edge.
4 -
Monitor and control applications
Let’s learn how to monitor and control applications on SPEKTRA Edge.
It also offers the cuttle port forward command, which you can
copy and run on your local machine to access your application through
the SPEKTRA Edge port forwarding capability.
Accessing your application
For all the ways to reach a running application — platform port forwarding,
access from the device’s local network, and container-to-container — see
Access your deployed application.
Copy port forward command option in the Application overview page.
Application statuses
Here is the list of application statuses monitored on SPEKTRA Edge.
Status
Description
Pending
The application is accepted by the system and it’s under processing to be launched. It’s the PENDING state of the Pod.Status.Phase enumeration type.
Running
The application is running, which is that its all containers supposed to be running are up and running. It’s the RUNNING state of the Pod.Status.Phase enumeration type.
Succeeded
The application is terminated with the success exit code. It’s the SUCCEEDED state of the Pod.Status.Phase enumeration type.
Failed
The application encountered an issue and some or all of the containers are not running. This phase happens after the containers are initially created successfully. It’s the FAILED state of the Pod.Status.Phase enumeration type.
Offline
The application does not respond anymore. This phase happens after the containers were initially created successfully. It’s the UNKNOWN state of the Pod.Status.Phase enumeration type.
Image download failed
The application failed to download the container image. It’s the IMAGE_DOWNLOAD_FAILED state of the Pod.Status.Phase enumeration type.
Initialization failed
The application failed to initialize or the validation of the application definition had some errors, typically caused by the Docker compose file syntax errors or the system errors on devices such as disk full. It’s the INIT_FAILED state of the Pod.Status.Phase enumeration type.
Pod create failed
The application failed for the creation due to either by the docker runtime error or the keyword errors. It’s the POD_CREATE_FAILED state of the Pod.Status.Phase enumeration type.
Container states
Here is the list of Container’s state, which is the composition of
the application status explained above. The Containers section
of the Application overview page shows the container states.
State
Description
Waiting
The container is waiting to start. It’s the WAITING state of the Pod.Status.Container.State enumeration type.
The container is terminated. It’s the TERMINATED state of the Pod.Status.Container.State enumeration type.
Application metrics
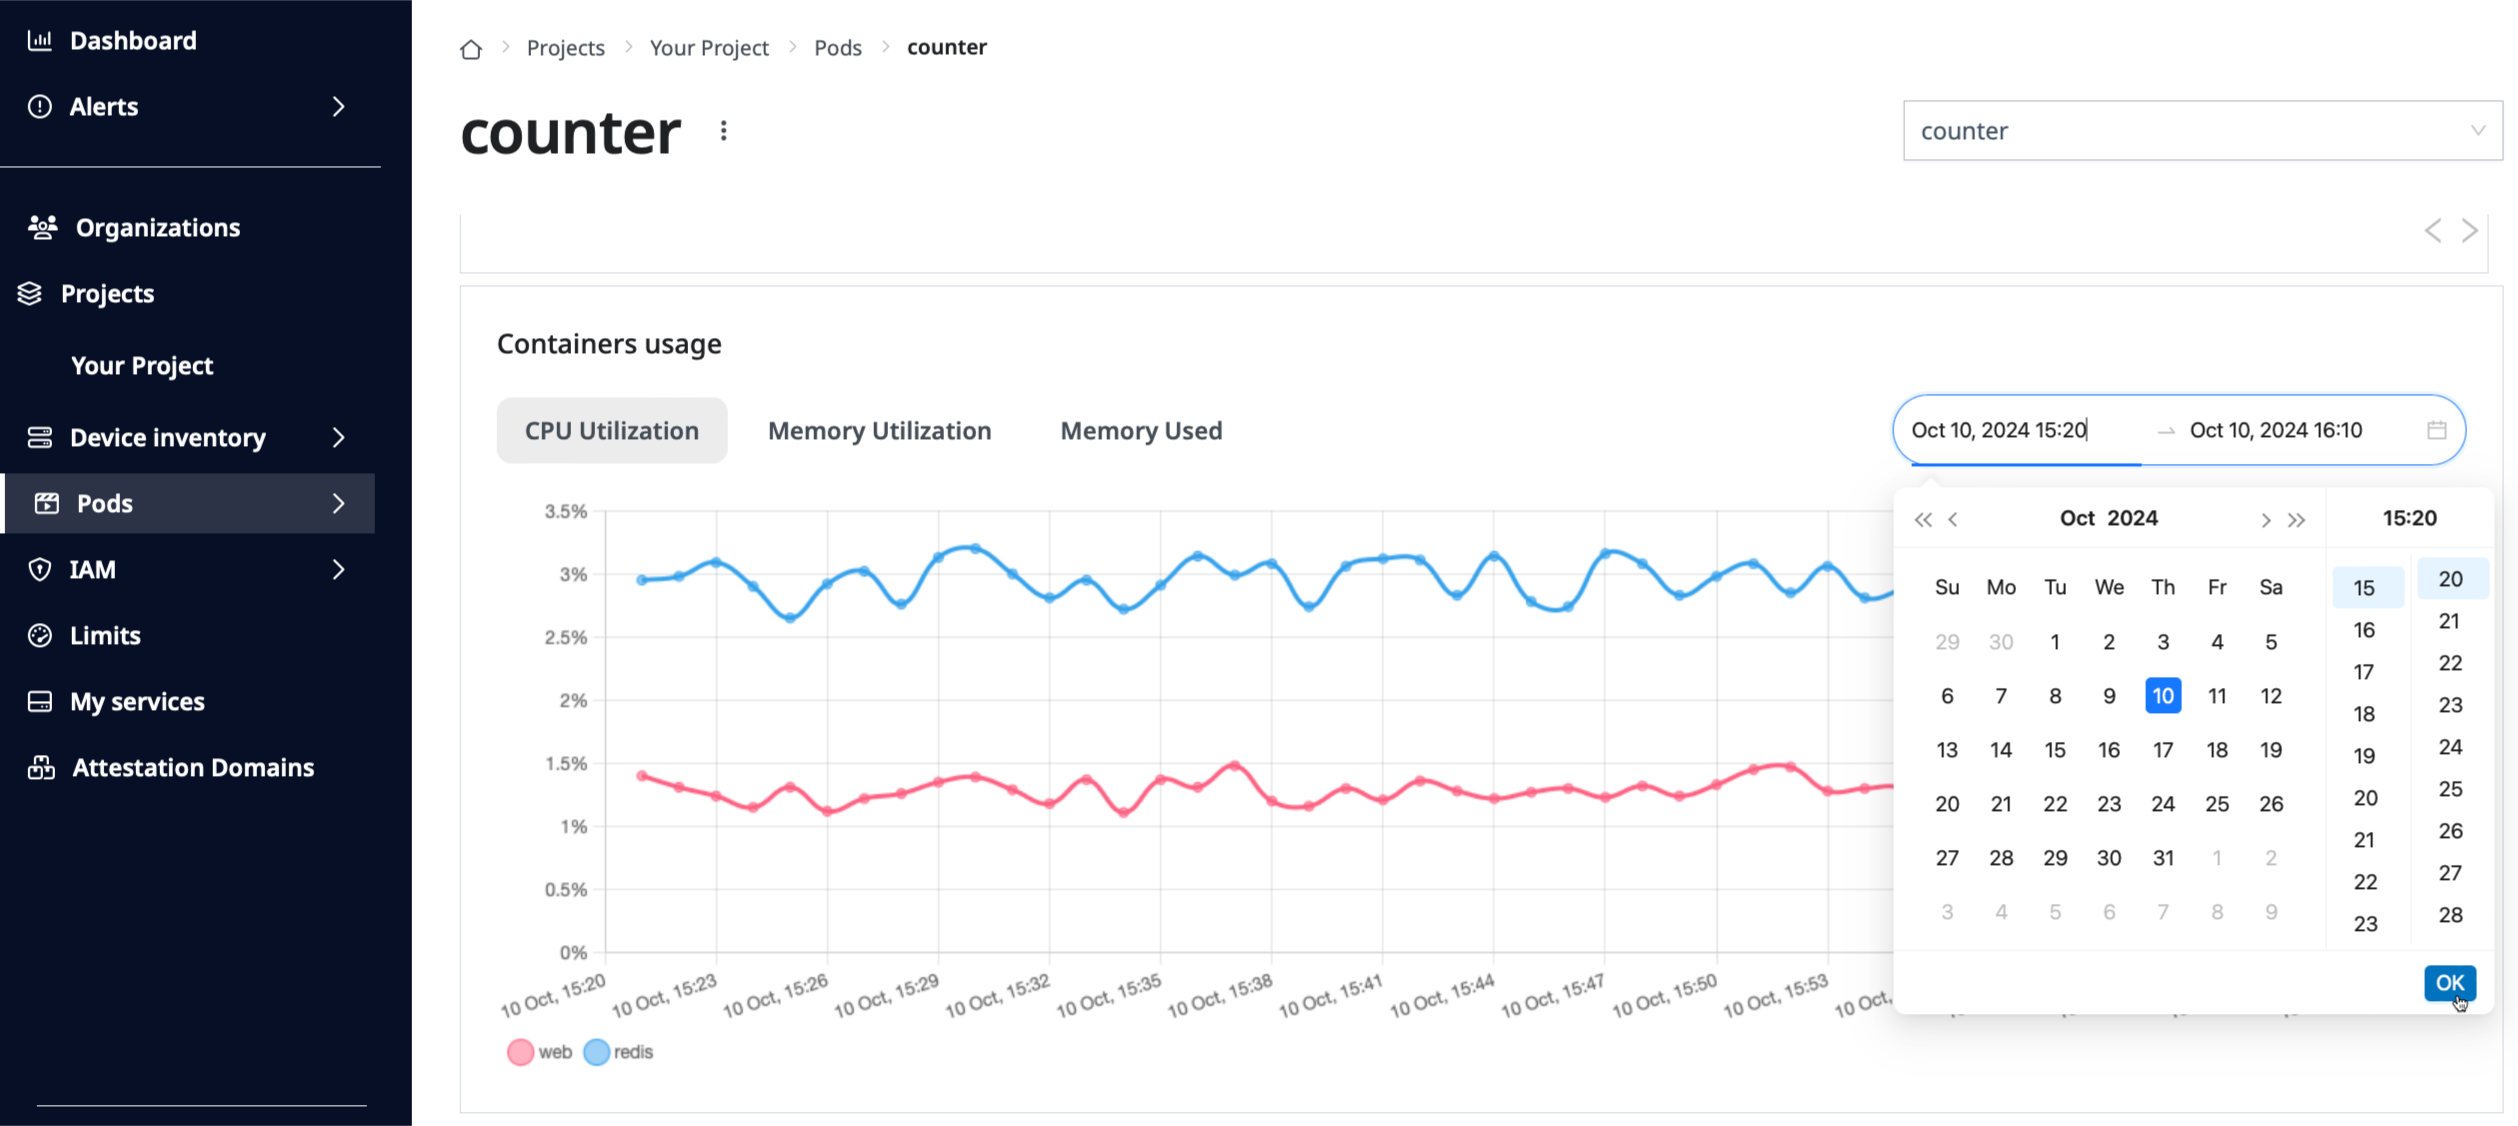
You can monitor the container’s resource usage on the dashboard.
Go to the Containers usage section of the Application overview page
and select the type of resource you want to monitor. Click the right side
of the time range section to specify the duration of the time-series to be
shown on the graph.
Specifying the duration of the time to show the application CPU usage.
Application logs
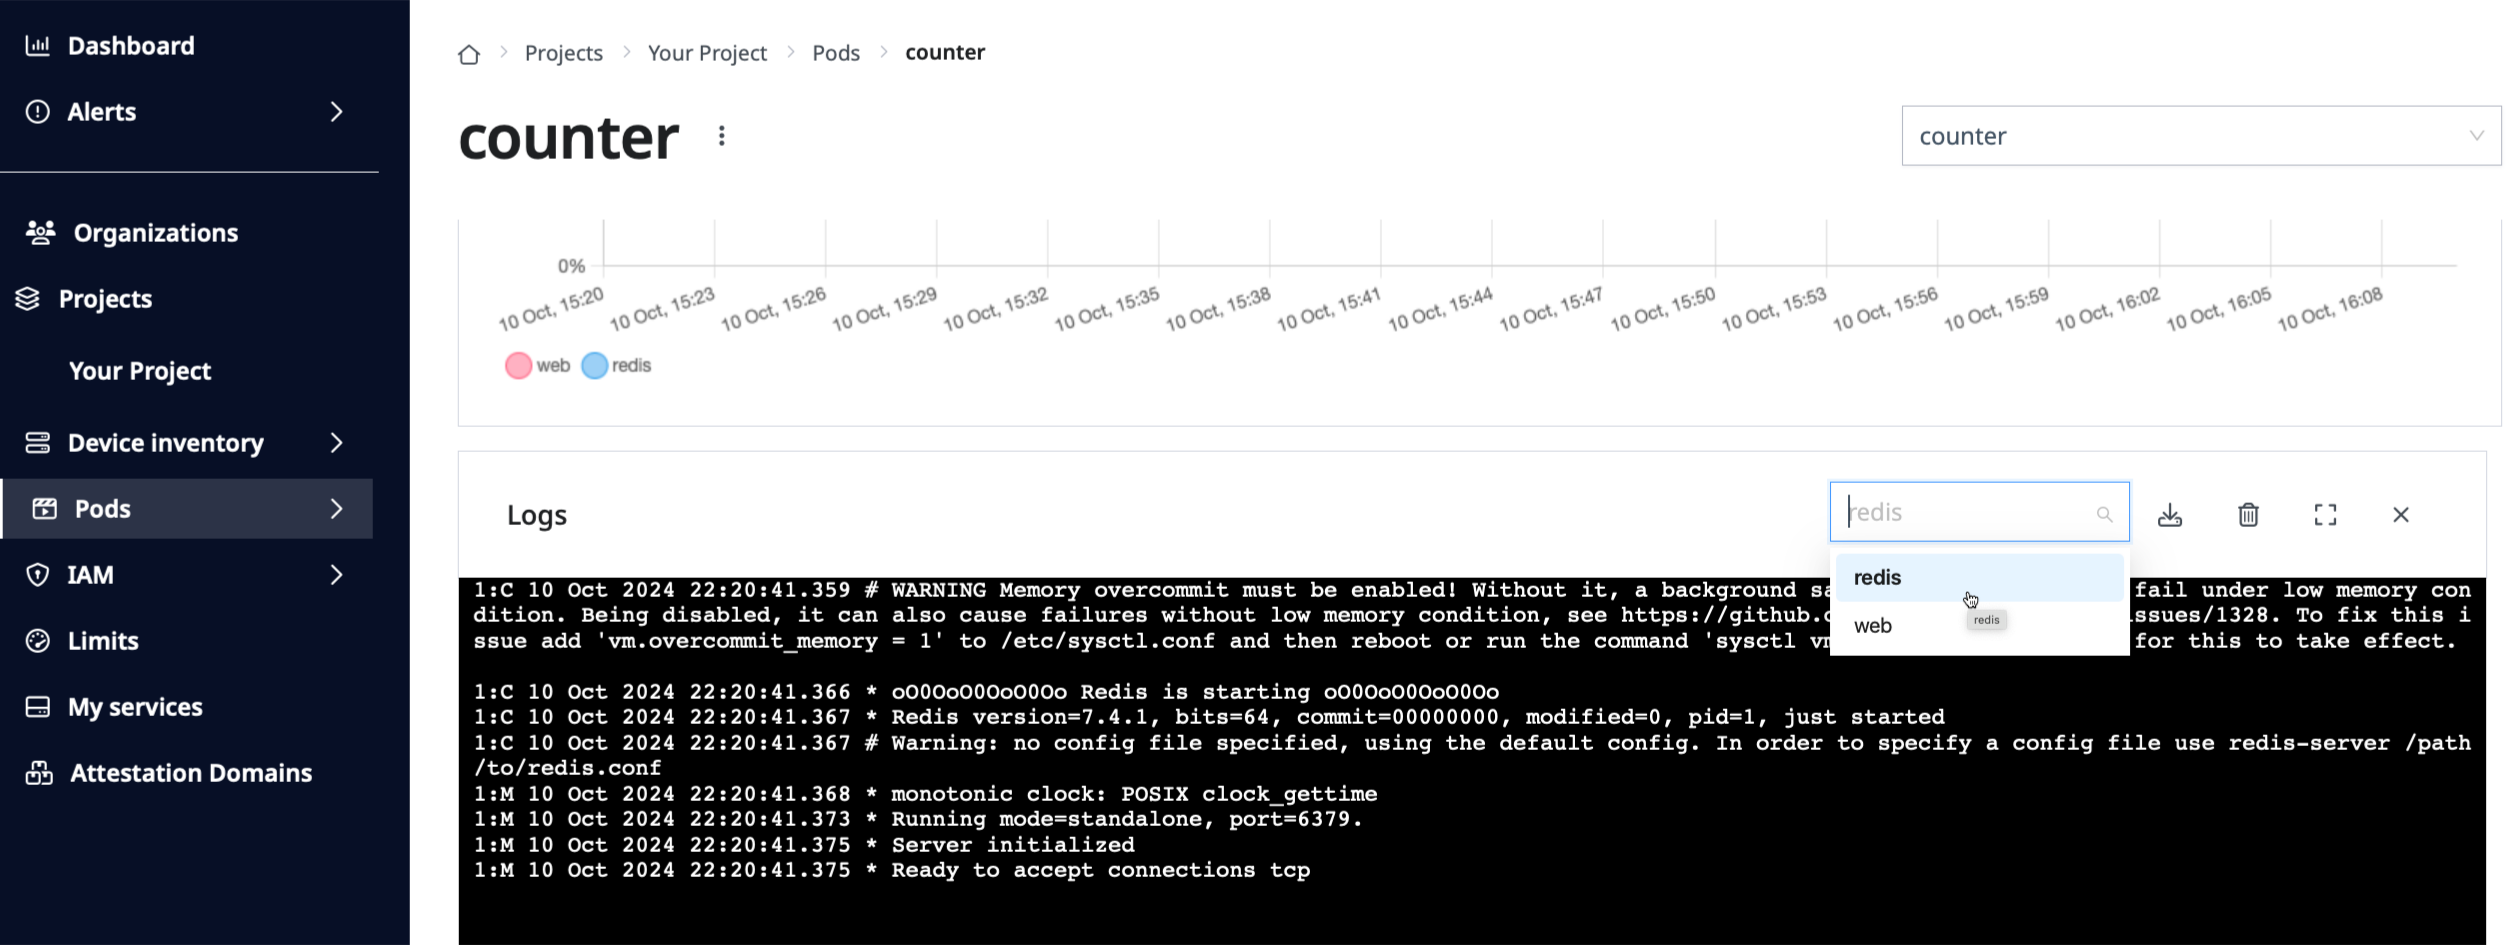
You can retrieve each container’s logs on the dashboard.
Specify the name of the container you want to show the logs by clicking the
pull down menu of the Logs section on the Application overview page.
Click Start to retrieve the live logs of the container.
You can also download the logs by clicking the Download icon on the
Logs menu bar.
Observing the redis container’s logs.
Control applications
You can control applications from the dashboard.
Here is the list of operations you can perform:
delete
restart
Click the the vertical three-dots right next to the application’s name
in the Application overview page to show the pull-down menu and select
the operation you want to perform.
Restarting the application by clicking the Restart option of the pull-down menu on the Application overview page.
Next step
Congratulations!
With the understanding of the application management on SPEKTRA Edge,
we hope you gained the fundamental concept of the application life cycle
happens on the SPEKTRA Edge platform.
Please go ahaed next to the device management section as part
of the SPEKTRA Edge mastery.
5 -
Access your deployed application
Let’s learn the ways to reach an application running on your device with
SPEKTRA Edge.
Once you deploy an application, its containers run on the device and
publish ports according to your Docker compose file. How you reach those ports
depends on where you are relative to the device. This page covers the three
common cases:
The left side (8000) is the device host port; the right side (8000) is
the container port.
From your workstation (port forwarding)
This is the recommended way to reach an application on a remote device. It
works from anywhere, over the device’s existing outbound connection to the
platform, so no inbound ports need to be open on the device or its network.
You need the cuttle CLI installed for this method.
Open the application’s Application overview page in the dashboard (see
Monitor & control).
Click Copy port forward as Cuttle command to copy a ready-made command.
This forwards the device’s port 8000 to 127.0.0.1:8000 on your machine.
Point your browser at http://localhost:8000
and you’ll reach the application as if it were running locally.
The first argument is the full device name (it includes the project and region);
the dashboard fills this in for you when you copy the command.
Why use port forwarding?
It works wherever you are, not just on the device’s network.
It is tunneled through the platform’s authenticated connection, so you don’t
expose the application to the public internet or open firewall ports.
It’s ideal for administration, debugging, and one-off access.
From the device’s local network
If your client (a browser, another machine, a PLC, etc.) is on the same local
network as the device, you can reach a published port directly using the
device’s IP address:
http://<device-ip>:<published-port>
For the Nginx example above, that would be http://<device-ip>:8000.
This is the natural choice when the application is meant to serve other equipment
on-site — for example, a local dashboard, an API consumed by nearby machines, or
a gateway service.
A few things to keep in mind:
The port must be published in the compose file (the ports entry). A
container port that isn’t published is only reachable from inside the device.
By default a published port is reachable on all of the device’s network
interfaces. If you only want it on a specific interface, bind it explicitly
in the compose file, for example 127.0.0.1:8000:8000 to keep it on the
device itself.
Make sure the chosen host port doesn’t collide with another application or a
system service on the device.
From another container
Containers within the same application can talk to each other over the
application’s internal network using their service name as the hostname —
they don’t need to publish ports for this. For example, an app service can
reach a redis service at redis:6379.
Only publish a port (with ports) when something outside the application
needs to reach the container. Internal service-to-service traffic should stay
on the internal network.
Persisting data behind your application
If your application stores data (uploads, a database, configuration), mount it
under the device’s persistent data area so it survives restarts and power
cycles: