The Device overview page
Device overview is the dashboard page you will spend the most time on. For a single device it shows status, hardware details, resource metrics, and live logs, and it is where you reboot the device or open a terminal on it.
This page is a tour of that screen. For the fleet-wide view — alerting across many devices — see Alerts.
What you need
To go through this page, you need the following.
- access to the SPEKTRA Edge dashboard
- an active project
- a device provisioned under the project
- the cuttle CLI command configured on your machine
The getting started guide will help you to set those requirements up. Please go through the guide in case you miss some of those.
Device overview
Device overview page is the main dashboard to manage devices on SPEKTRA Edge.
To get there from Project overview page, click the Manage devices button located in the Devices section of the Project overview page.
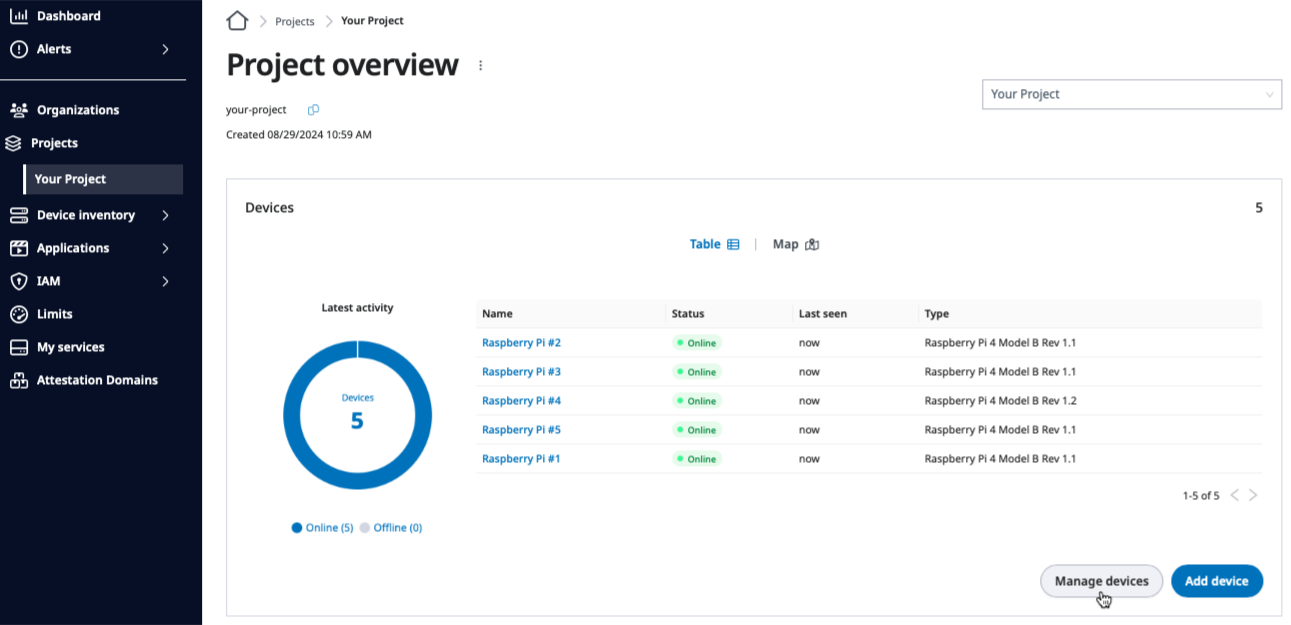
Manage devices button on the Project overview page.
Click the name of the device you want to manage to open its Device overview page.
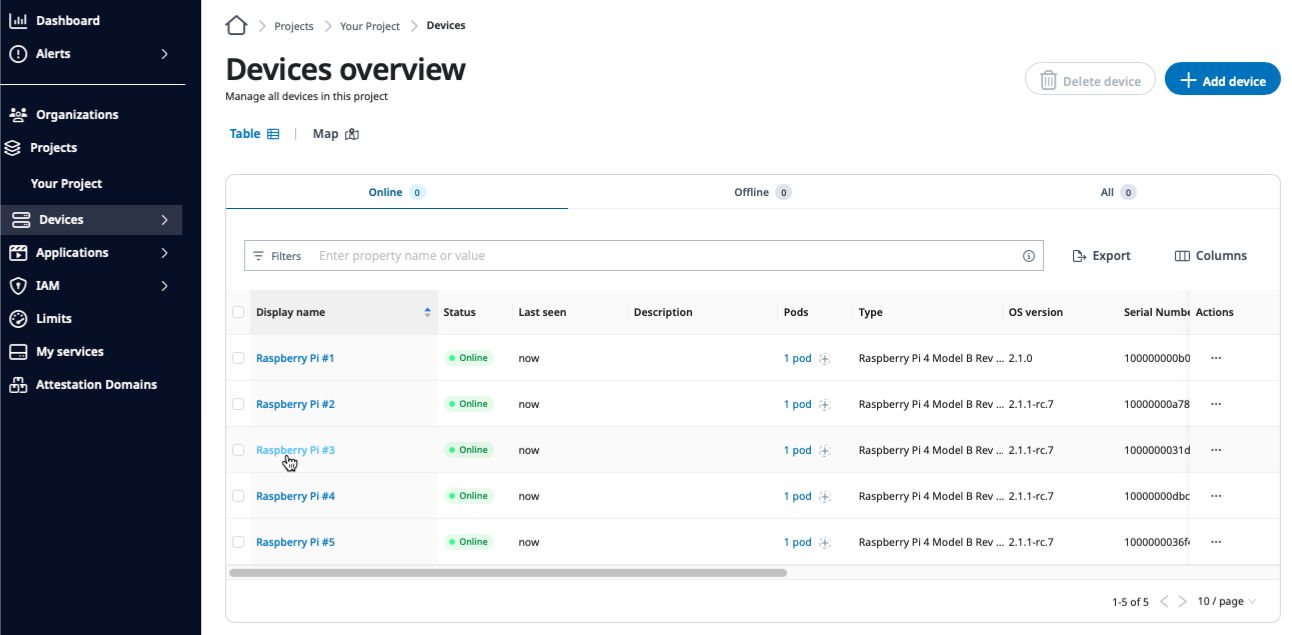
Clicking the device name to go to the Devices overview page.
Here on the Device overview page, you can do the majority of the tasks to manage devices, such as:
- observing the device’s status and device information, such as IP addresses, etc.
- getting the list of applications running on the device
- monitoring the device’s resource usage, such as CPU, memory, storage usage, as well as the device temperature.
- examining the device’s logs
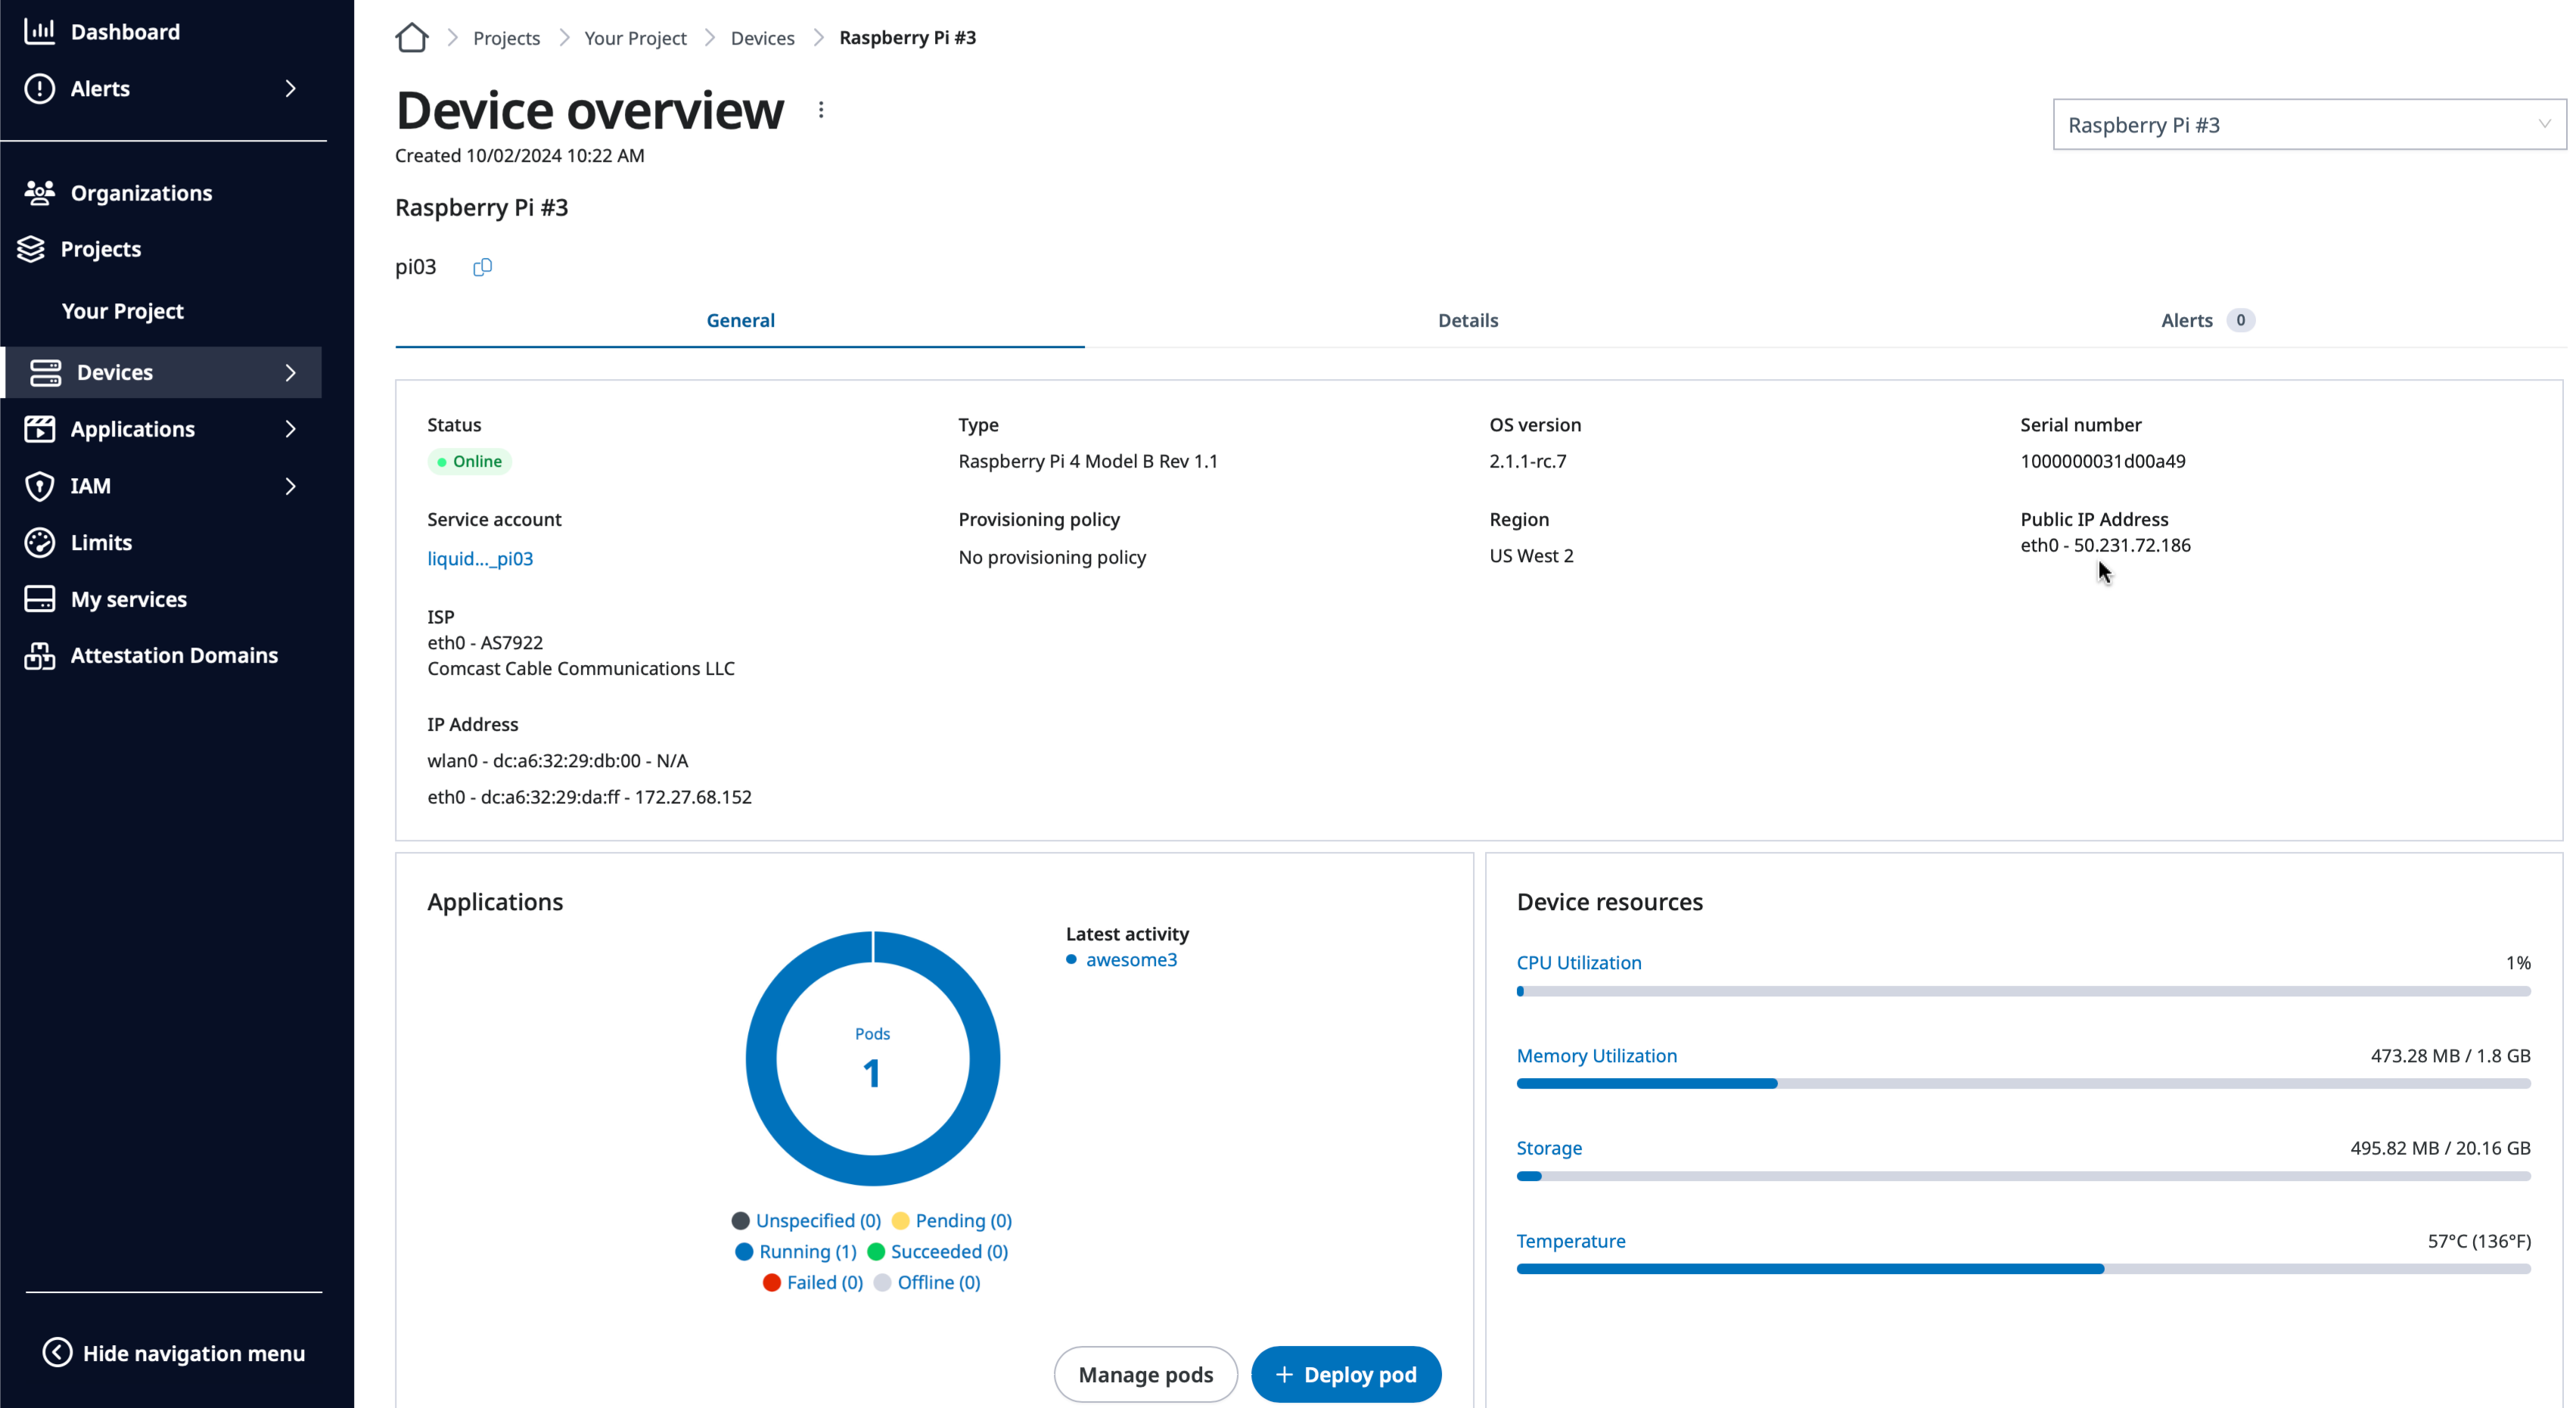
Public IP address of the device in the Device overview page.
Click Details tab of the Device overview page to show the detailed information about the device, such as:
- GPU type
- BIOS name
- Hard disk types and sizes
- MAC address of the network interfaces
- Network configuration
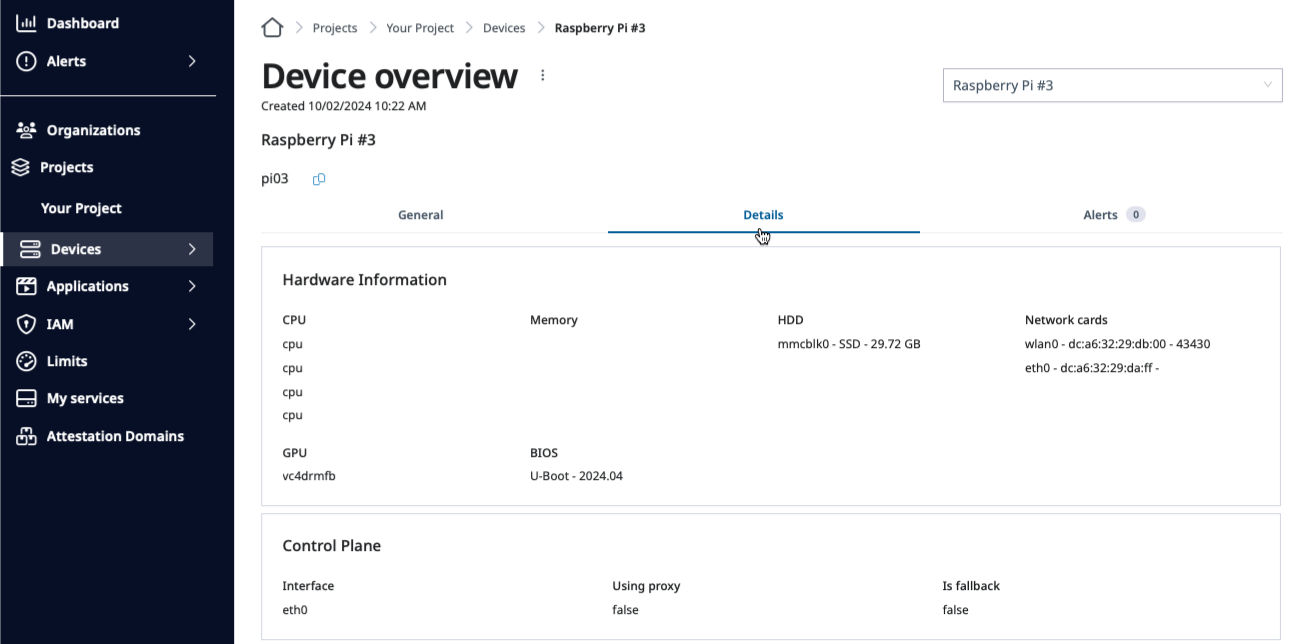
Details tab of the Device overview page to observe the detailed device information.
Device statuses
Here is the list of device statuses monitored on SPEKTRA Edge.
| Status | Description |
|---|---|
| Online | Device is detected as connected by the platform. It’s the CONNECTED state of the Device.Status.ConnectionStatus type. |
| Offline | Device is either not detected, or detected as disconnected, by the platform. It’s the DISCONNECTED state of the Device.Status.ConnectionStatus type. |
Device metrics
You can monitor the device’s resource usage on the dashboard, which includes:
- CPU
- Memory
- Storage
- Temperature
Click the Details tab of the Device overview page and scroll down to the Device metrics section. Select the metric type and the duration of time to show the time series of the resource usage.
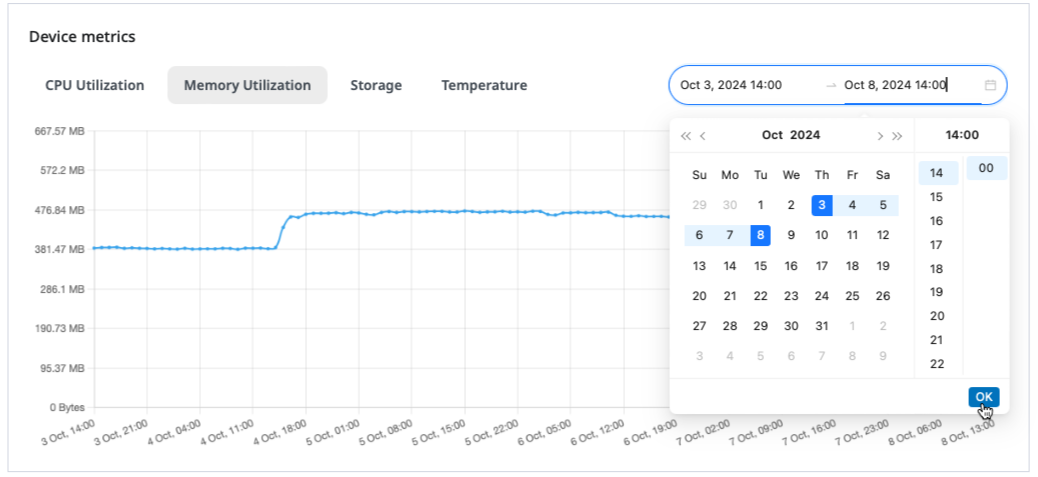
Specifying the duration of time to show the device memory time-series.
Device logs
You can retrieve the device logs from the dashboard.
Please follow the device log forwarding page for the various logging levels supported on SPEKTRA Edge.
Go down to the Logs section of the Device overview page and click the Start button to retrieve the device logs. By default, you are observing the active logs and are kept updated whenever the new log come on the device.
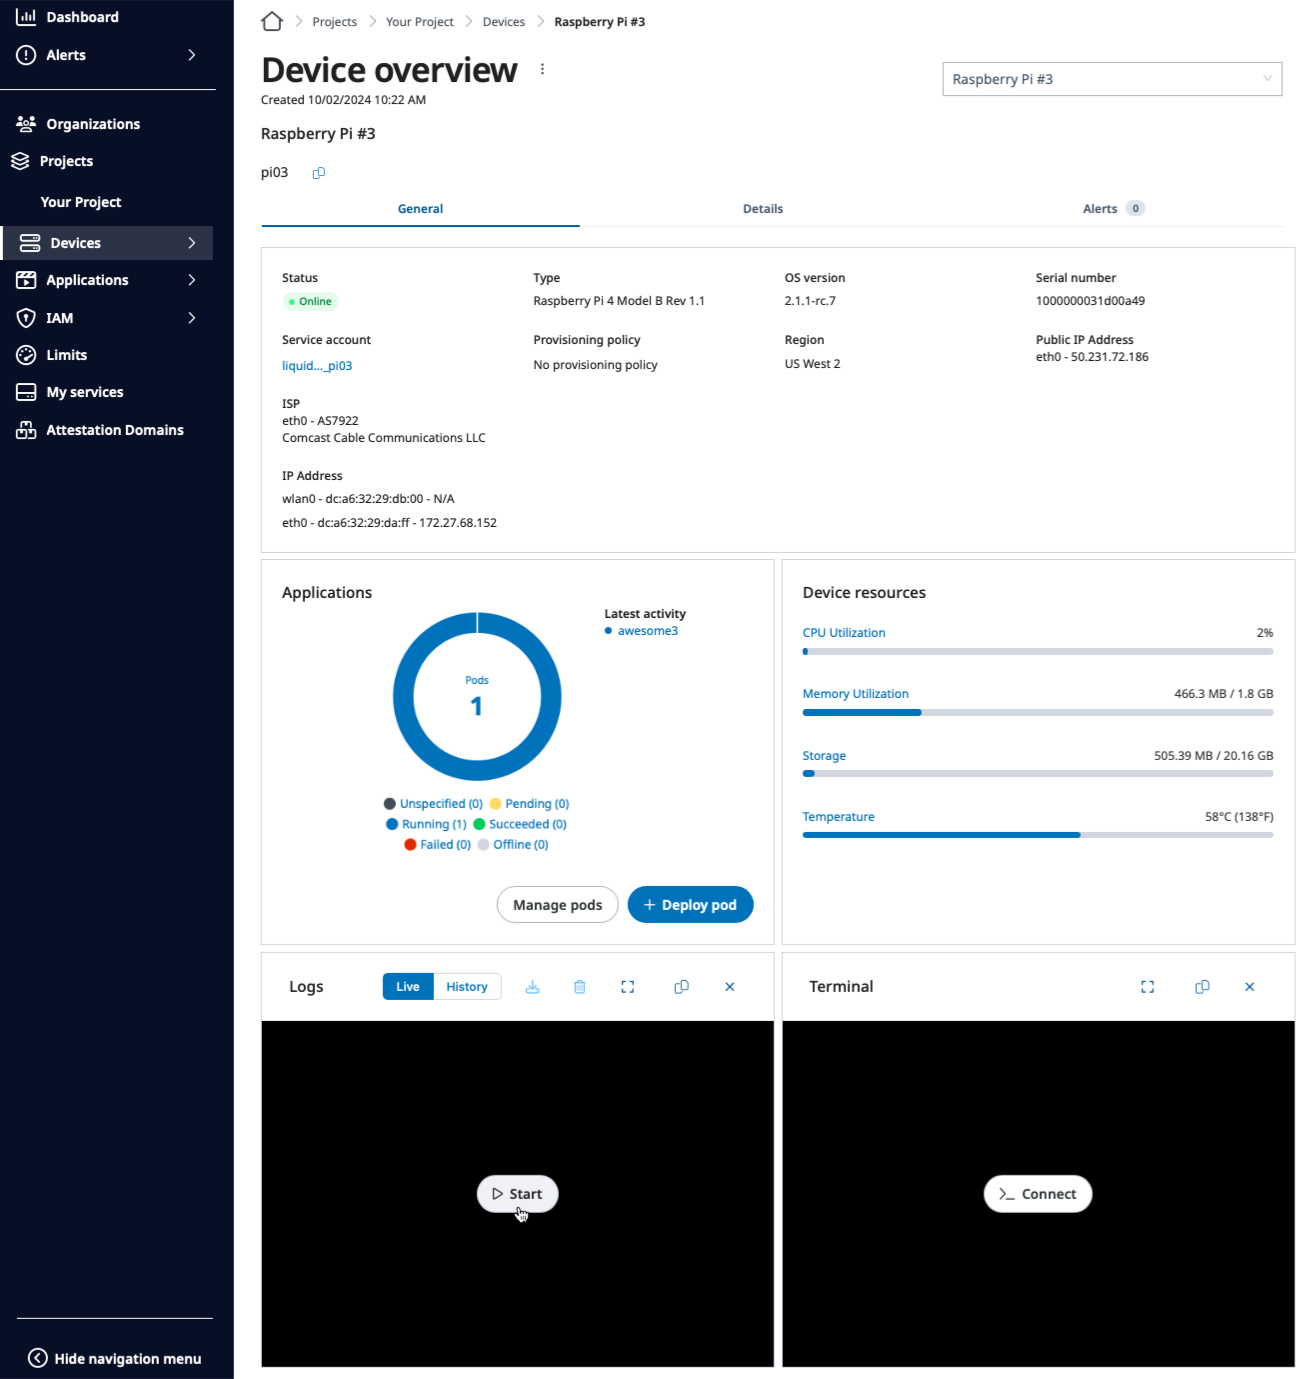
Start button of the Device Logs window of the Device overview page.
To see the logs during the particular period, select the History option from the Device Logs menu and give the time range you’re interested in, then hit OK.
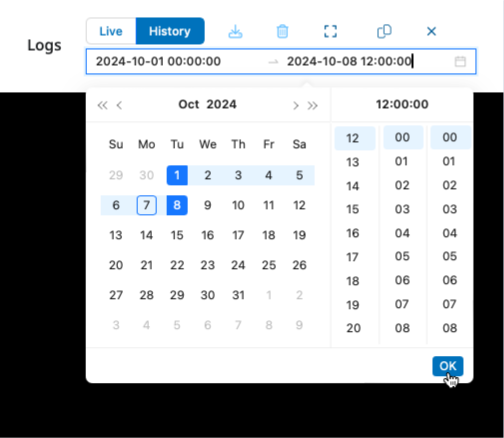
Select time range of the device logs.
You can also download the logs for the further investigation by clicking the download icon on the Device Logs menu.
Control devices
You can reboot and shutdown the device from the dashboard.
Click the vertical triple dots right next to the Device overview title to show the pull down menu for the control options.
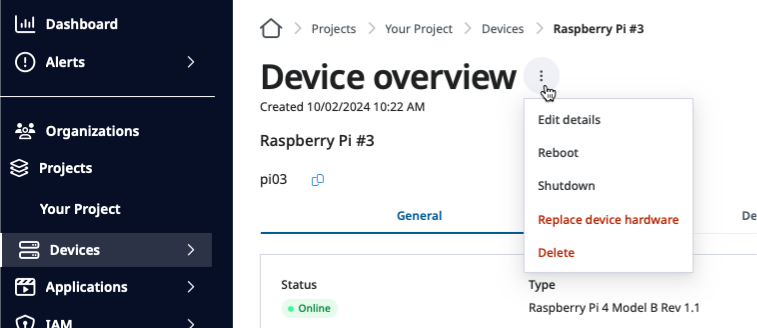
Device control options shown on the Device overview page.
Select Reboot or Shutdown to take the actual action. Both ask you to confirm first — see Reboot, shutdown & recovery for what to expect, including why a shutdown may need someone on site.
The same menu is where you copy files on and off the device, with Upload files and Download file. See Transfer files.
Access devices
You can access the device console over SSH from the dashboard or the local terminal with cuttle command.
Access devices from dashboard
Go to the Terminal window of the Device overview page and click Connect button to access to the device console.
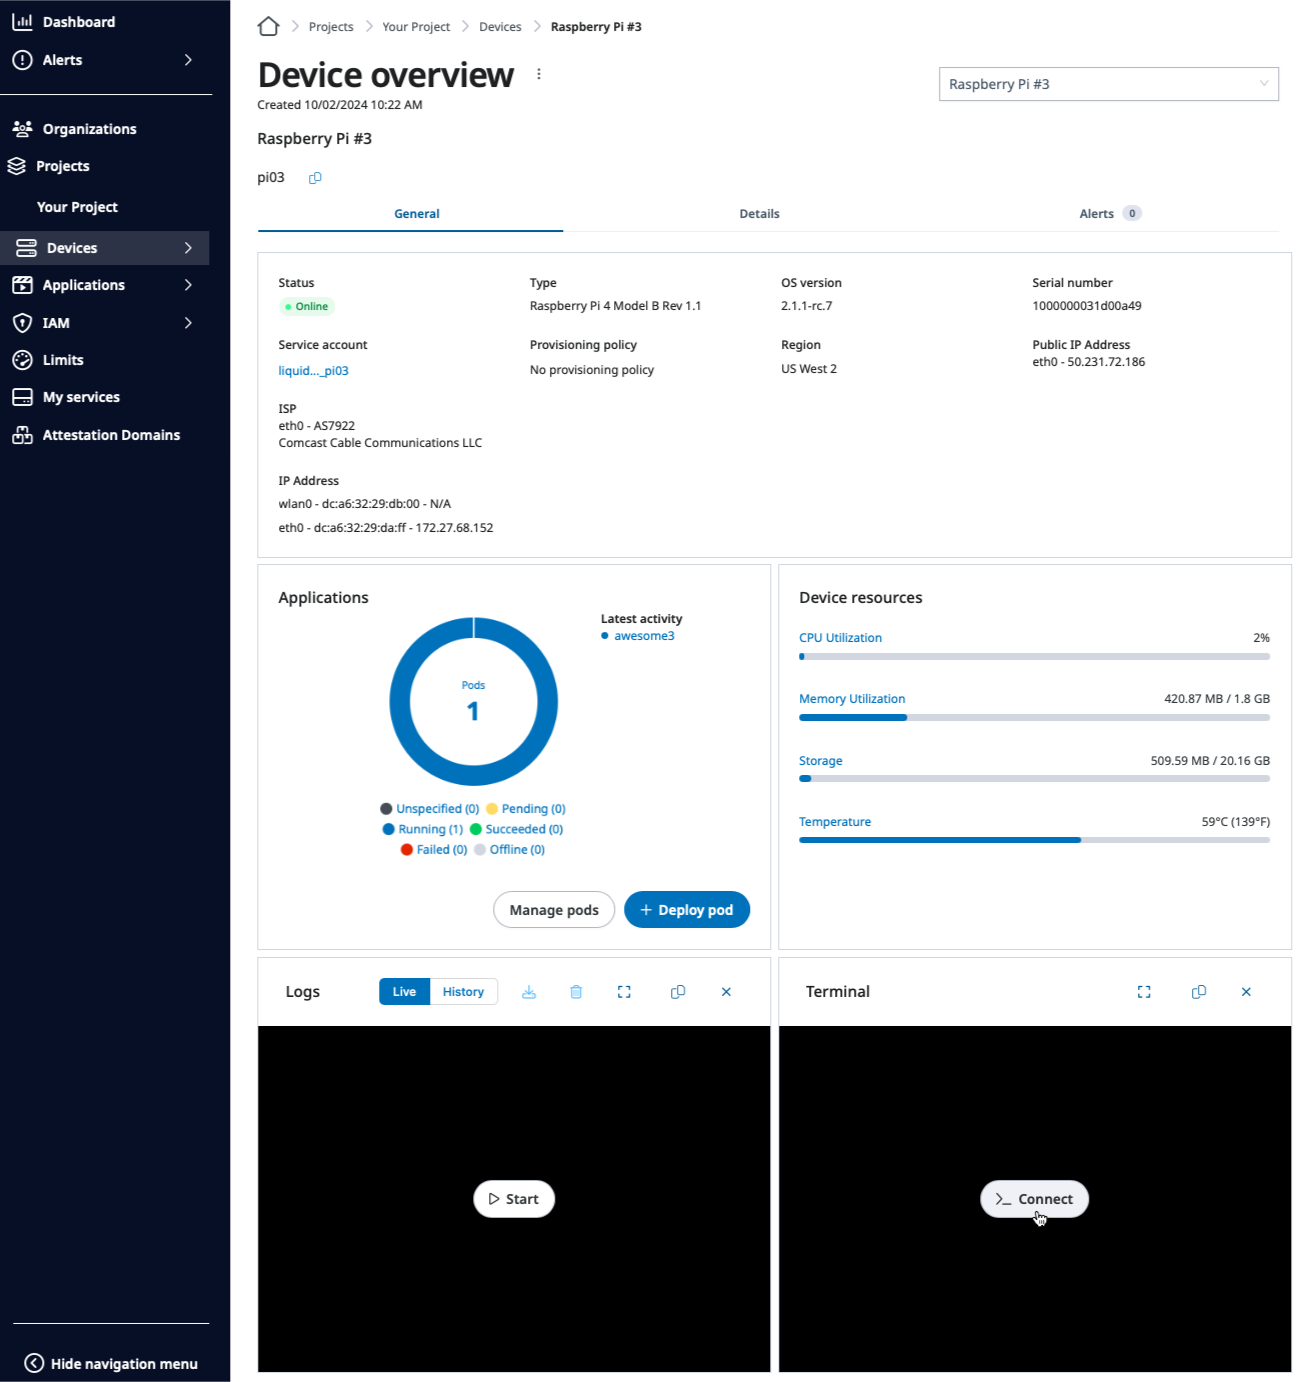
Connect button on the Terminal window of the Device overview page to access the device.
Access devices from your machine
You can access the device console from your local machine.
Click the Copy terminal as Cuttle command button in the Terminal window menu and paste it to the terminal of your local machine.
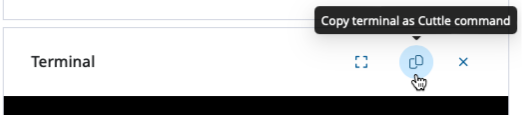
Copy cuttle command for the device terminal access.
cuttle devices ssh projects/your-project/regions/us-west2/devices/pi03
The command you will get is different from the one above, as the different project name, etc.
Next steps
You can now read a single device’s status, metrics, and logs from the dashboard. Next, learn how to control what a device forwards, in Device logs.