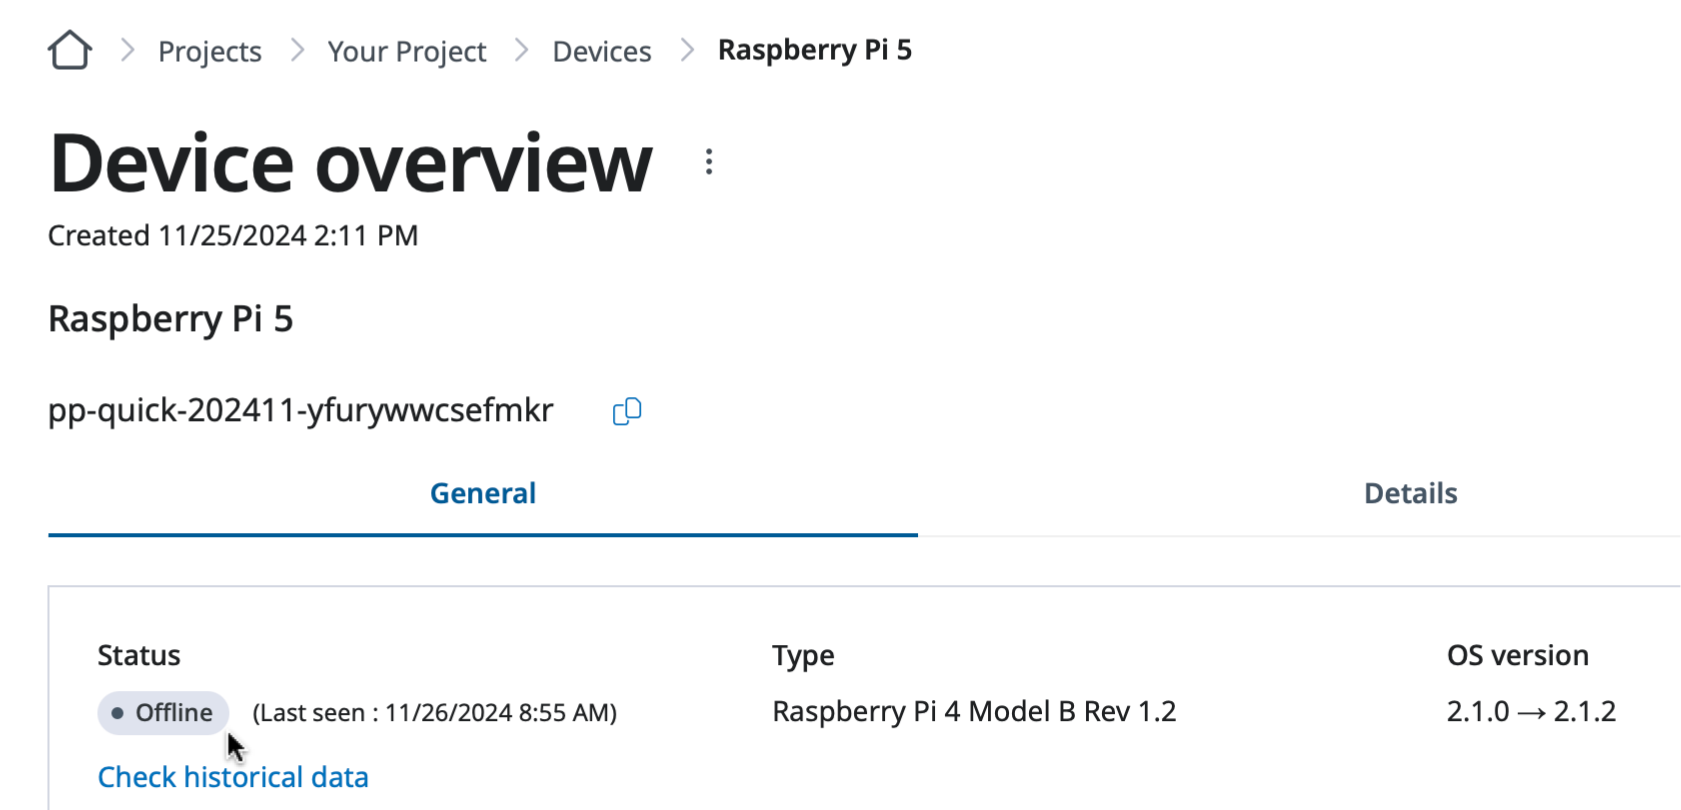
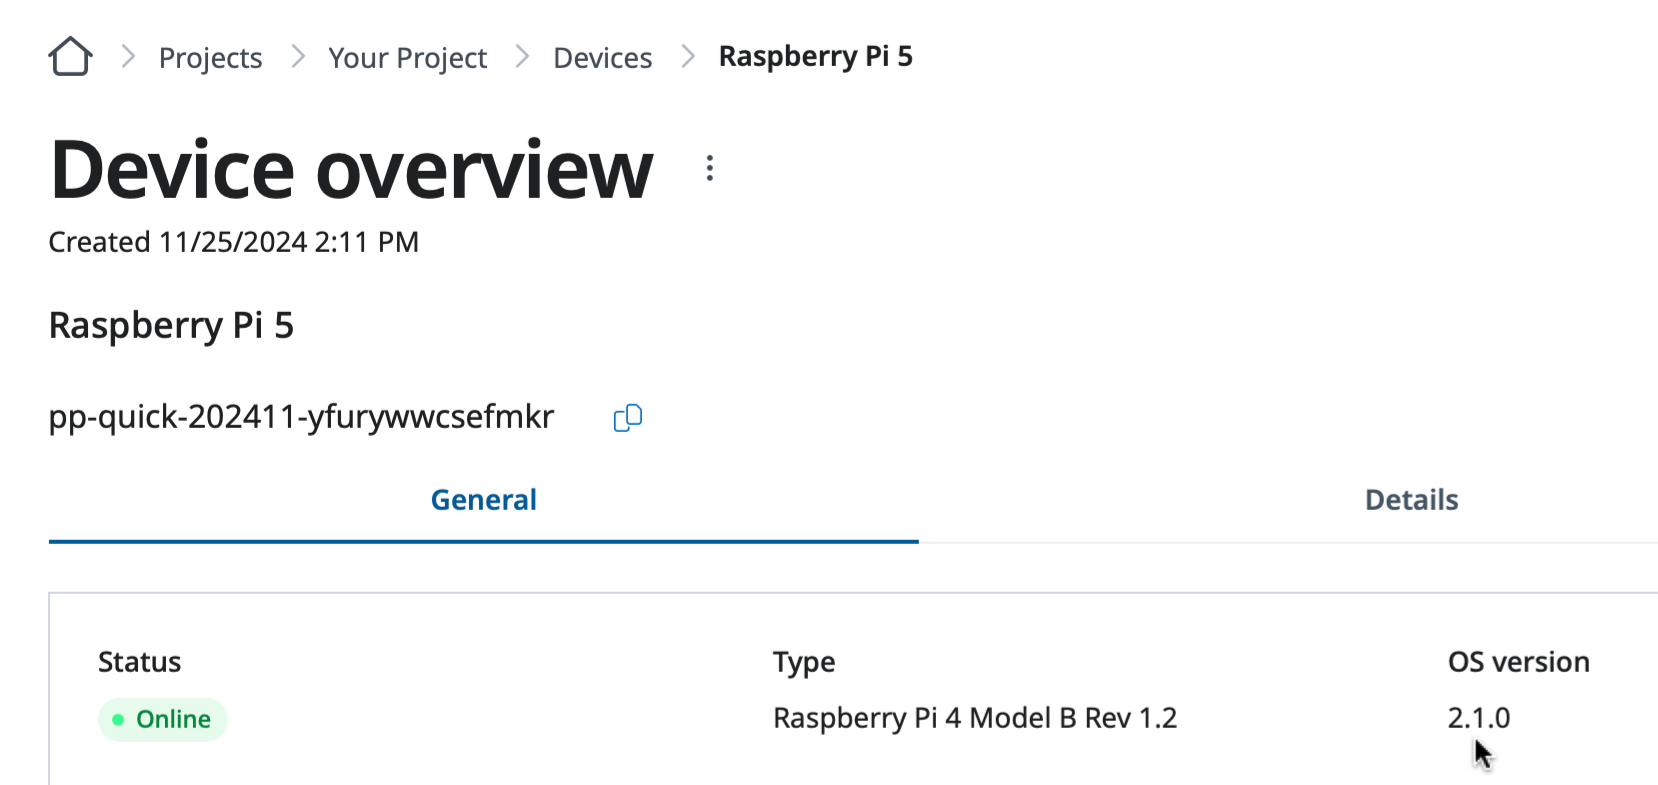
Device is either not detected, or detected as disconnected, by the platform. It’s the DISCONNECTED state of the Device.Status.ConnectionStatus type.
Device metrics
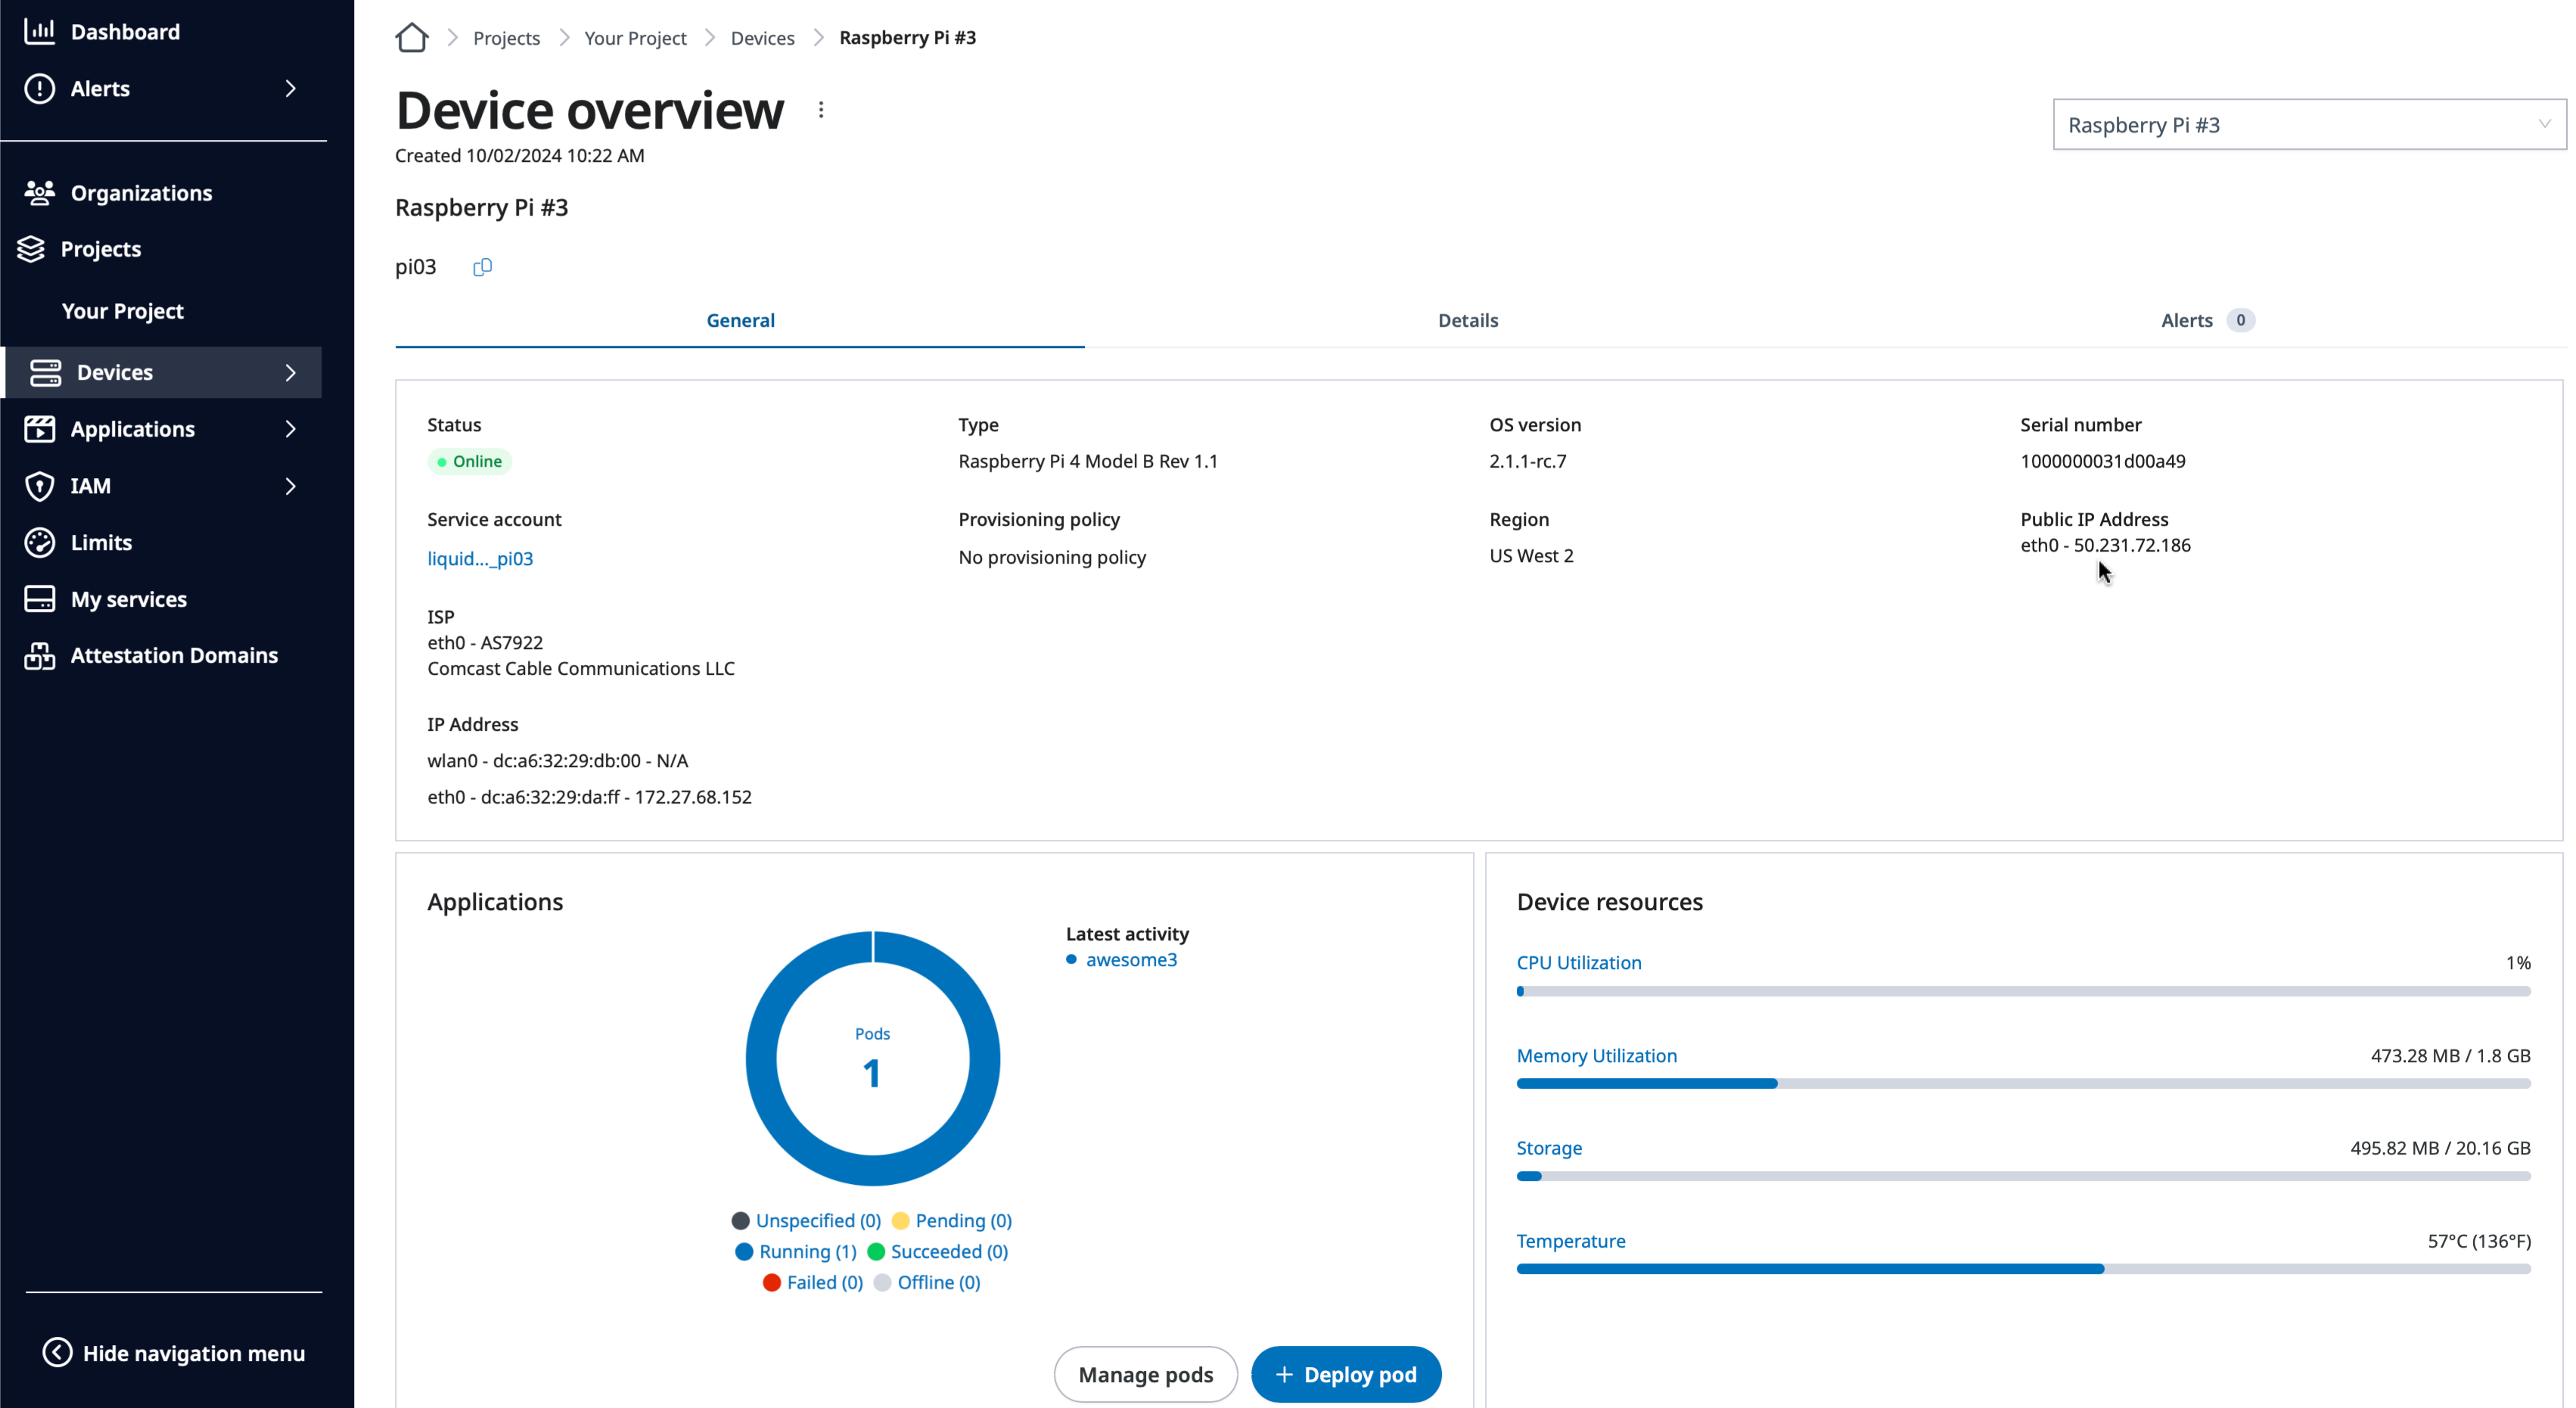
You can monitor the device’s resource usage on the dashboard, which includes:
CPU
Memory
Storage
Temperature
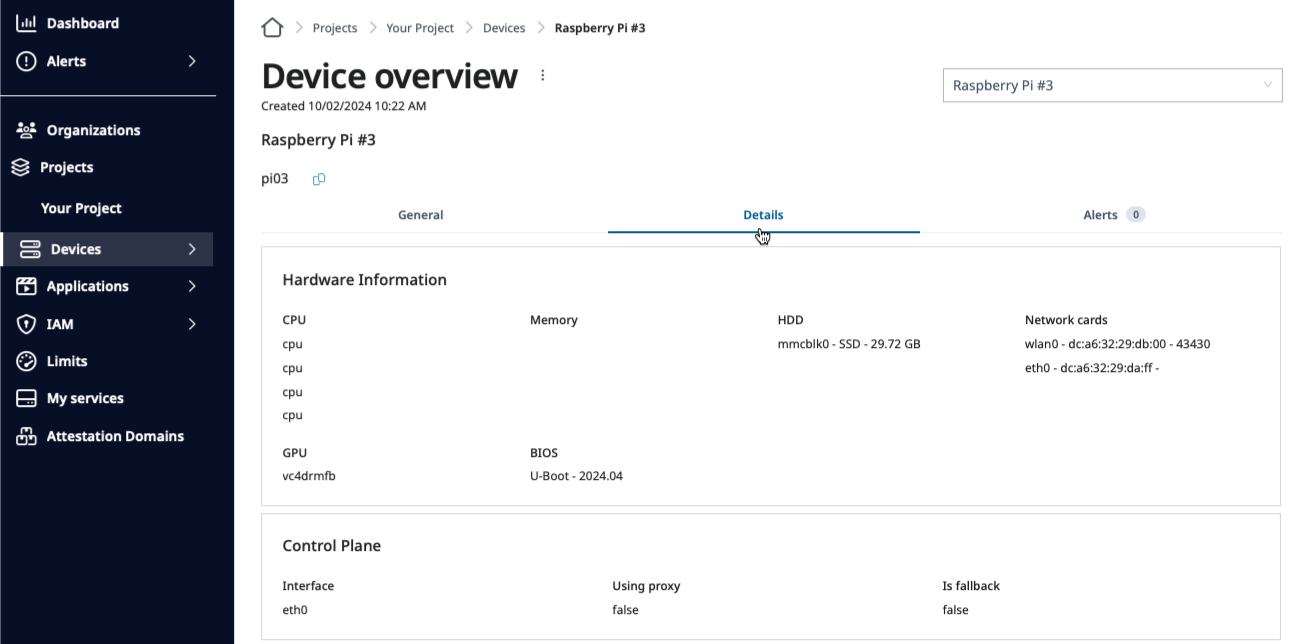
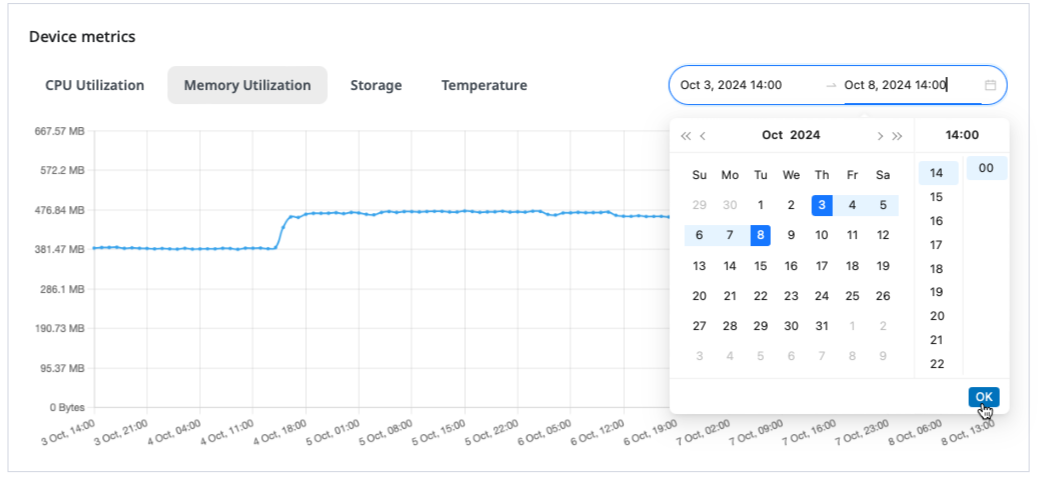
Click the Details tab of the Device overview page and scroll down to
the Device metrics section. Select the metric type and the duration of
time to show the time-seris of the resource usage.
Specifying the duration of time to show the device memory time-series.
Device logs
You can retrieve the device logs from the dashboard.
Device log levels
Please follow the device log forwarding page for the verious logging levels
supported on SPEKTRA Edge.
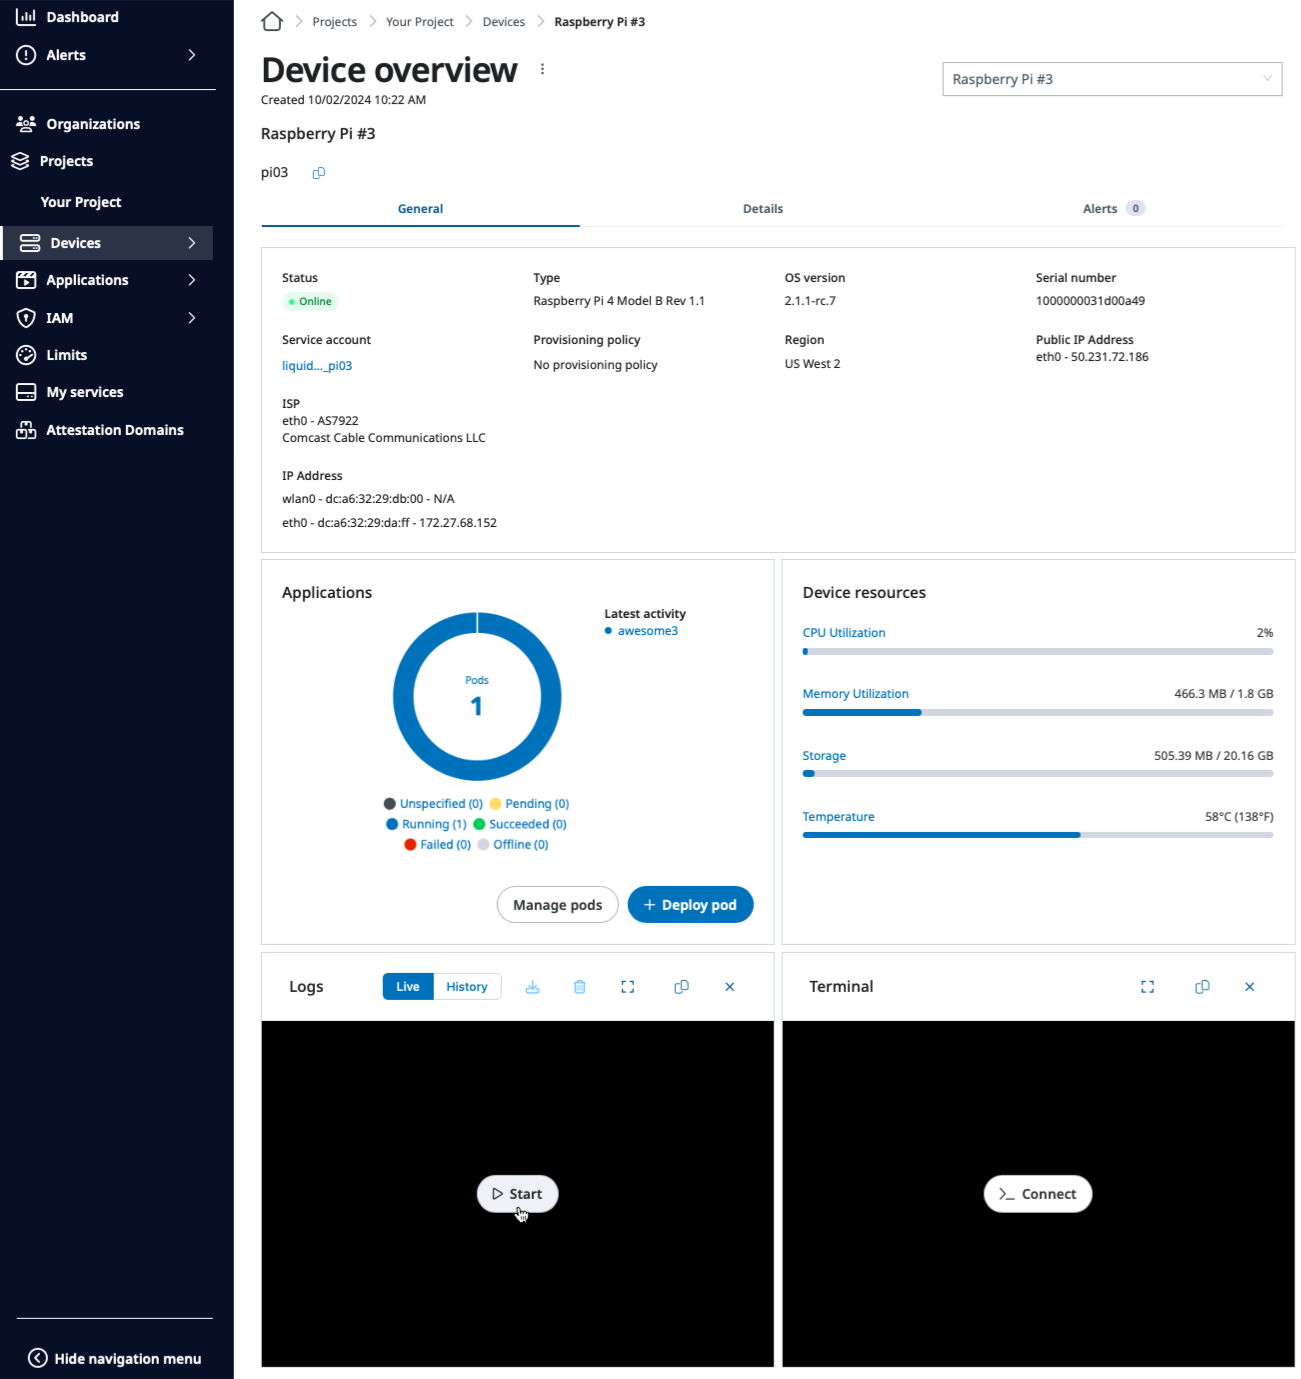
Go down to the Logs section of the Device overview page and click
the Start button to retrieve the device logs. By default, you are
observing the active logs and are kept updated whenever the new log come
on the device.
Start button of the Device Logs window of the Device overview page.
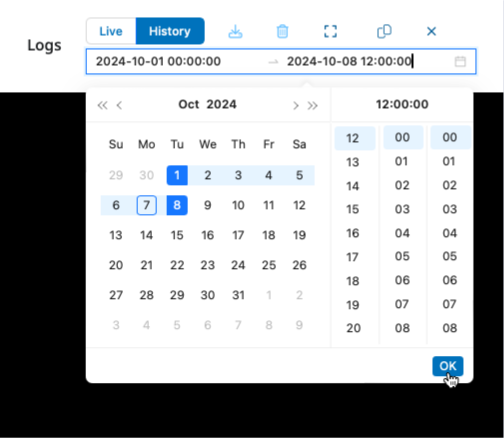
To see the logs during the particular period, select the History option
from the Device Logs menu and give the time range you’re interested in,
then hit OK.
Select time range of the device logs.
You can also download the logs for the further investigation by clicking
the download icon on the Device Logs menu.
Control devices
You can reboot and shutdown the device from the dashboard.
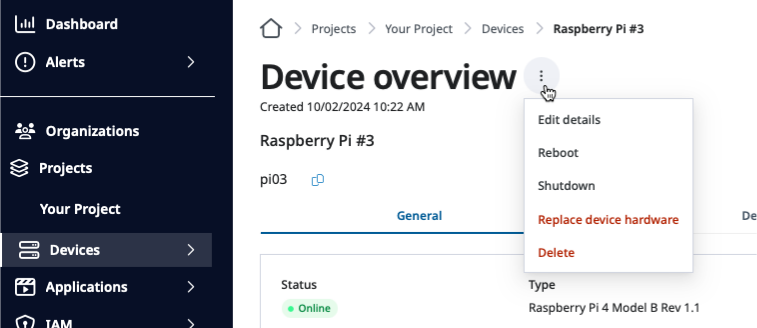
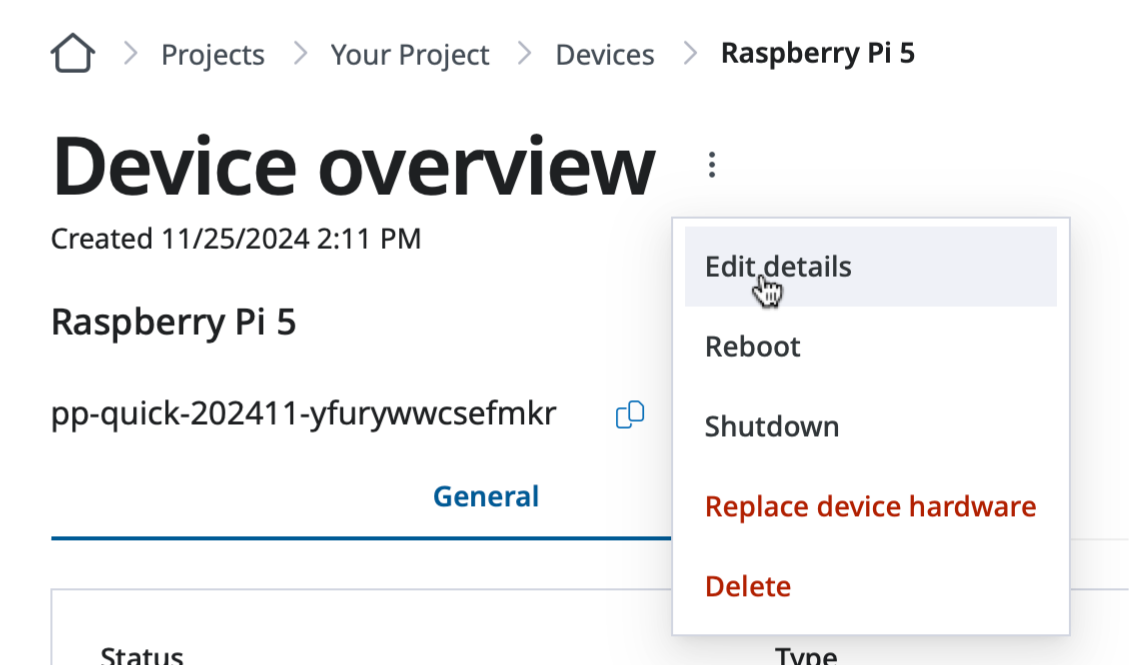
Click the vertical tripple dots right next to the Device overview
title to show the pull down menu for the control options.
Device control options shown on the Device overview page.
Select Reboot or Shutdown to take the actual action.
Access devices
You can access the device console over SSH from the dashboard or
the local terminal with cuttle command.
Access devices from dashboard
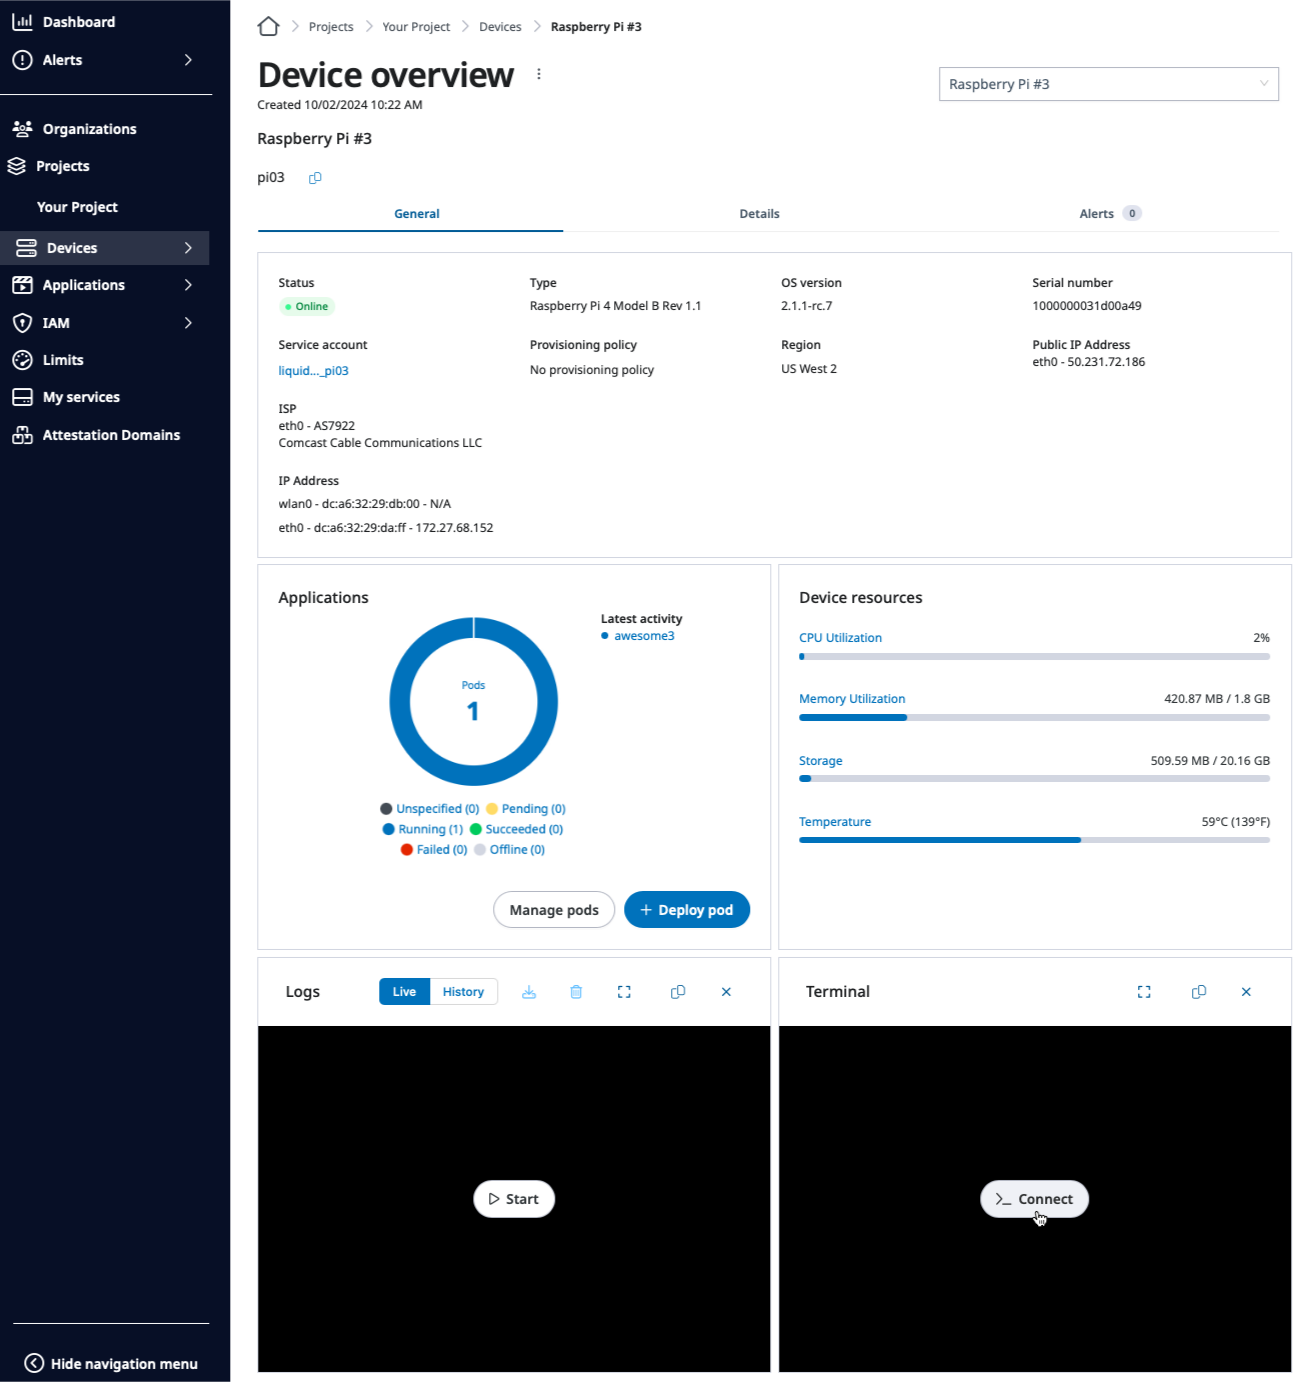
Go to the Terminal window of the Device overview page and click
Connect button to access to the device console.
Connect button on the Terminal window of the Device overview page to access the device.
Access devices from your machine
You can access the device console from your local machine.
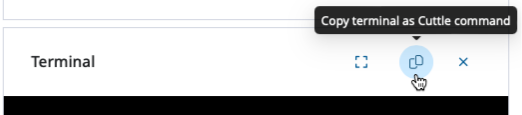
Click the Copy terminal as Cuttle command button in the Terminal window
menu and paste it to the terminal of your local machine.
Copy cuttle command for the device terminal access.
SPEKTRA Edge supports the Syslog sevierity levels outlined in RFC5424 Section 6.2.1.
Here is the brief description of those log levels for your reference.
Log level
Description
Emergency
Logs for the unstable system situation.
Alert
Logs for the immediate action required, or the above.
Critical
Logs for the critical conditions, or the above.
Error
Logs for the error conditions, or the abvoe.
Warning
Logs for the warning conditions, or the above.
Notice
Logs for the normal but significant conditions, or the above.
Informational
Logs for the informational messages, or the above.
Debug
Logs for the debug-level messages, or the above.
Setting the lower device log level means the device uploads the logs at that level and all
the higher level logs.
Set it to the higher log level, e.g. Error, in case if you want to reduce the logs
forwarded by the particular devices.
Change device log levels
It’s super simple to change the device log forwarding levels.
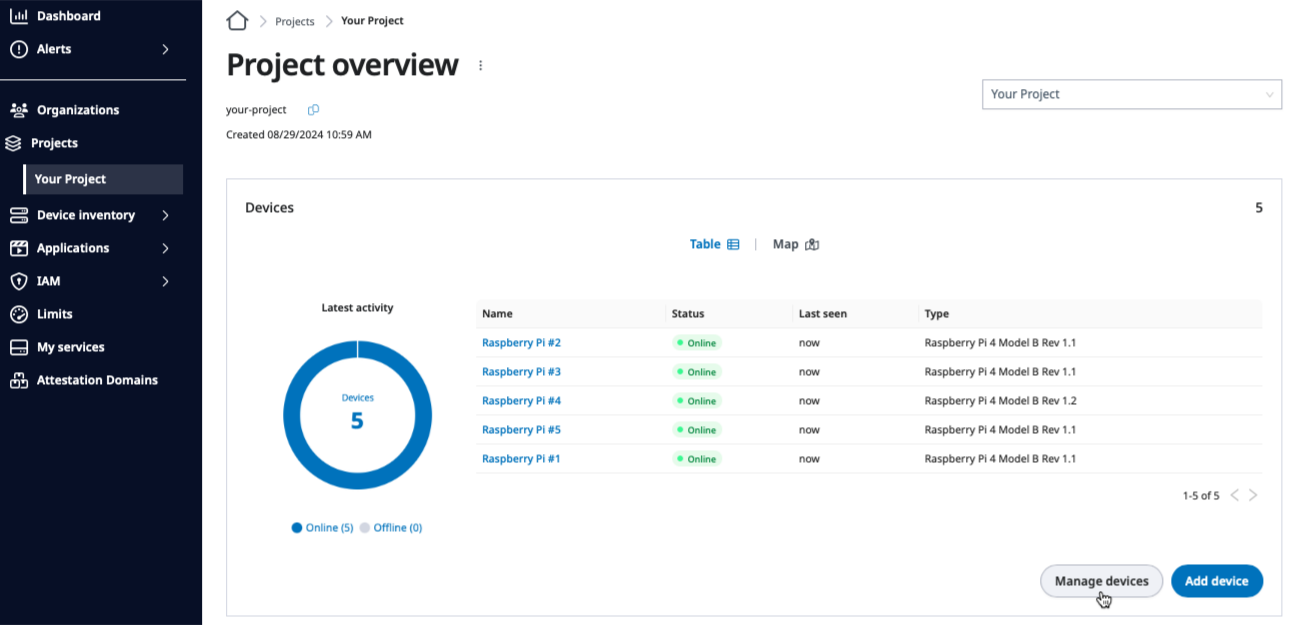
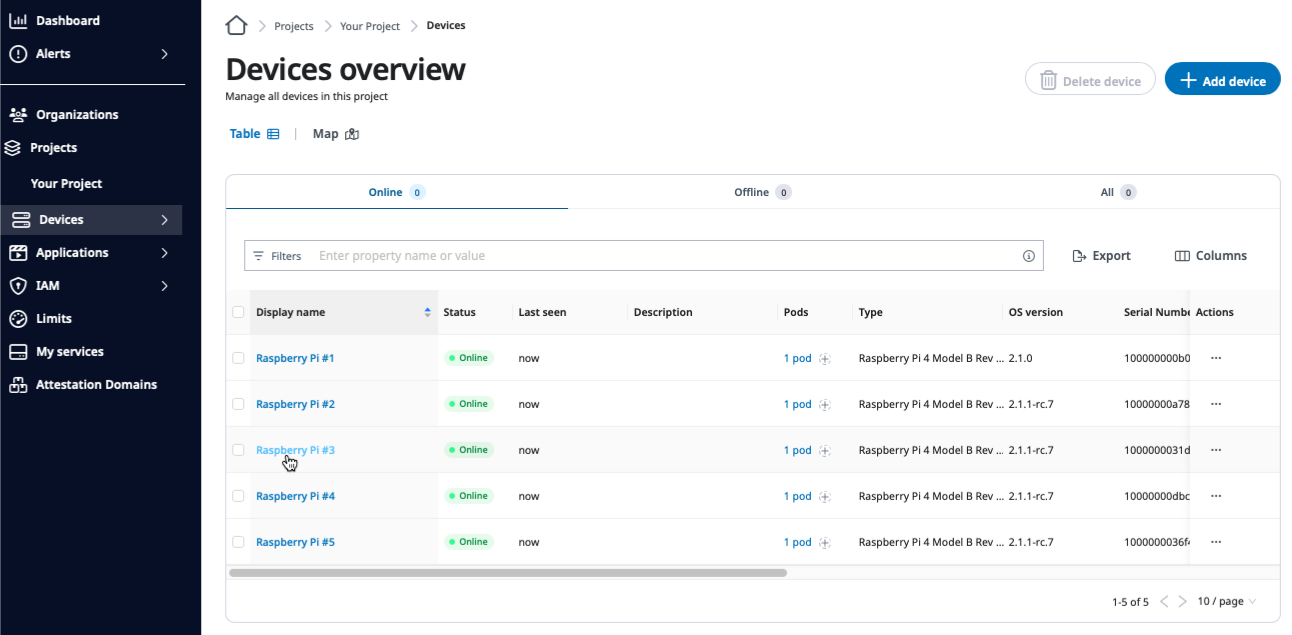
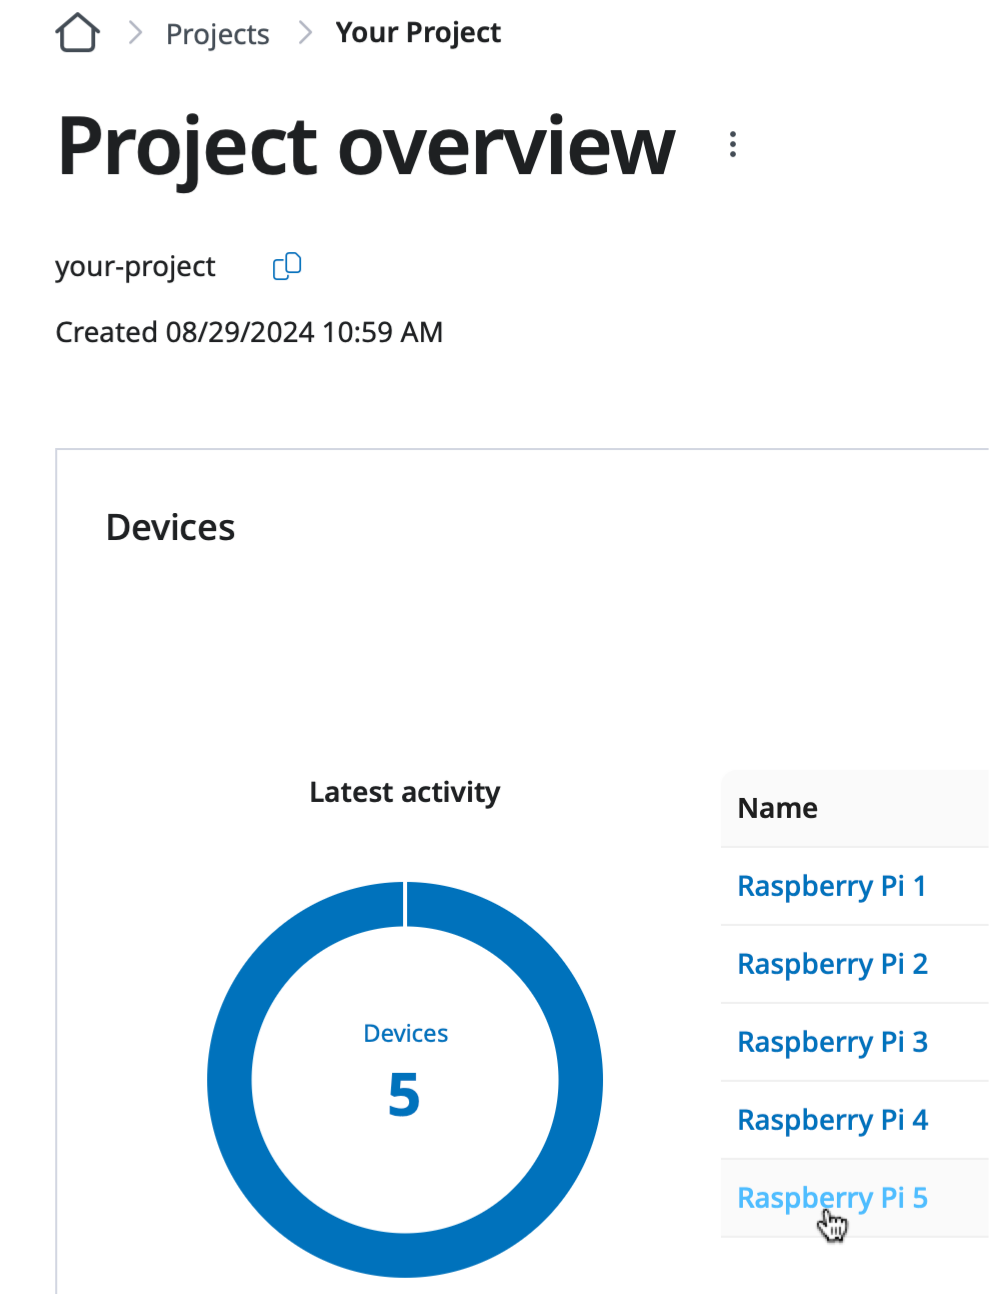
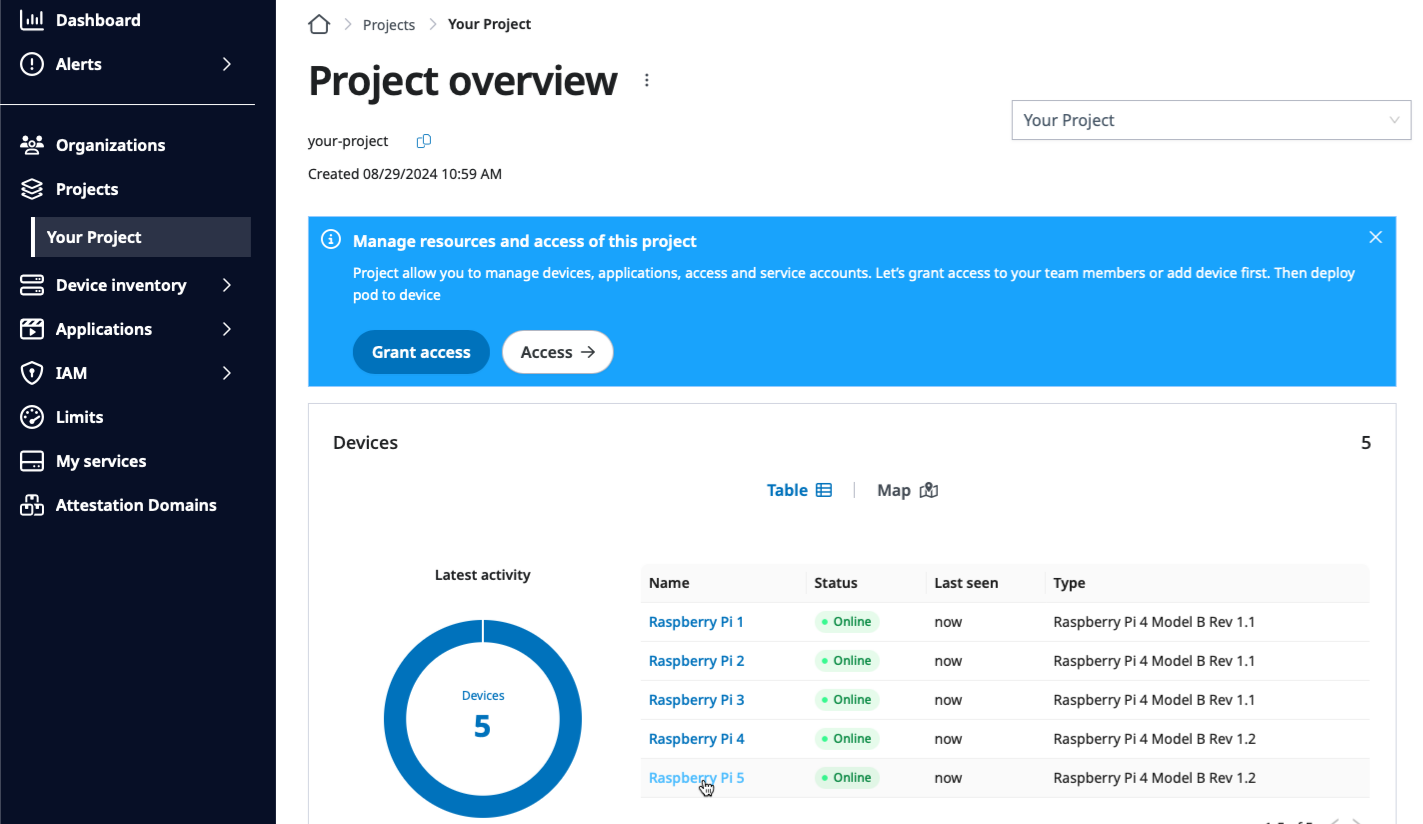
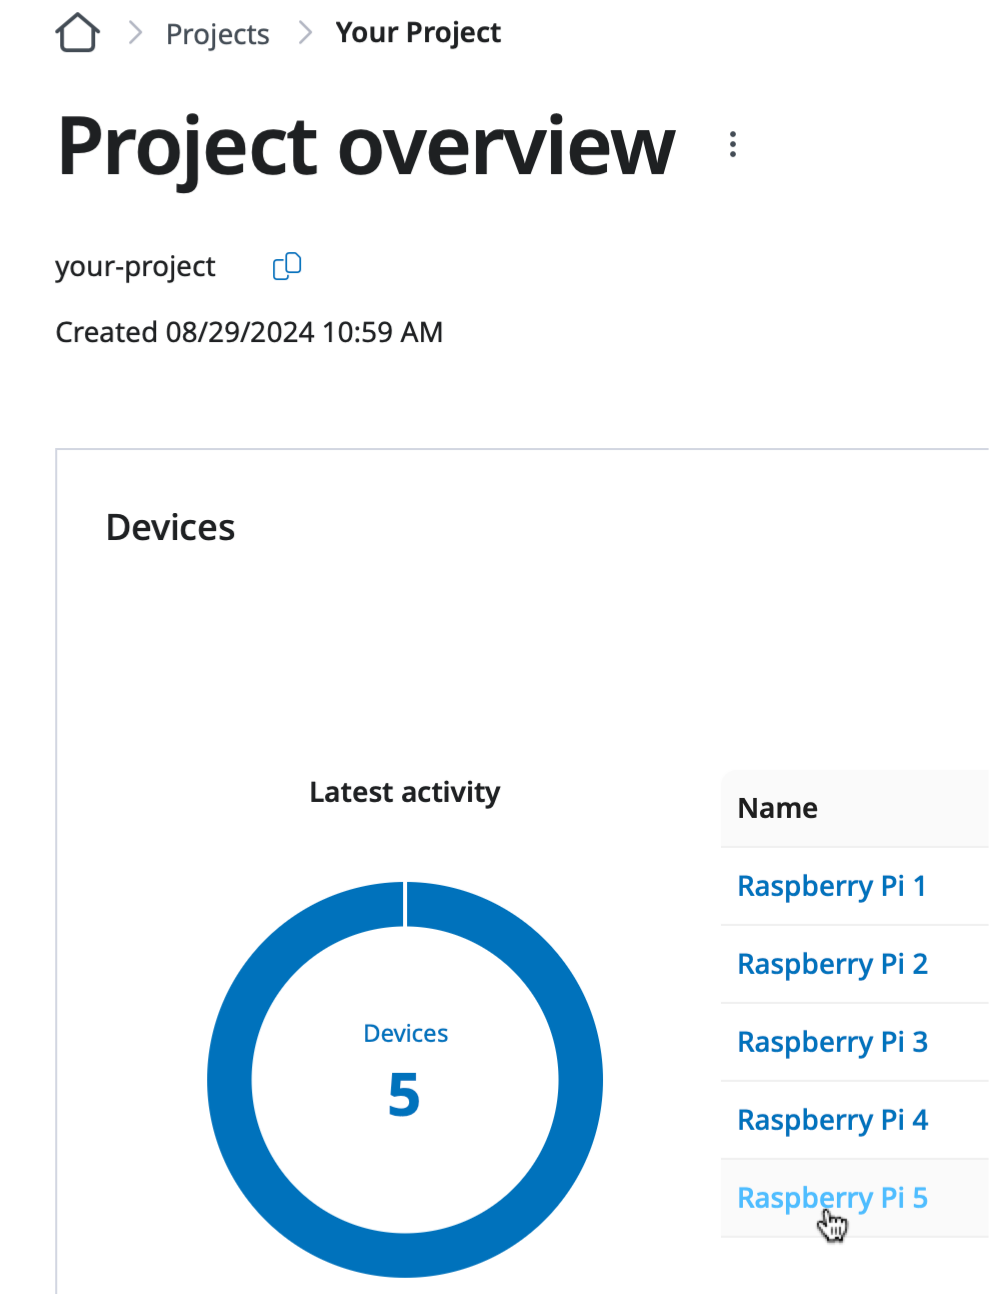
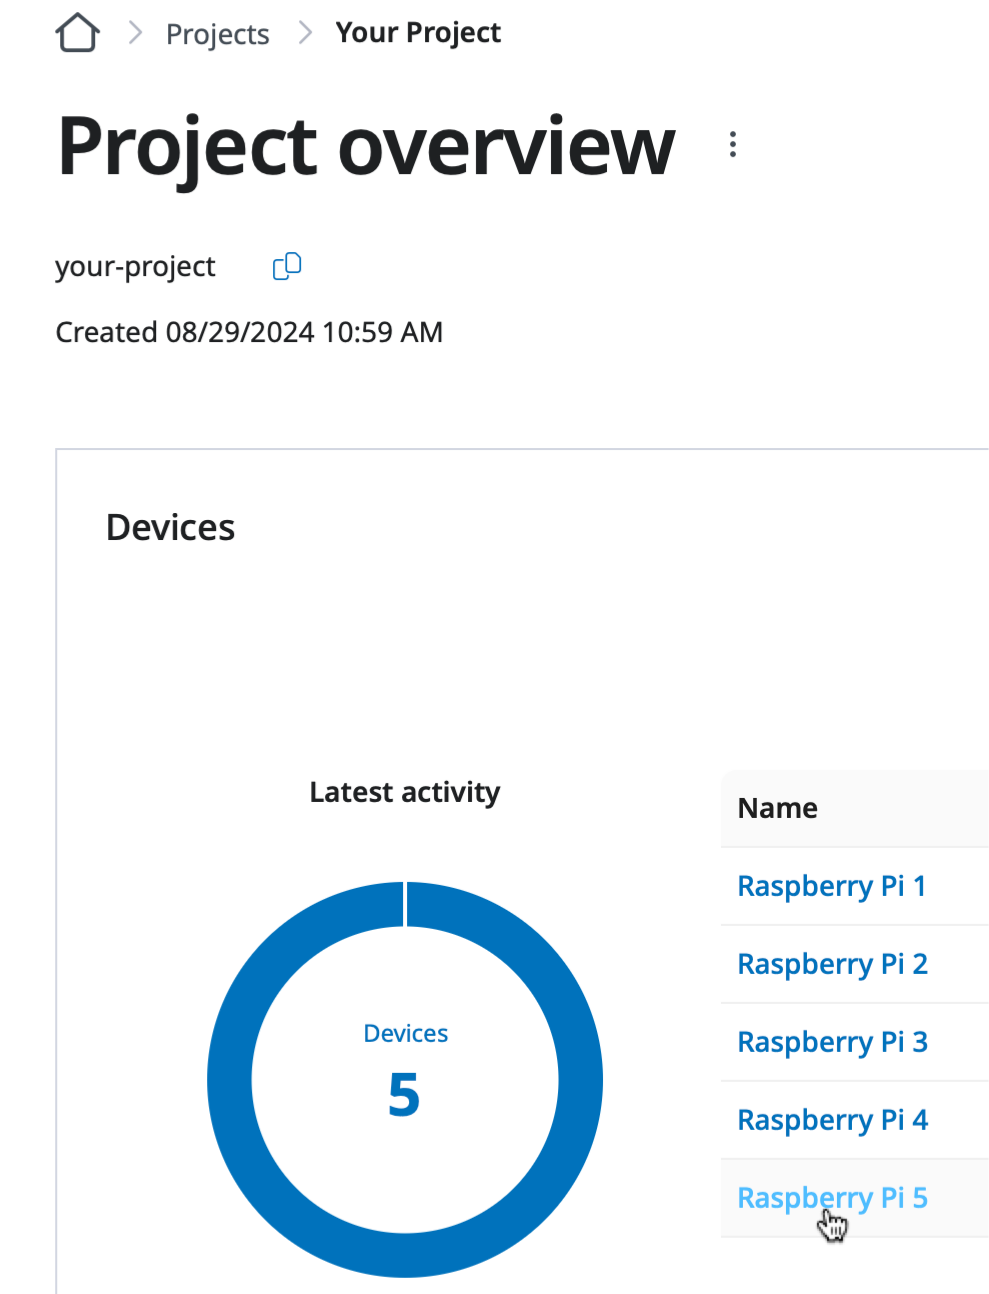
Go to the Device overview page by clicking the device name on the Project overview page.
Clicking the device name, Rapberry Pi 5, on the Project overview page.
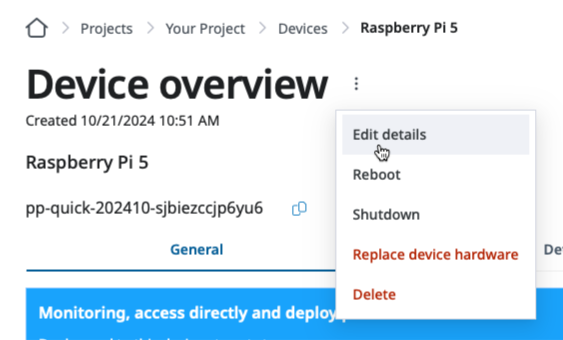
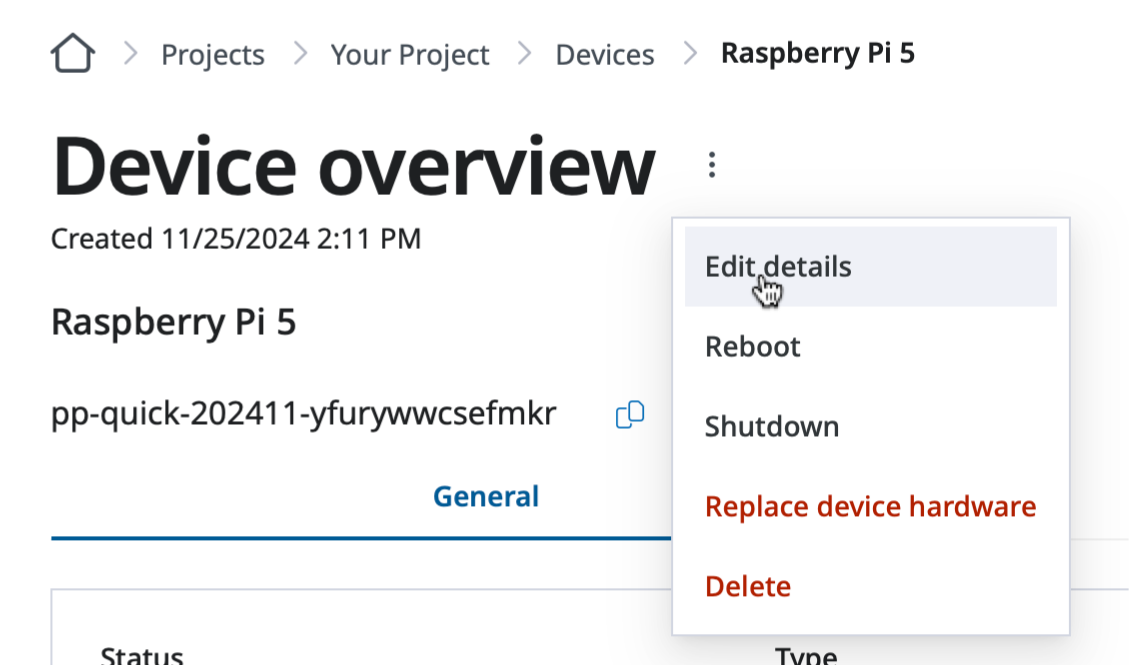
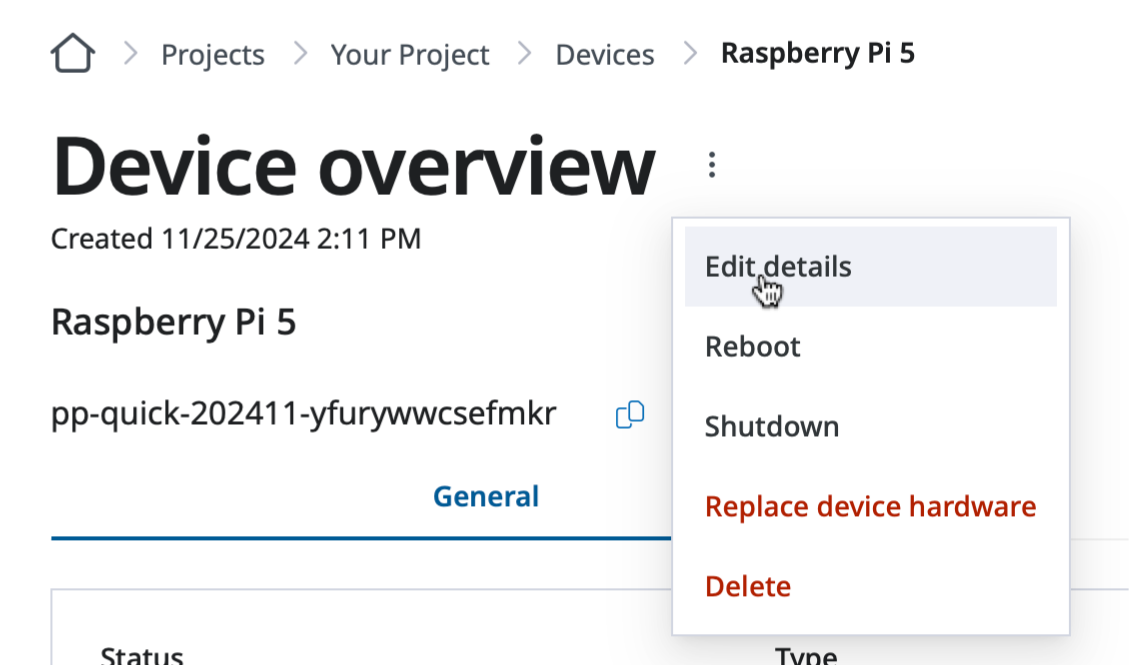
Open the Update device details page by clicking the Edit detail option of the
device menu option.
Click the Edit detail option of the device menu option.
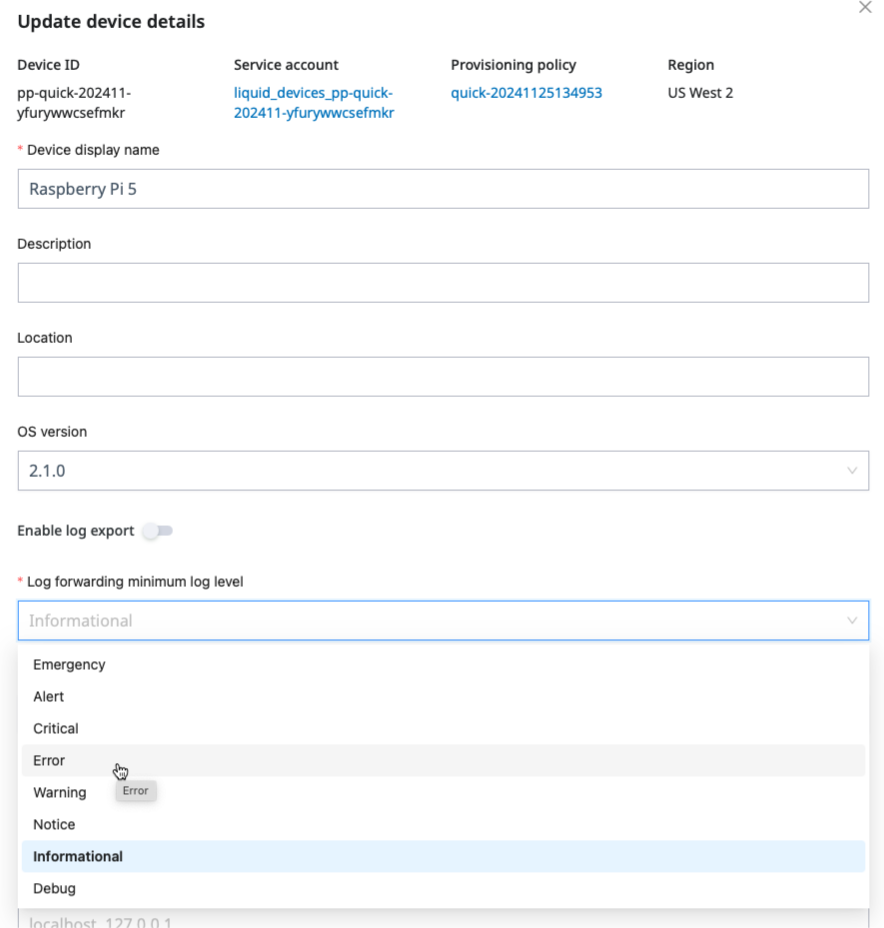
Set the appropriate device log fowarding levels, e.g. Error, by selecting it in the
Log forwarding minimum log level field.
Changing the device forwarding minimum log level to Error from Informational.
That’s it!
Next step
Congratulations for understanding various device logging levels supported on SPEKTRA Edge
and how to change those.
Let’s move on to the next learning material, device networking on SPEKTRA Edge.
Onwards.
2 -
Manage device networking
Let’s learn how to manage device networking on SPEKTRA Edge.
We utilize the Canonical Netplan to manage device networking on SPEKTRA Edge.
It provides the clean and intuitive YAML based configuration and support wide range of
Linux networking managers.
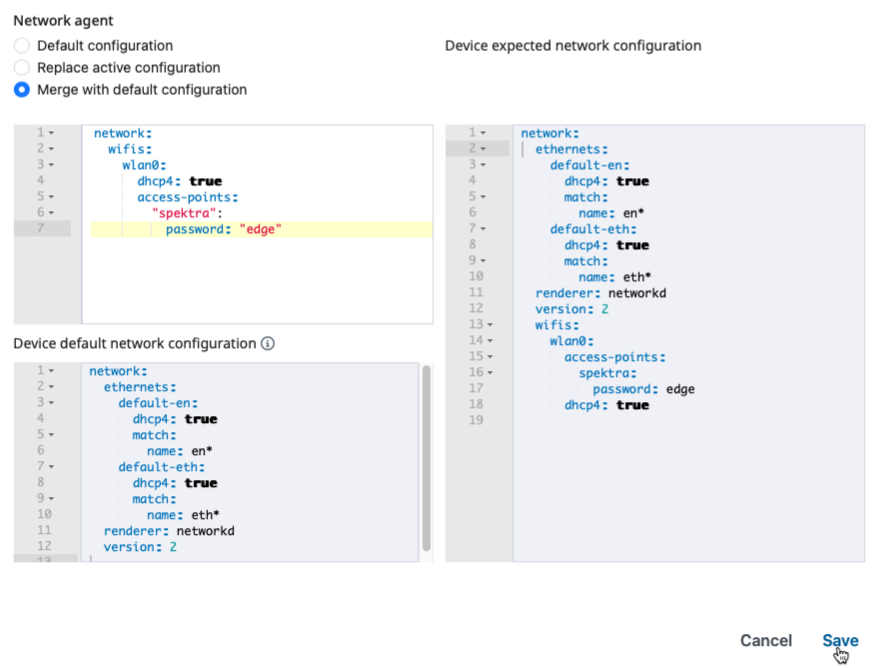
In this guide, we’ll learn how to configure the wireless interface on Raspberry Pi as the
secondary interface to get familier with the Netplan YAML configuration.
Netplan how-to guides
Please take a look at the official Netplan how-to guides for additional examples
how to configure device networking.
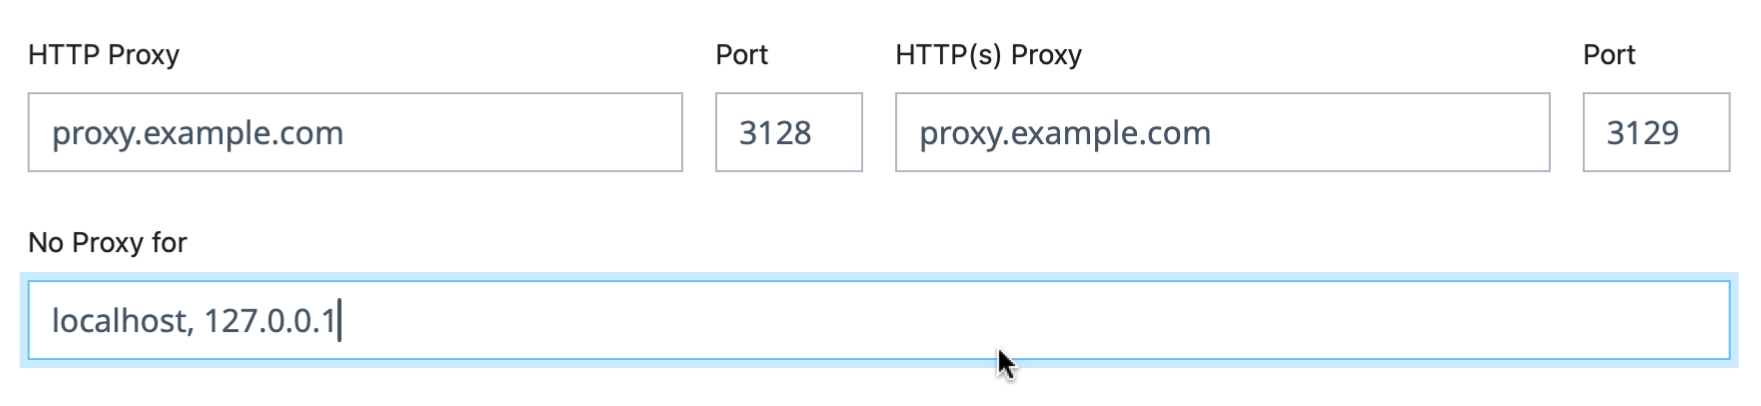
If your edge device network is configured to use the proxy servers to access the
internet, especially accessing the container registries, you need to configure
the proxy servers on your device.
Configuring the network proxy servers on SPEKTRA Edge is easy and straight forward.
You can easily upgrade the SPEKTRA Edge OS to the newer releases.
Go to the Device overview page of the target device under your project by clicking the
name of the device on the Project overview page.
Open the Update device details page by clicking the Edit detail option of the
device menu option.
Click the Edit detail option of the device menu option.
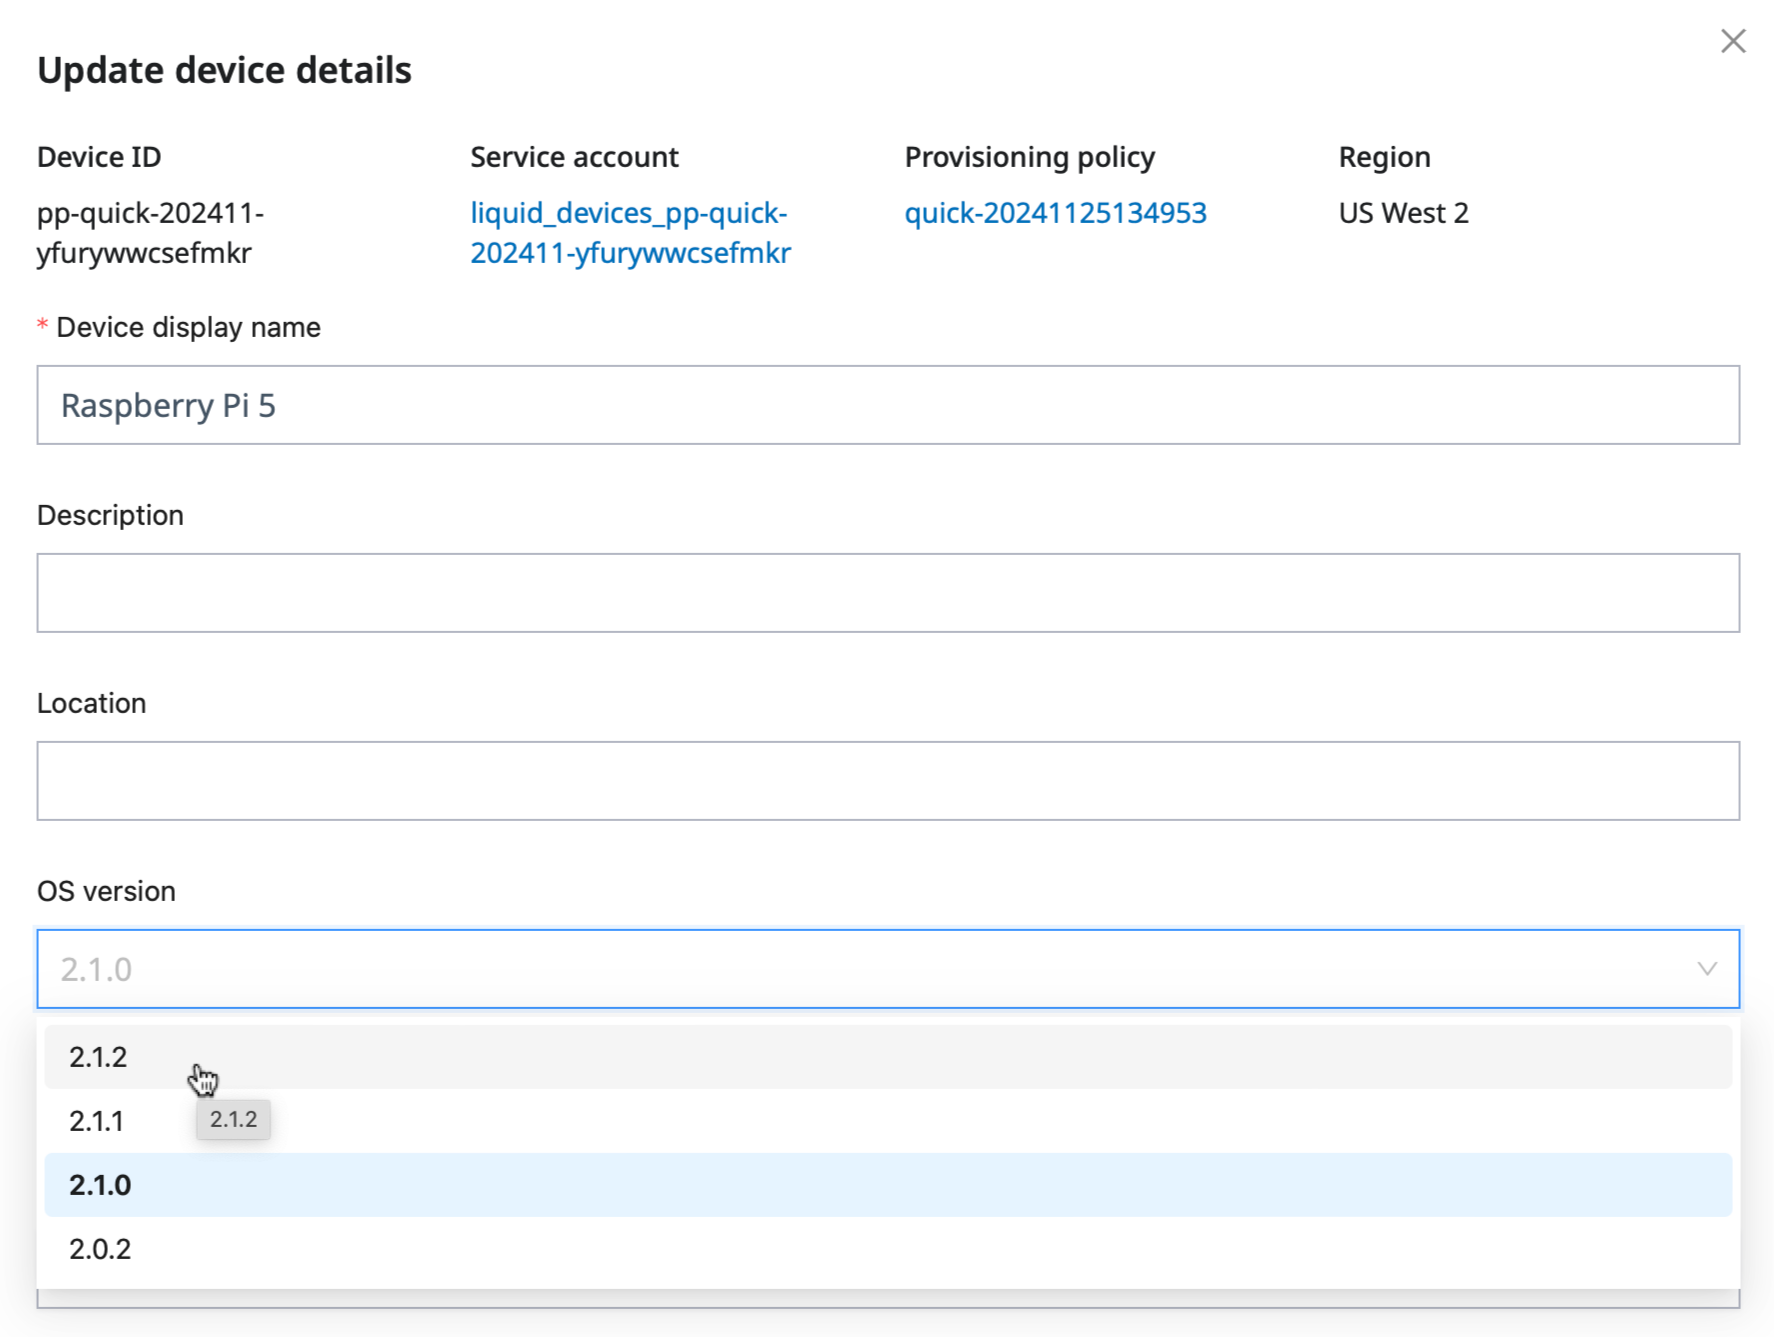
Select the OS version, 2.1.2 in this example, and click Save to trigger the OS upgrade
process.
Specify the desired OS version on the Update device detail page and click Save.
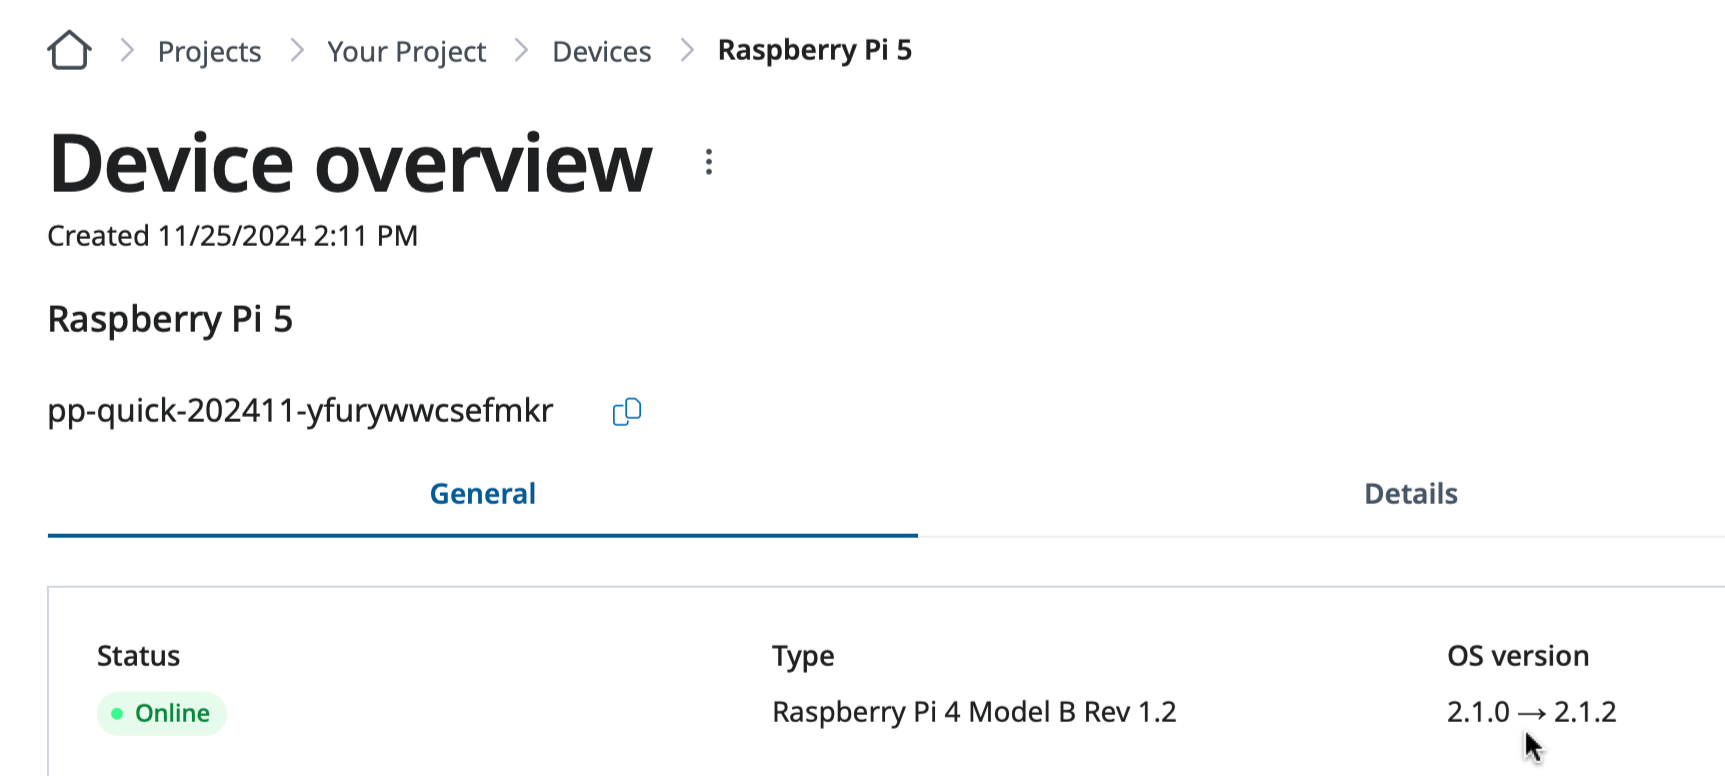
The upgrade operation will start automatically and you will see the OS version transition information
on the Device overview page.
There is a OS version transition information on the Device overview page.
After some time, you will see the device Offline, which indicate the device is restarting
with the new OS version.
The device is shown as Offline to finalize the upgrade process by restarting the device.
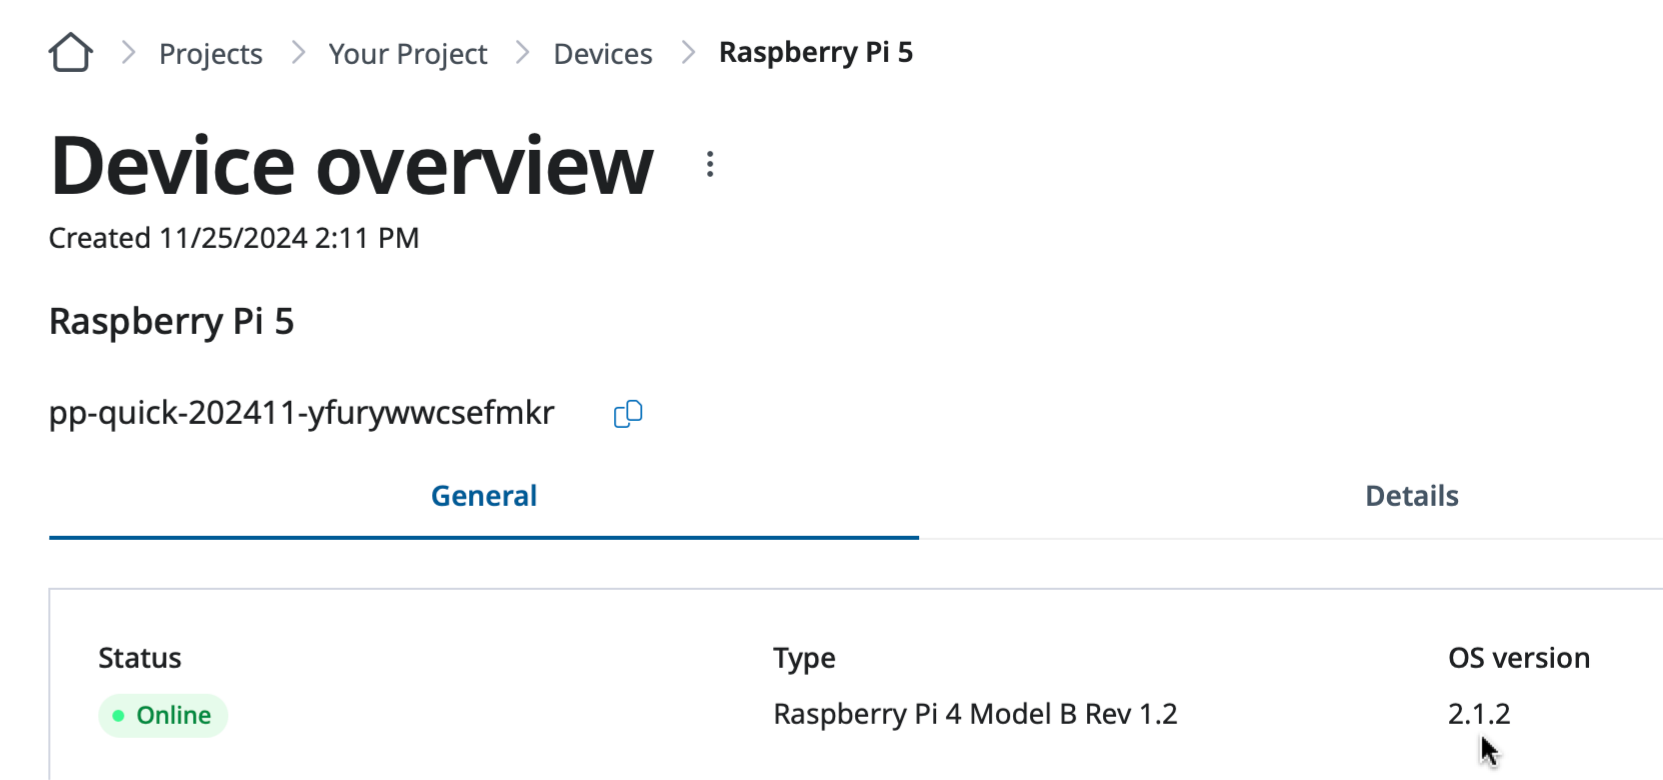
You will see the device up and running with the new OS version on the Device overview page
once it boots up.
The device is up and running with the new OS version.
Downgrade SPEKTRA Edge OS
You can do the same for the downgrade OS release versions as well.
Caution on OS downgrading
Some OS version downgrade could cause some issue, e.g. some features don’t work, unreachable devices,
etc. Please consult the SPEKTRA Edge customer support before conducting the OS downgrade process.
Go to the Device overview page of the target device under your project by clicking the
name of the device on the Project overview page.
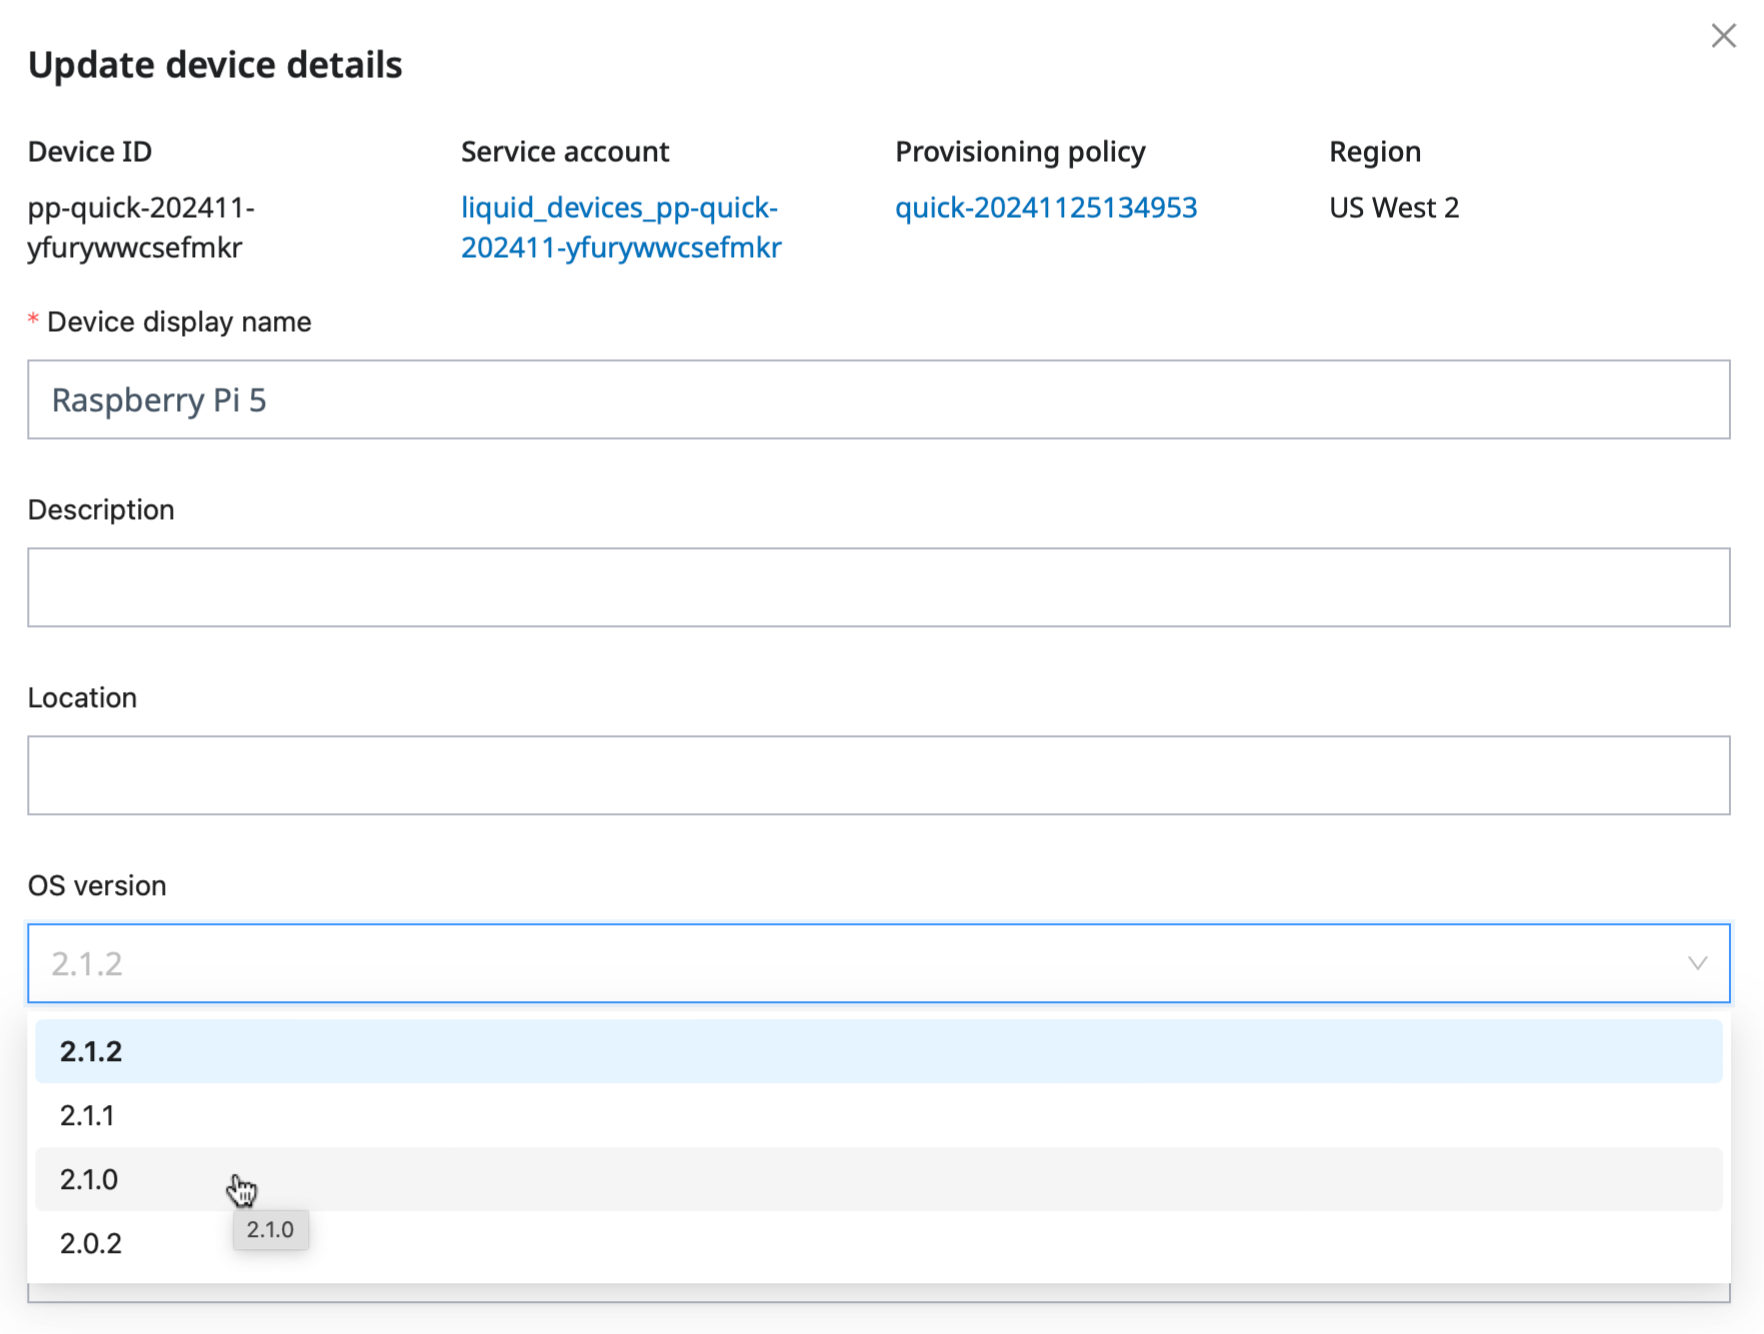
Open the Update device details page by clicking the Edit detail option of the
device menu option.
Click the Edit detail option of the device menu option.
Select the downgrade OS version, 2.1.0 in this example, and click Save to trigger
the OS downgrade process.
Specify the desired OS version on the Update device detail page and click Save.
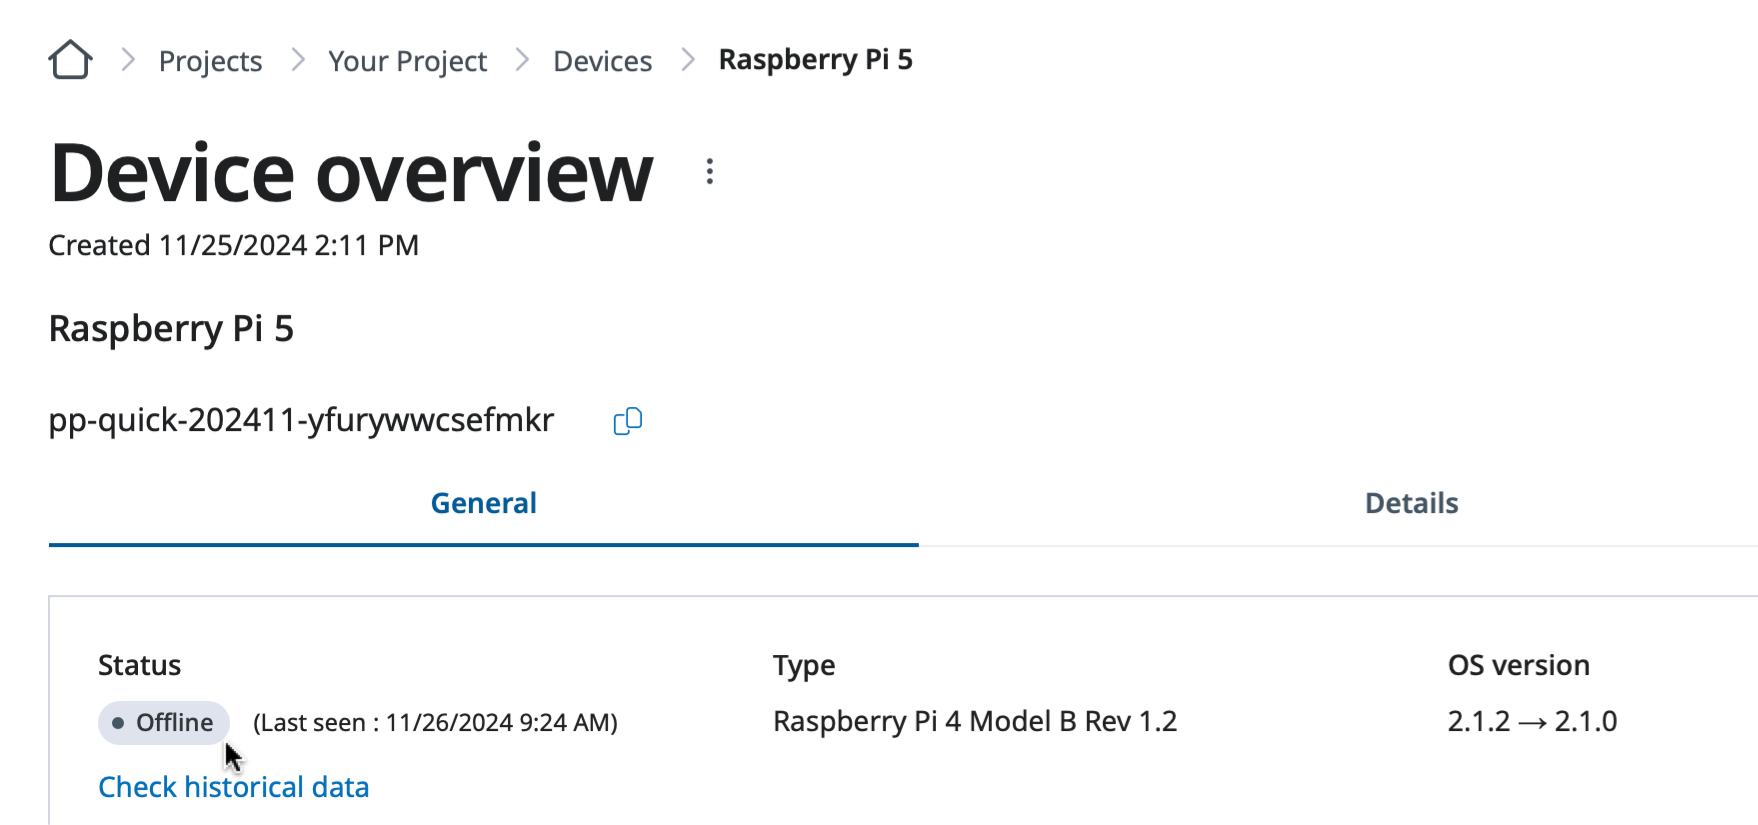
The OS downgrade process automatically starts once you click the Save button of the
Update device details page.
After a minutes or so, you will see the device status Offline with the OS version transition
information on the Device overview page.
There is a OS version transition information on the Device overview page.
You will see the device up and running with the new OS version once it boots up.
The device is up and running with the new OS version.
Next step
Congratulations for mastering how to manage SPEKTRA Edge OS release versions.
Let’s move on to the next learning material, managing alerts on SPEKTRA Edge.
Onwards.
4 -
Manage alerts
Let’s learn how to manage alerts on SPEKTRA Edge.
SPEKTRA Edge offers powerful alerting system built-in to monitor majority part
of the system managed by the platform, includes devices and applications. The
platform even allow you to extend the standard alert system by defining brand new
alerts to meet your needs.
In this page, we will learn how to create standard alerts, the device connection
status alert and the CPU utilization alert, to get familier with the SPEKTRA Edge
alerting system.
See also
Alert metrics: a catalog of everything you can alert on
(CPU, memory, disk, temperature, network, cellular signal, health checks, and
application metrics) with practical use cases.
AI Alerting: anomaly detection, adaptive thresholds, and an AI
agent that investigates and remediates fired alerts for you.
What you need
You need the followings to setup the alerts on SPEKTRA Edge.
The alerting policy is the top component to organize both the alerting conditions
and the notification channels. It also contains the triggered alerts so that you
can observe the historic alerts for the particular policy.
The alerting condition let you express the condition in which the alert happens,
for example, the device loses the connection or the CPU utilization passes a
certain threshold.
The notification channel expresses how and where the alert is sent, either through
email or slack.
Please take a look at the following diagram to understand the relationship of those
three components.
---
markmap:
  zoom: false
  pan: false
---

# Alerting poilicy

## Alerting conditions

- CPU utilization condition
- Memory utilization condition
- Disk utilization condition
- Device hardware temperature condition

## Notification channels

- Slack notificaiton
- Email notification

## Triggered alerts

- CPU utilization alert fired at 11/10/2024 11:45 on device 5
- Memory utilization alert fired at 11/09/2024 09:45
  and resolved in 2 hours on device 2
- etc.
Multiple alerting conditions and notification channels
Multiple conditions and channels is allowed under the alerting policy, as shown
in the diagram above, though, it’s not a necessity.
You can create the alerting policy with one alerting condition and one notification
channel. You can create a policy even without a notification channel.
Let’s take a look at those more detail with the actual example.
Alerting policies
A alerting policy is the top level component to organize both the alerting
conditions, notification channels, and the actual triggered alerts.
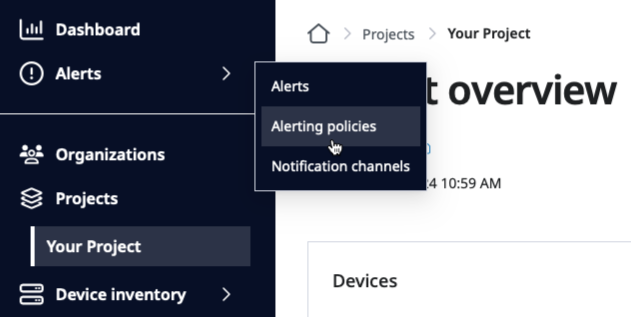
Select the Alerting policies option of the Alerts pull down-menu to go
to the Alerting overview page.
Selecting the Alerting policies option from the Alerts pull down menu.
Once you’re on the Alerting overview page, click the Create alerting policy
button located at the top right corner.
Click the Create alerting policy on the Alerting overview page.
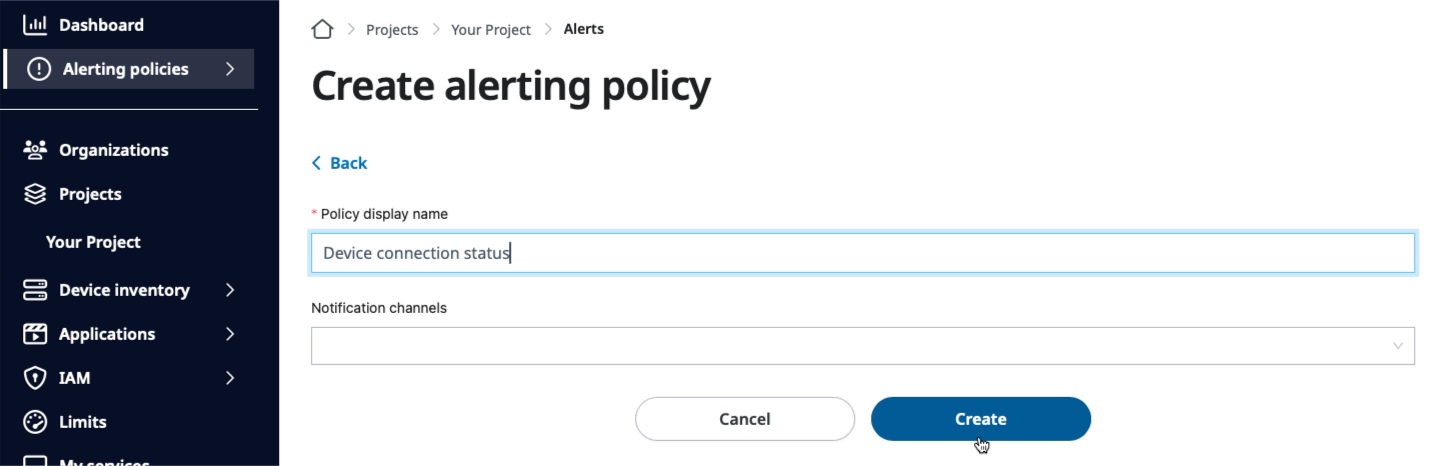
Fill in the alerting policy name and click Create. We’ll fill in
the notification channels in the later stage.
Create the alerting policy by clicking the Create button on the Create alerting policy page.
That’s it. Let’s move on to the alerting condition next.
Alerting conditions
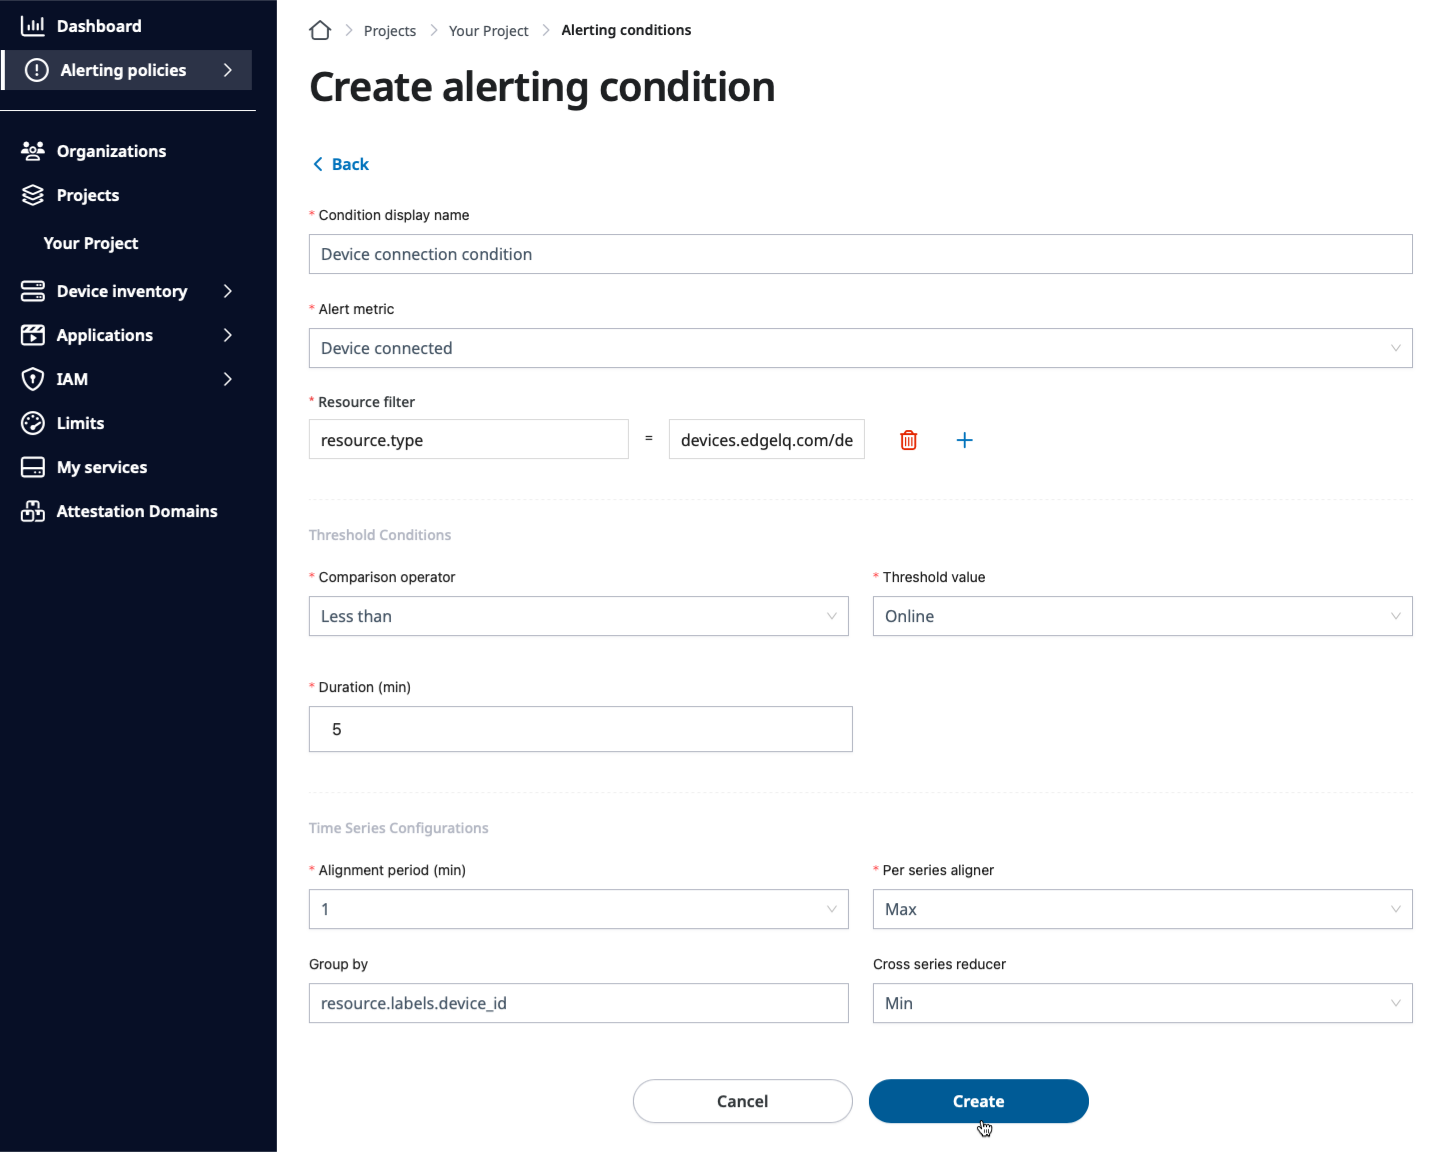
Let’s create the alerting condition to detect the device connection status.
A alerting condition, as the name suggests, defines the condition to trigger
alerts. It’s grouped in three different sections and we’ll go over those
one-by-one in the following sections.
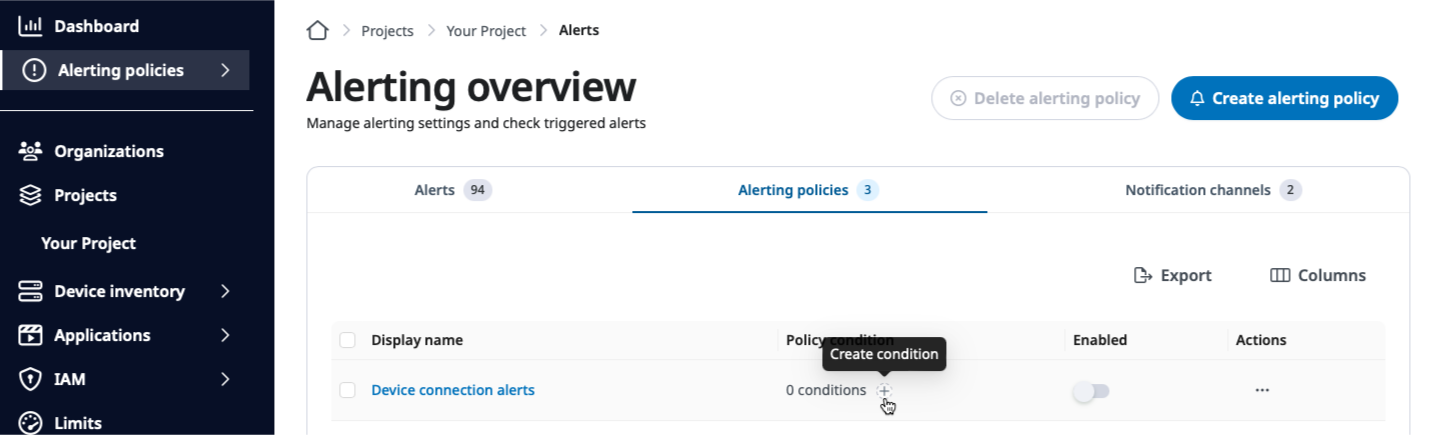
But first, let’s open the Create alerting condition page by clicking the
policy condition plus sign on the Alerting overview page.
Create the alerting condition by clicking the plus sign on the Alerting overview page.
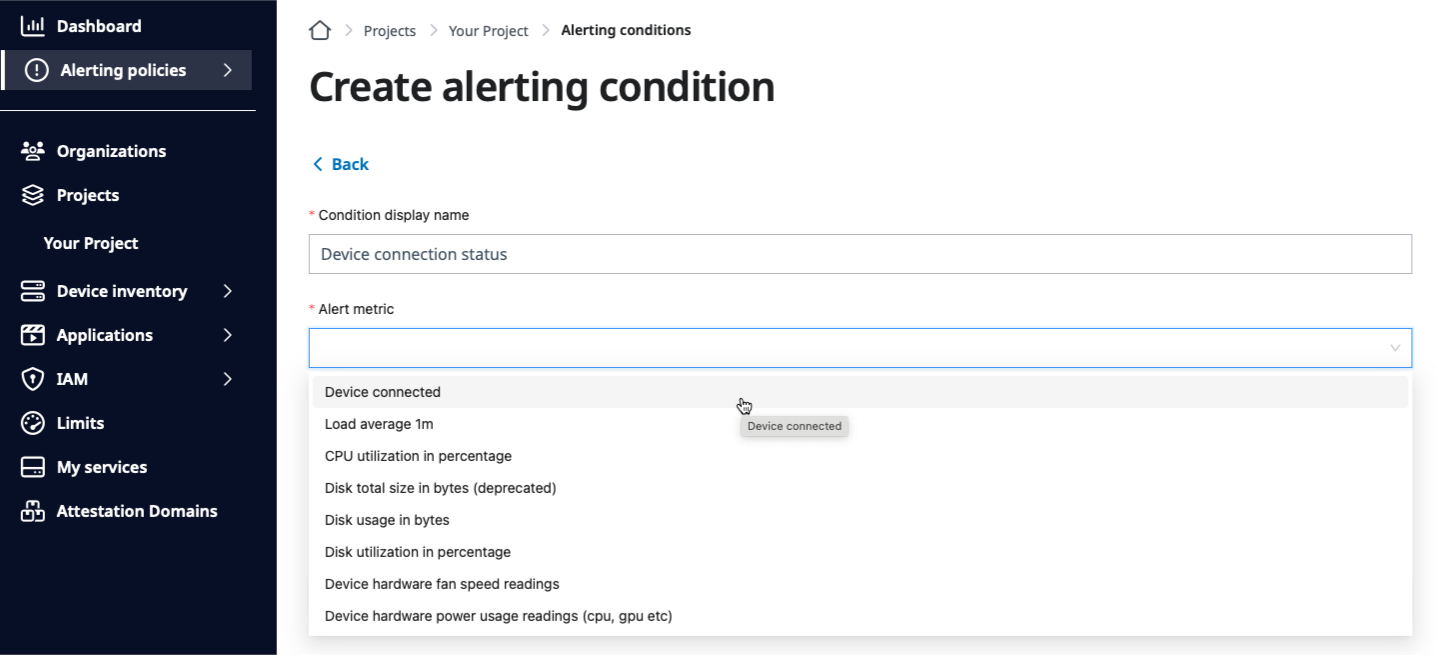
Alert metrics
The alert metric section is the first thing to set on the Create alerting condition
page. It gives you all the alerting options supported by the system. You could
browse those to understand what are covered by the SPEKTRA Edge alerting
system.
Let’s select the Device connected alert metric type for the device connection
status alerting condition.
Select the Device connected alert metric option as the Alert metric value.
You don’t need to touch the resource filter section, which is automatically set
by the system, unless you need the additional filtering.
Threshold conditions
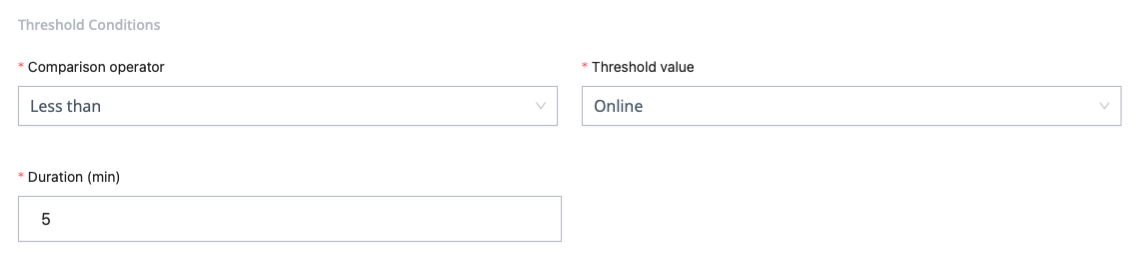
The threshold conditions section is where to configure the alerting condition.
Here is the threshold condition for the device connection status alerting condition
for firing alerts when the device is offline for more than five minutes.
The threshold condition for the device is offline more than five minutes.
Since the Online status is treated as number one and Offline as number zero,
we use the Less than operator against the Online status to detect the
device offline event. You set the duration time to five minutes to express
the system to trigger alerts when the device is offline more than five minutes.
Time series configurations
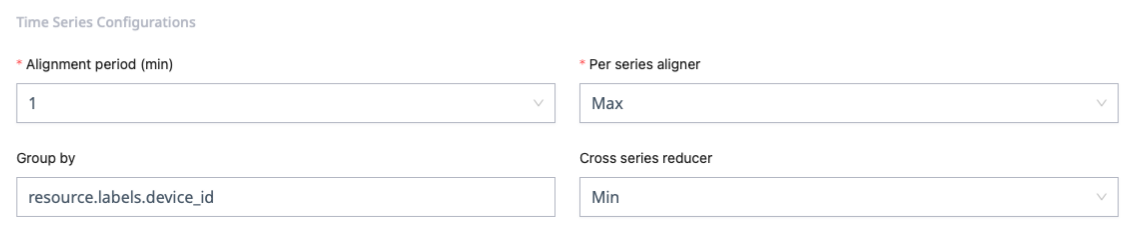
The time series configuration section expresses how to aggregate data points for
the targetted time series data. There are two time series aggregation functionalities
here.
the alignment period with the per series aligner
the time-series grouping with the cross series reducer
Let’s take a look at the actual example to understand those two functionalities.
The time series configuration to aggregate time series data points.
Here is the detailed description.
the alignment period to one minutes with the Maxper series aligner
resource.labels.device_id based grouping with the Mincross series reducer
The first aggregation is for the noise reduction. It treats the device
is offline only when it’s offline for the entire one minutes.
The second aggregation is to treat each devices under the project separately, which
is the the grouping part. Since there is only one state for the device connection,
the reducer doesn’t mean anything. We’ll take a look at the
other example and explain the usage of the reducer there.
Let’s click Save as you completed the device connection status alerting
condition.
Click Save to finish the device connection status alerting condition.
Here is the brief description of the typical aligners and reducers for your reference.
Aligner name
The aligned data point
None
No alignment made and keeps all the time-series data points.
Mean
The average or arithmetic mean of the data points in the alignment period.
Min
The minumum value of the data points in the alignment period.
Max
The maximum value of the data points in the alignment period.
Count
The count of the data points in the alignment period.
Sum
The sum of the data points in the alignment period.
Stddev
The standard deviation of the data points in the alignment period.
Percentile 99
The 99th percentile of the data points in the alignment period.
Percentile 95
The 95th percentile of the data points in the alignment period.
Percentile 50
The 50th percentile of the data points in the alignment period.
Percentile 5
The fifth percentile of the data points in the alignment period.
Reducer name
The reduced data point
None
No cross time-series reduction.
Mean
The mean across the aligned data points of the multiple time series.
Min
The minium of the aligned data points of the multiple time series.
Max
The maximum of the aligned data points of the multiple time series.
Sum
The sum of the aligned data points of the multiple time series.
Stddev
The standard deviation of the aligned data points of the multiple time series.
Count
The count of the aligned data points of the the multiple time series.
Percentile 99
The 99th percentile of the aligned data points of the multiple time series.
Percentile 95
The 95th percentile of the aligned data points of the multiple time series.
Percentile 50
The 50th percentile of the aligned data points of the multiple time series.
Percentile 5
The fifth percentile of the aligned data points of the multiple time series.
Monitoring API document
Please take a look at the monitoring service API document for the technical
details for the aligners and the reducers.
A notification channel allows you to configure how to notify alerts over
multiple channels.
There are three types of notification channels supported by the SPEKTRA Edge.
Email
Slack
Webhook
Each channel will be created separately and be tied to the alerting policy to
be operational. A single channel can be shared by multiple alerting policies
We will go over how to create all three channels below and link those to the
alerting policy we’ve created in the previous step.
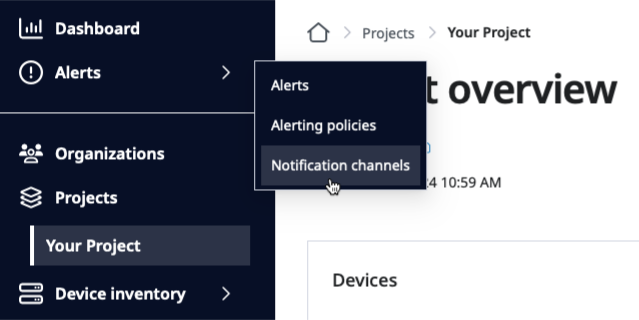
Select the Notification channels option of the Alerts pull-down menu to
open the Alerting overview page.
Select the Notification channels option from the Alerts pull-down menu.
Click the Create notification channel button to create a notification channel.
Click the Create notification channel button on the Alerting overview page
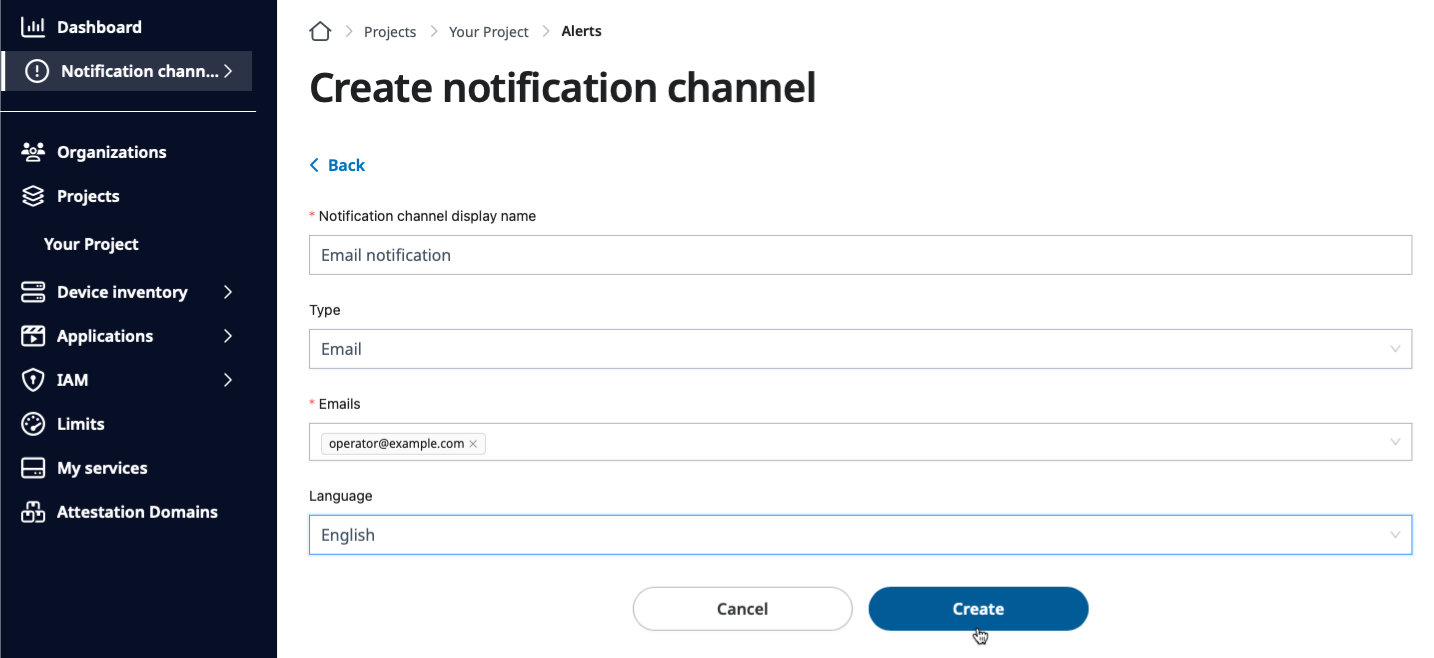
To create the email notification channel, you need to
select Email in the type field
fill in the email address(es) in the Emails field
and click the Create button.
Fill in the email address(es) and click the Create button.
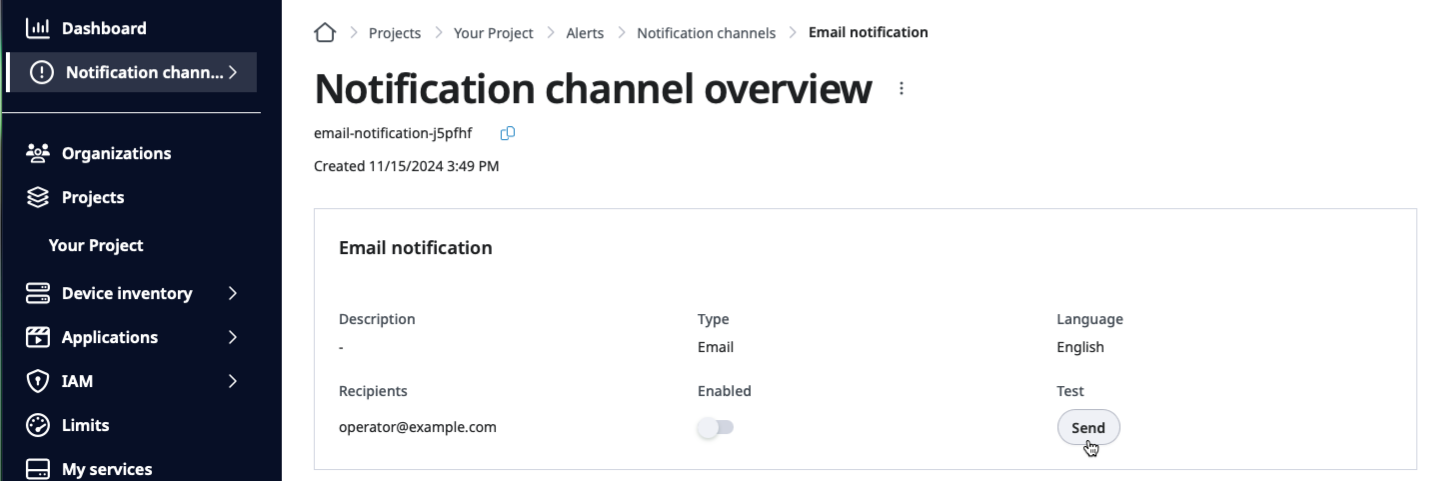
Click the Send button to send the test email notification to verify the
configuration.
Clicking the Send button to send the test email notification.
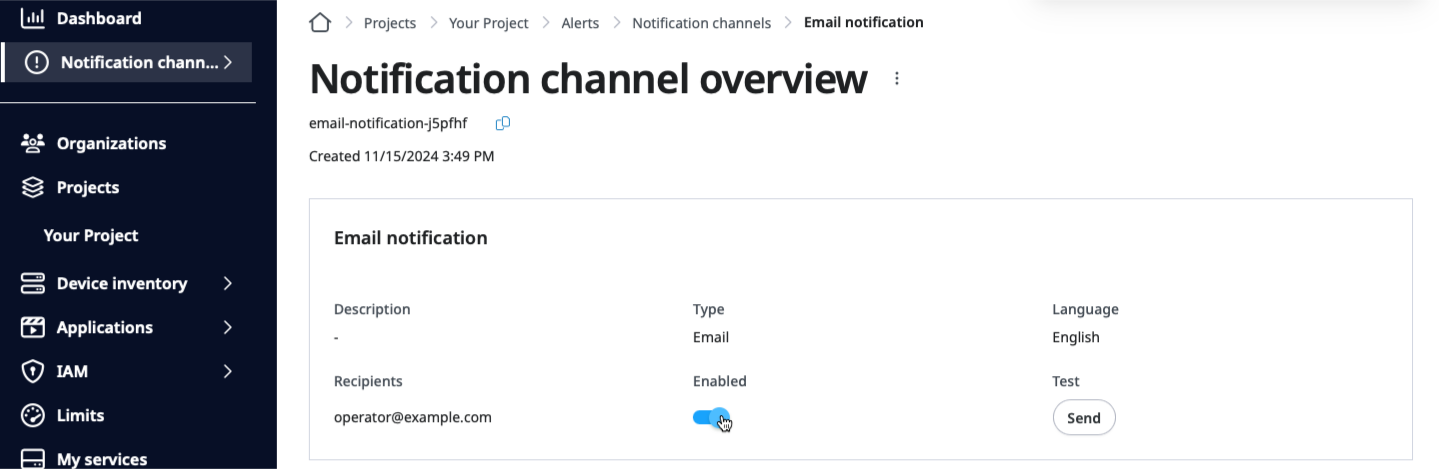
Enable the notification channel by clicking the Enabled switch once
you verify receiving the test email notification from SPEKTRA Edge.
Enabling the email notification channel.
You need a webhook endpoint to configure the Slack notification channel on
SPEKTRA Edge.
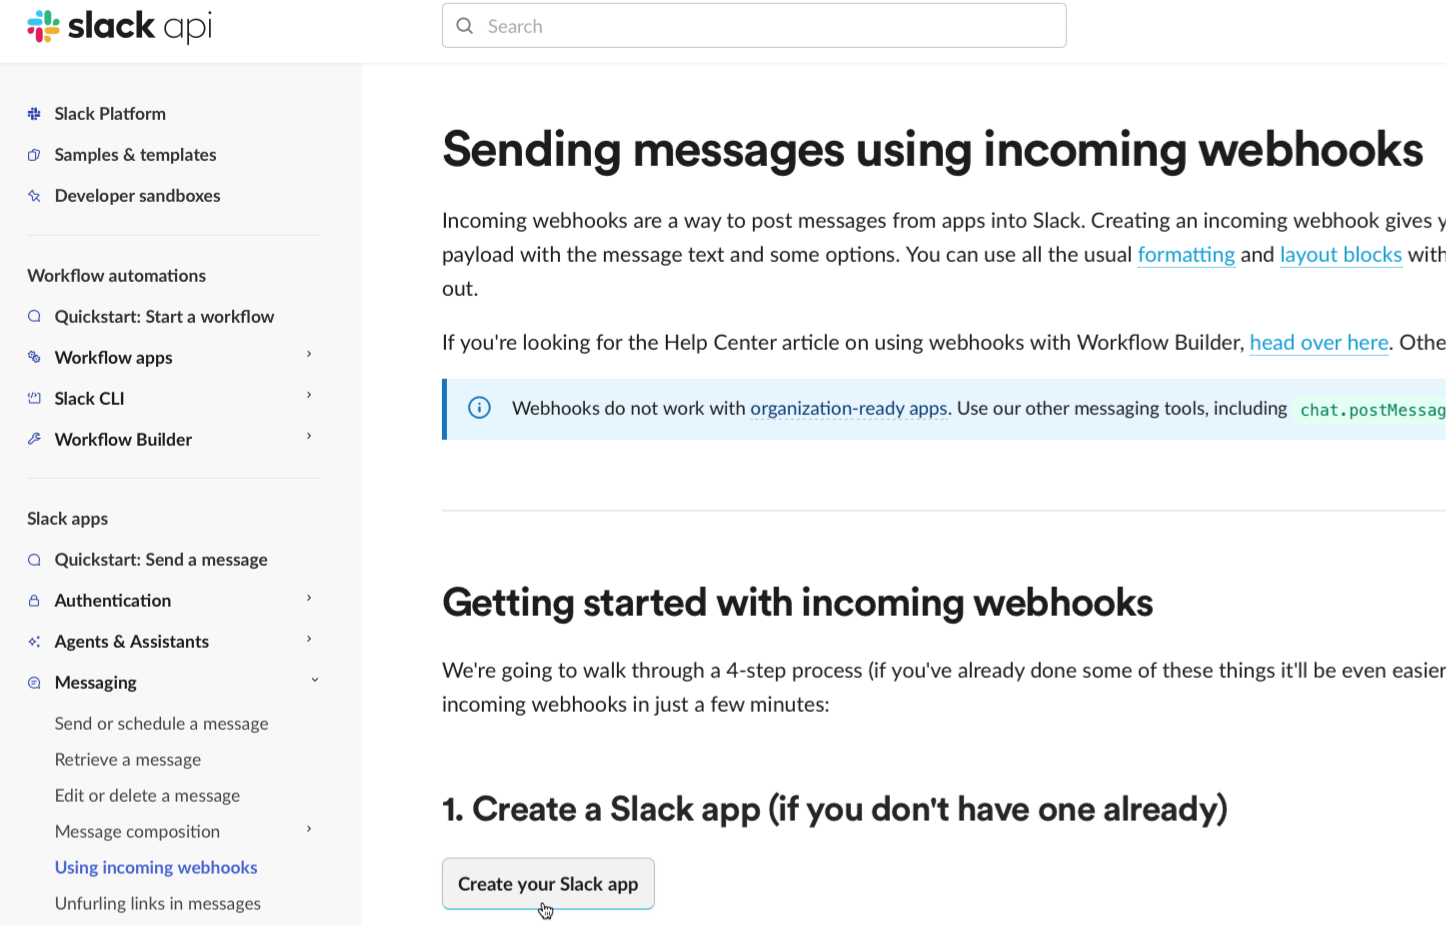
Go to the official slack api page and create your Slack app,
if you haven’t have one yet, by clicking the Create your Slack app button.
Clicking the Create your Slack app button on the Slack api page.
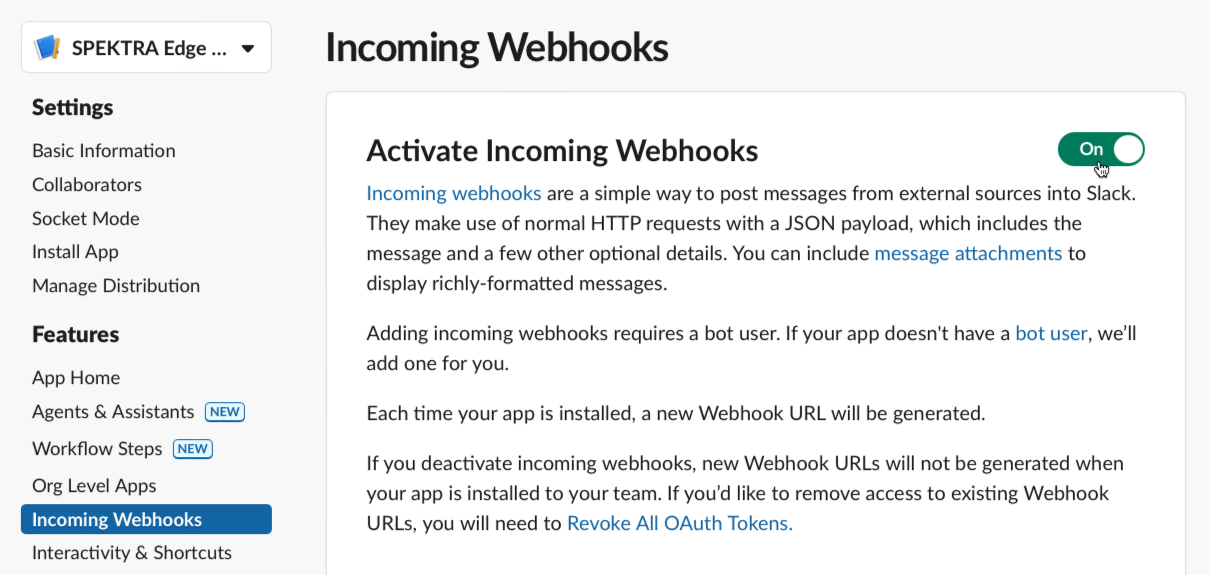
Once you have your Slack app, go to the Incoming webhooks section and activate
the incoming webhooks by toggling the Incoming Webhooks switch On.
Activating the incoming webhooks by making the switch On.
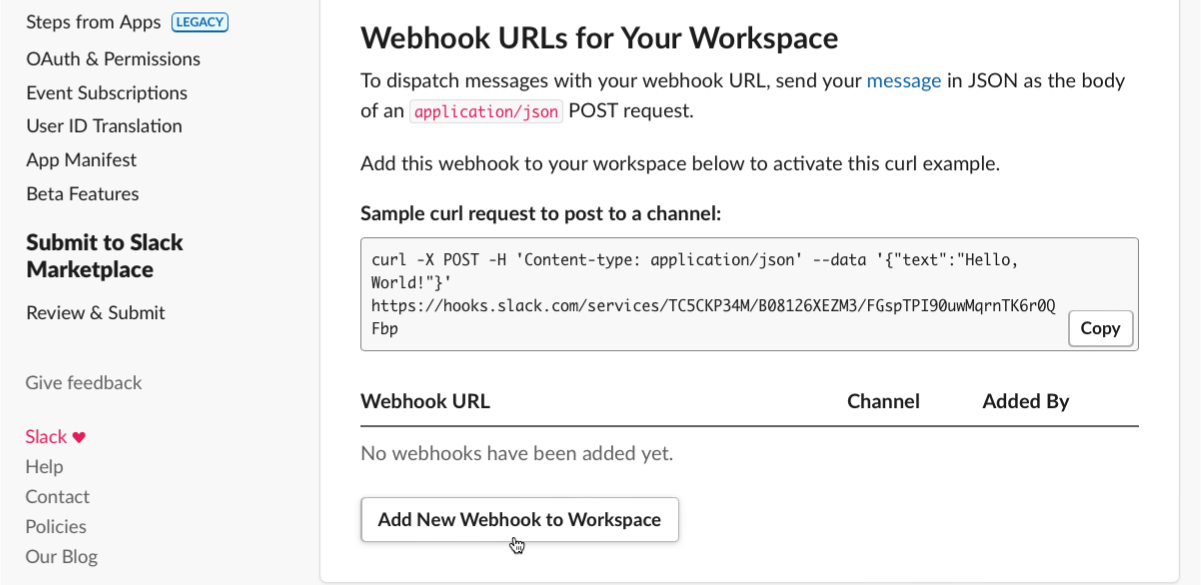
Create a new webhook endpoint by adding the new webhook to your Slack
workspace.
Getting the new webhook by clicking the Add New Webhook to Workspace button.
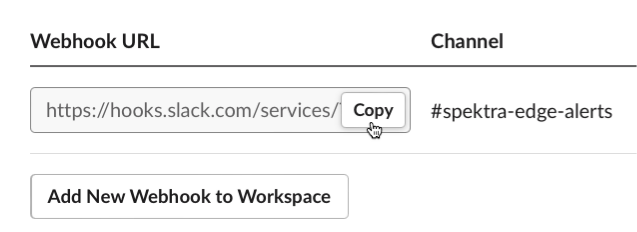
Copy the webhook URL by clicking the Copy button of the newly created
webhook URL.
Copying the webhook URL for the newly created webhook URL.
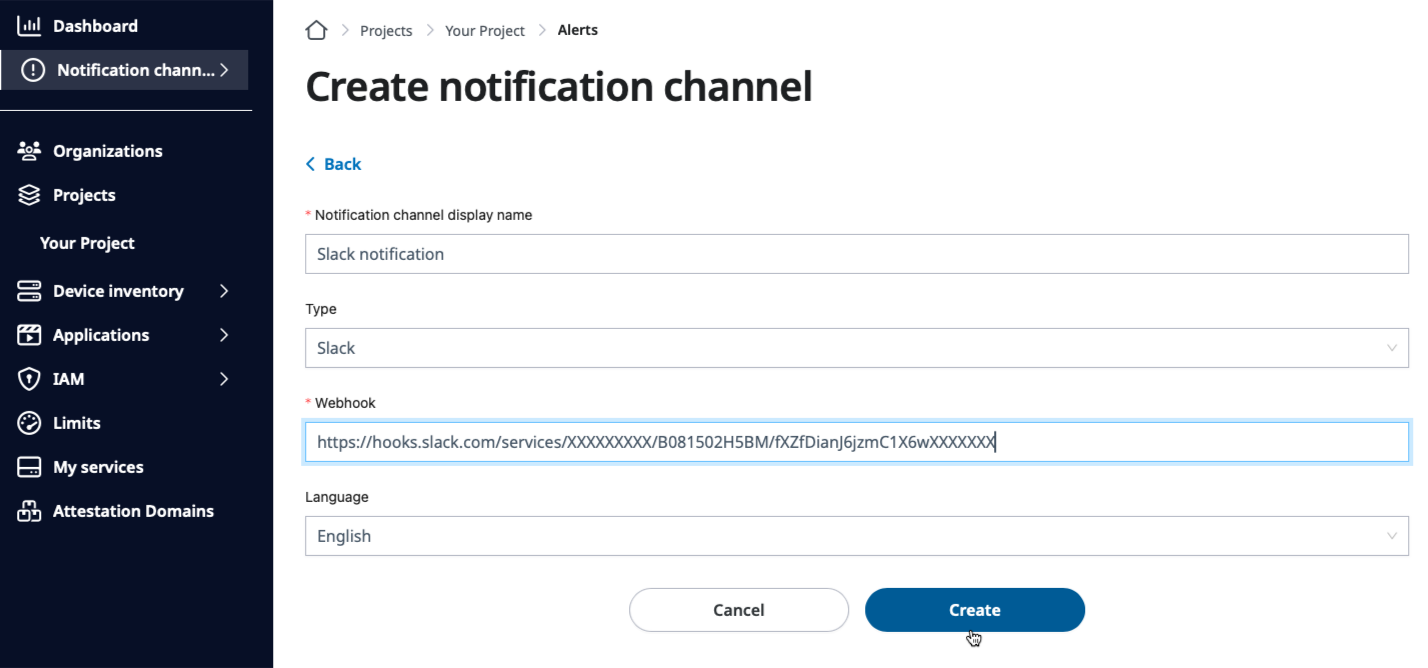
Now, go back to the SPEKTRA Edge dashboard and set the webhook URL you just copied
on the Create notification channel page after selecting the notification type to
Slack.
Paste the webhook URL you copied above and click Create on the Create notification channel page.
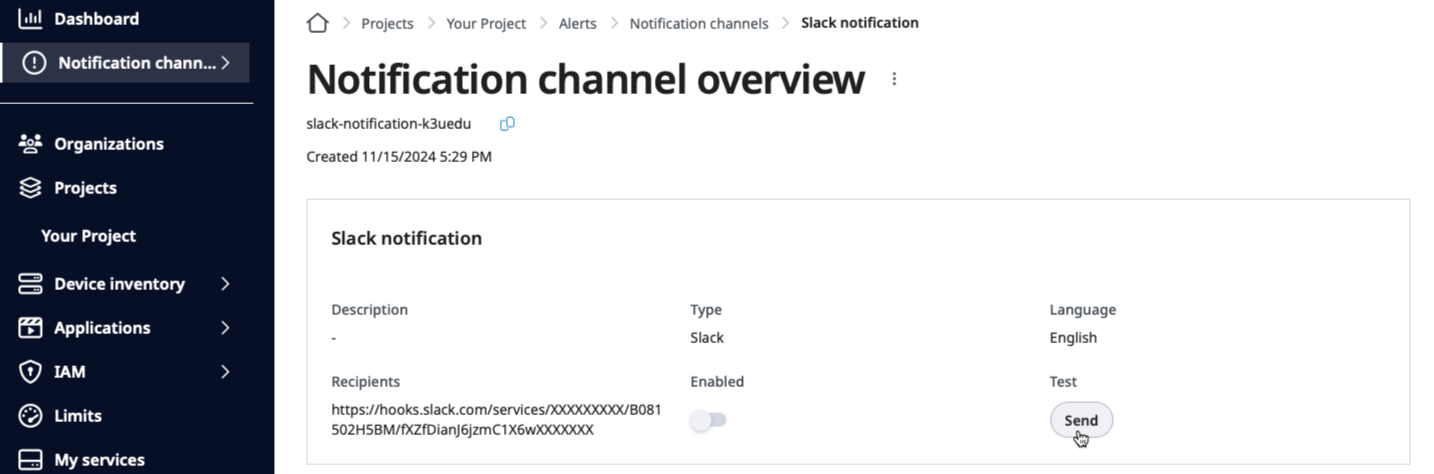
Once the slack notification channel is created, let’s verify it by sending the
test slack notification.
Go to the Notification channel overview page and click the Send button
to send the test Slack notification.
Clicking the Send button to send the test slack notification.
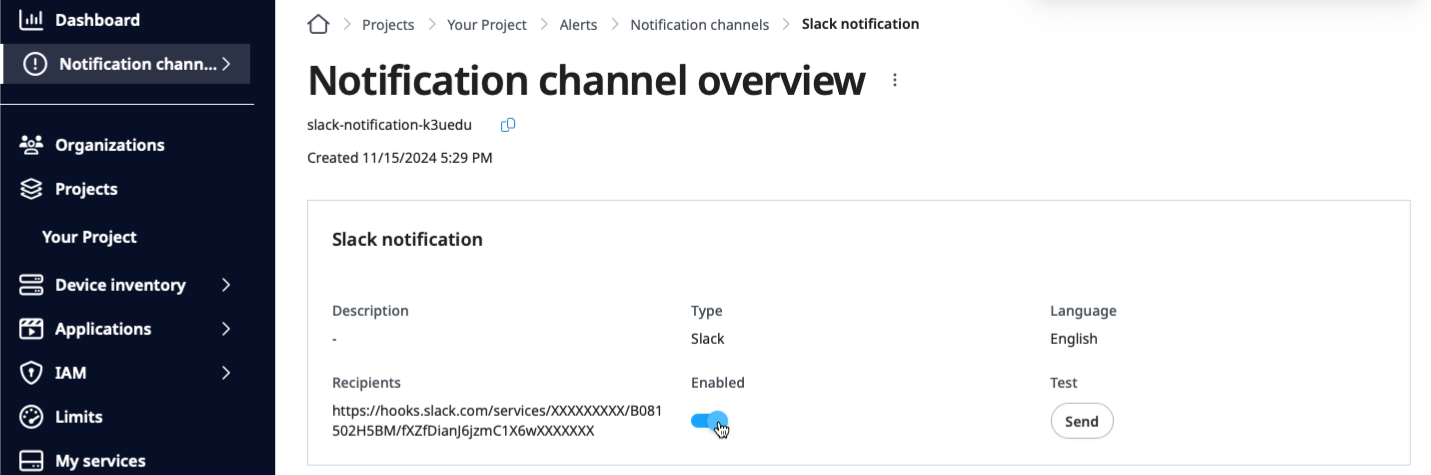
Enable the notification channel by clicking the Enabled switch once
you verify receiving the test Slack notification from SPEKTRA Edge.
Enabling the slack notification channel.
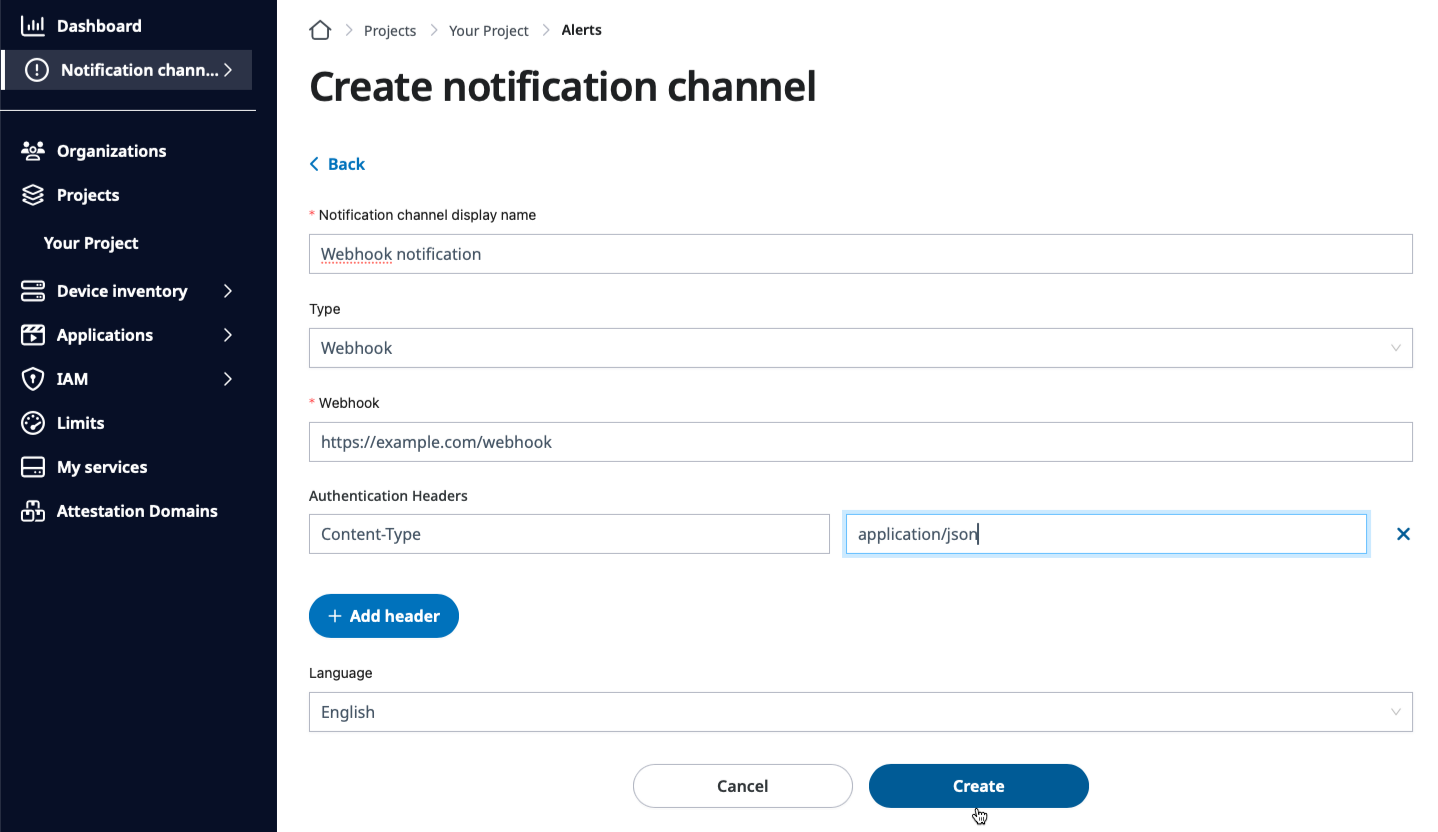
To create the webhook notification channel, you need to
select Webhook in the type field
provide the webhook endpoint in the Webhook field
add the Content-Type: application/json header in the Add headers field
and click the Create button.
Fill in the webhook endpoint and click the Create button.
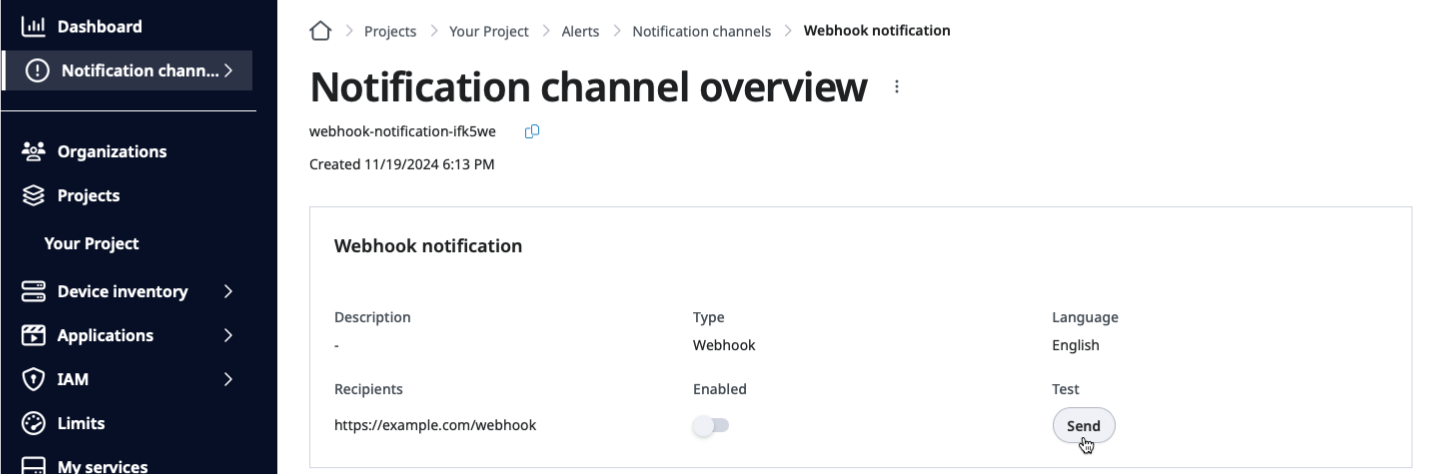
Click the Send button to send the test webhook notification to verify the
configuration.
Clicking the Send button to send the test webhook notification.
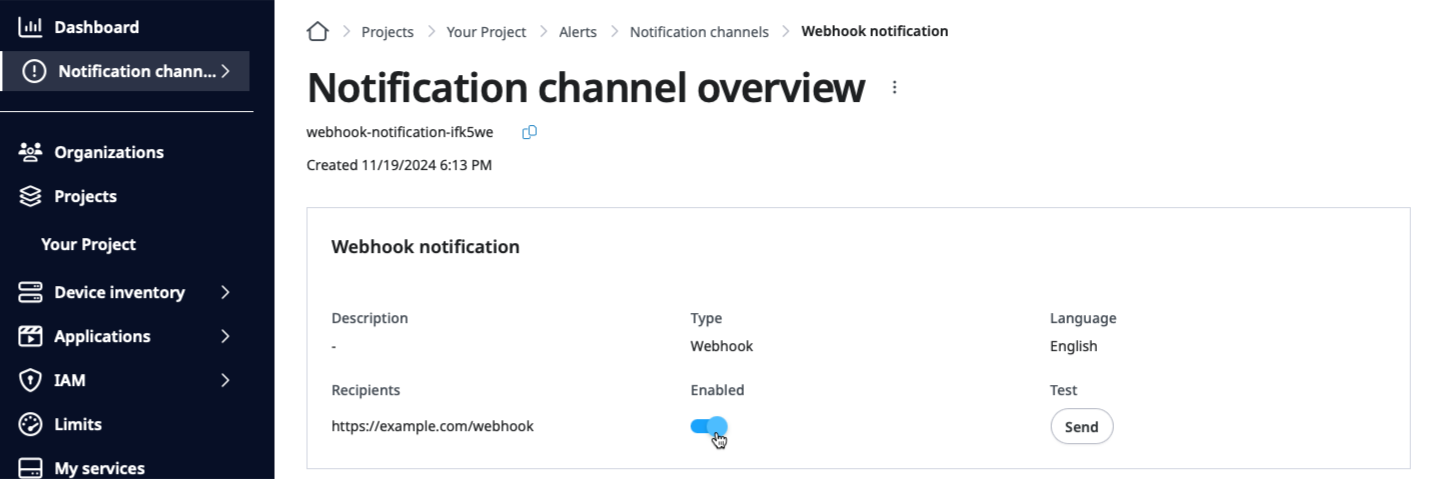
Enable the notification channel by clicking the Enabled switch once
you verify receiving the test webhook notification from SPEKTRA Edge.
Enabling the webhook notification channel.
Here is the sample alert JSON data sent over to the webhook endpoint for
the device connection status alerting condition.
With all those three components configured, We’re ready to enable the alerting
policy to monitor the device connection status for all the devices under the
project.
Go to the Alerting overview page by selecting the Alerting policies option
of the Alerts pulldown menu.
Selecting the Alerting policies option from the Alerts pull down menu.
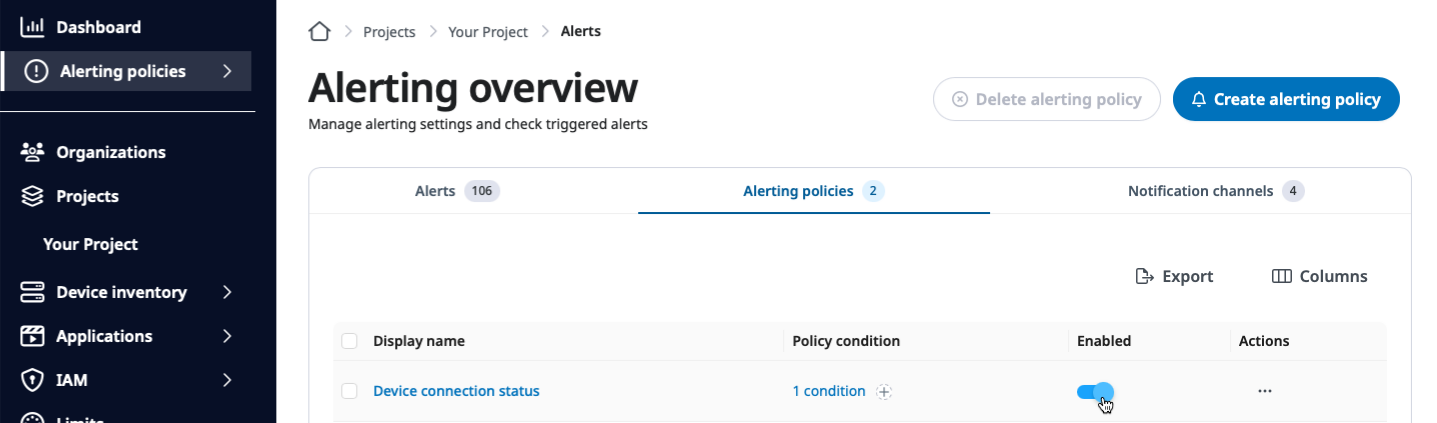
Enable the alerting policy by sliding the Enabled switch to be on for
the Alerting policy you created named Device connection status.
Enabling the alerting policy by sliding the Enabled switch.
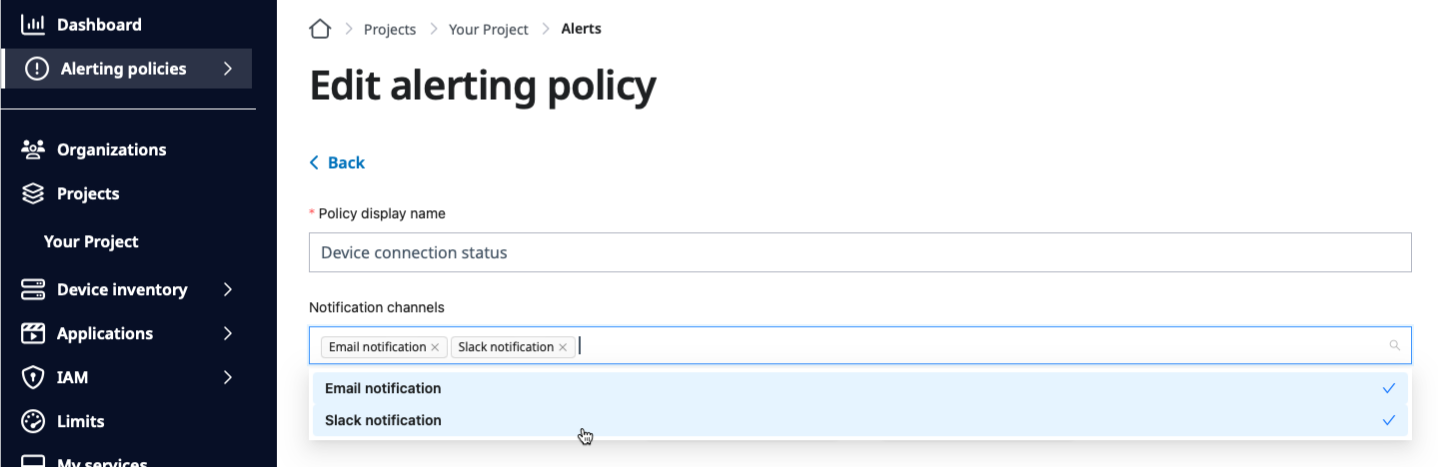
And also, let’s link the notification channels to the alerting policy so that we
get notified whenever alerting status changes. Select the Edit details option
of the alerting policy menu and provide the notification channels in the Notification
channels field.
Great!
You’ve configured the alerting policy to detect the device offline status
on SPEKTRA Edge.
Let’s simulating the offline connection status and observe what kind of
information you can get from the SPEKTRA Edge alerting system.
Monitor alerts
Let’s pull the cable from one of your devices and see how the alert looks like.
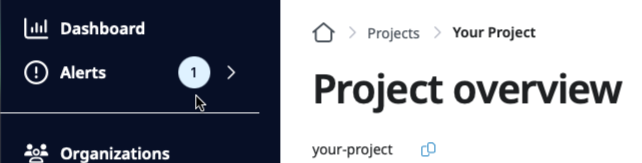
After waiting for five minutes, you should be able to see the alert raised on the
sidebar of the dashboard page.
The circle alert number right next to the Alerts section of the sidebar.
Why five minutes?
The SPEKTRA Edge alerting system triggers alerts when the condition is true
for the specified duration of time. Since we configured the alerting condition
with five minutes duration time, you need to wait for roughly five minutes after
pulling the cable.
Set the shorter duration time and you will see the alert happens much quicker.
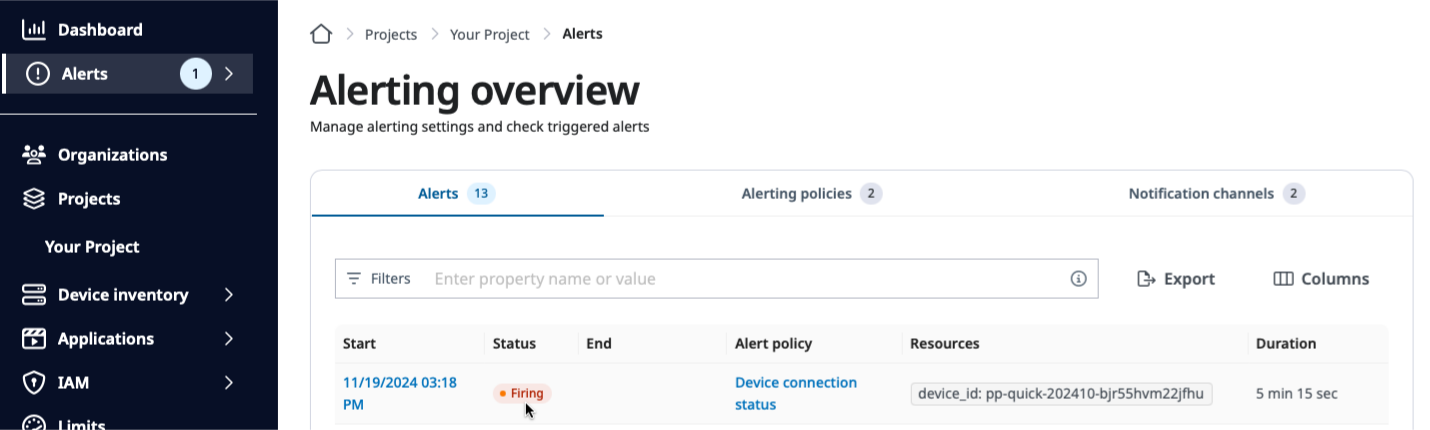
Go to the Alerts page by selecting the Alerts option of the Alerts pull-down
menu. You will see the Fireing alert of the Device connection status
alerting policy with the on-going alert duration and the device information.
The Fireing alert on the Alerting overview page.
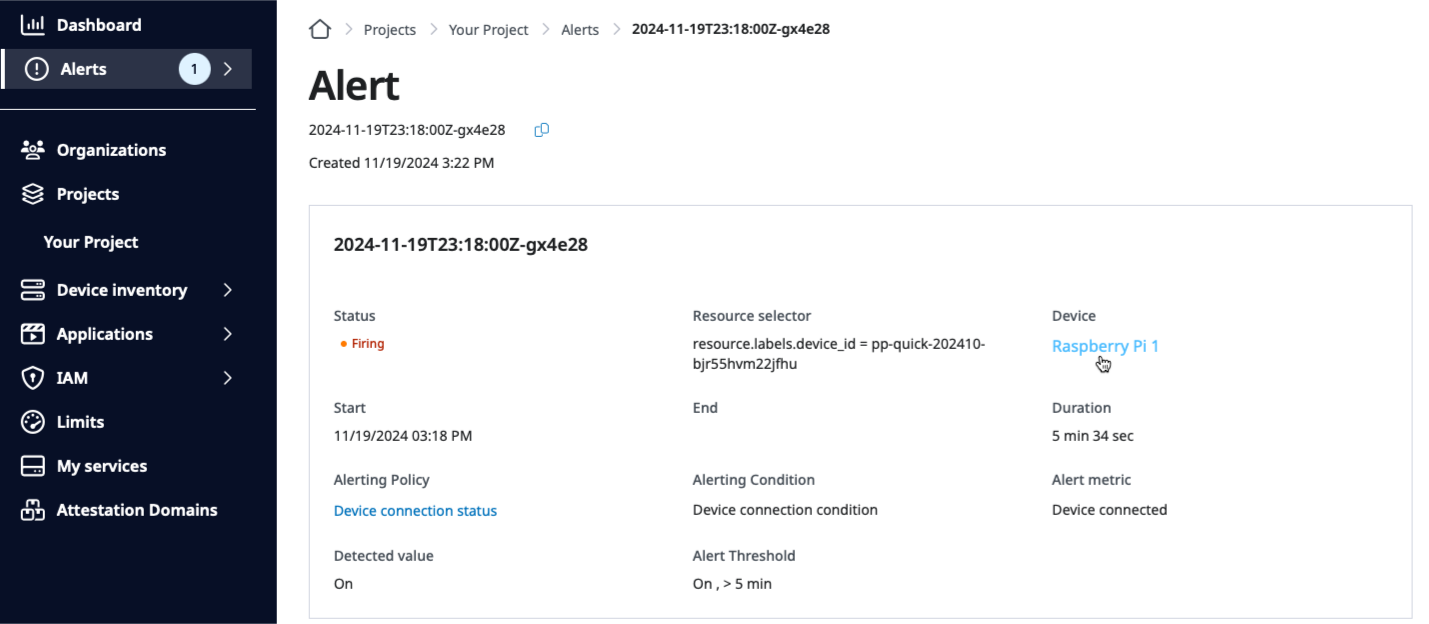
Click the start time of the firing alert and get the detailed information of the
alert. You can observe much more information of the alert firing including the
link to the Device overview page of the device without the connection.
Deivce information of the alert firing on.
Example: CPU utilization alerting condition
Before wrapping up, let’s take a look at another example to understand
how to configure alerting condition on SPEKTRA Edge.
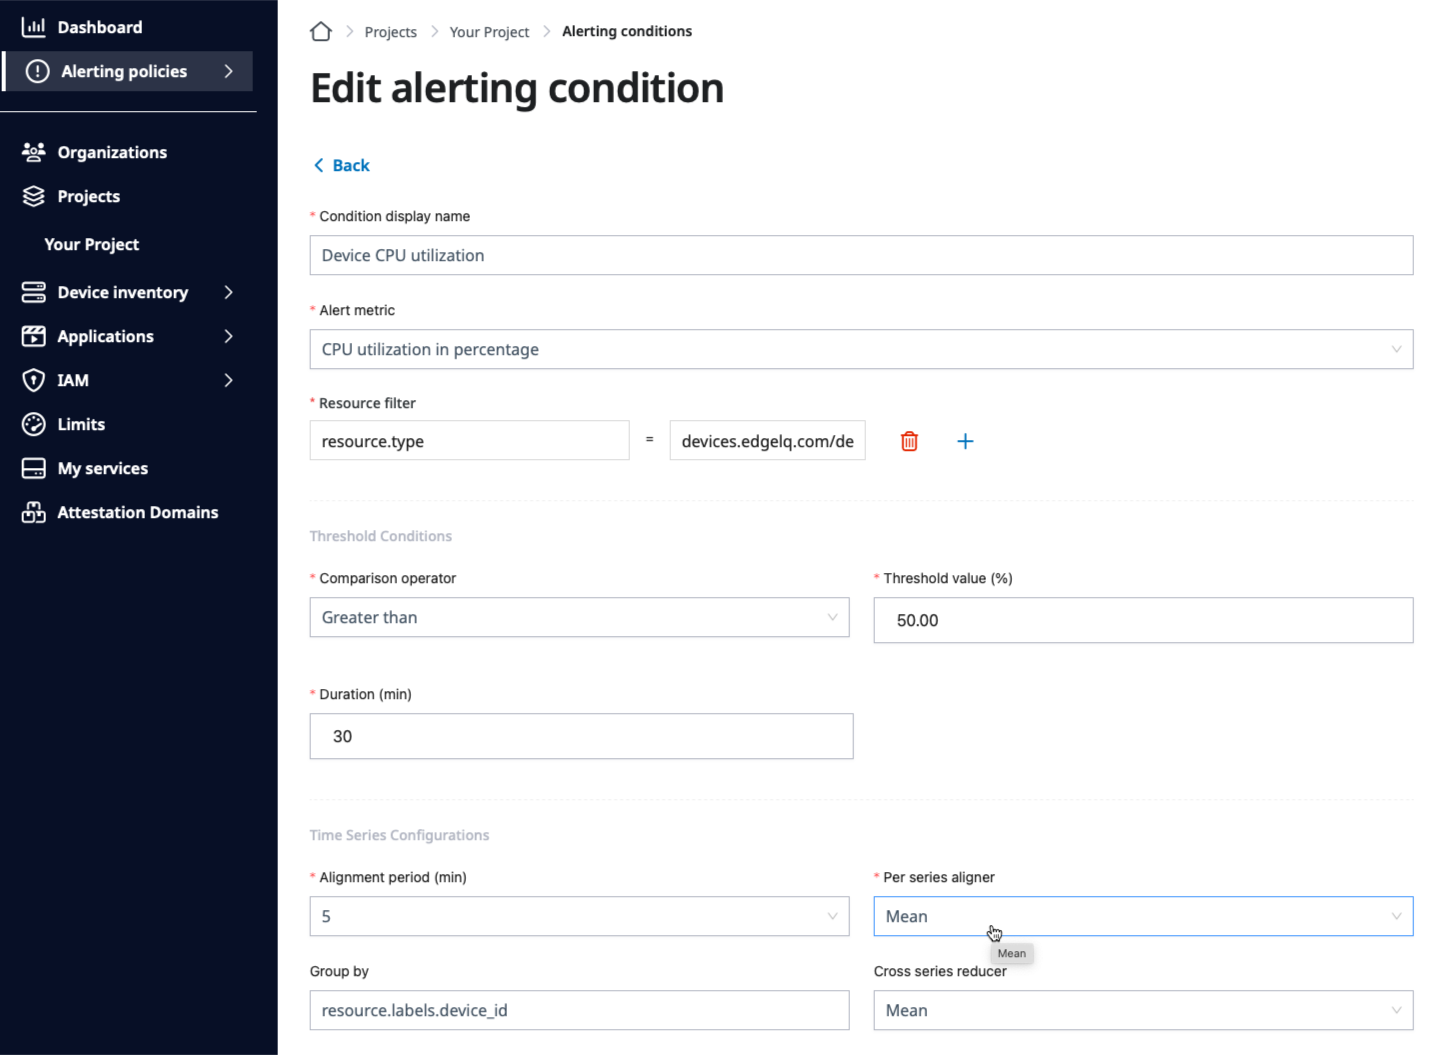
Here is the CPU utilization alerting condition, which triggers alert whenever
the average CPU utilization is more than 50% for half an hour.
The CPU Utilization alerting condition example for your reference.
Here is some of the highlight:
Threshold condition
Greater than is used as the comparison operator
50% as the threshold value
30 minutes as the duration time
Time series configuration
five minutesalignment period with Meanper-series aligner
Group bydevice_id with Meancross-series reducer
Here is the summary of the time series configuration parameters.
using the Meanper-series aligner to get the average of the CPU utilization
of the five munites time period
using the Meancross-series reducer to get the average of the multiple
CPU time series to be treated as the devices CPU utilization data point
With those two aggregations, the system compares the aggregated data point to compare
to the threshold condition, more than 50%, and raises an alert when it’s true for
more than the duration time, 30 minutes.
Next step
Congratulations for creating and monitoring alerts on SPEKTRA Edge. It’s a little
long explanation but we hope you understand the insight of the SPEKTRA Edge alerting
system as well as be ready to create your own alerting policies and conditions.
Let’s learn which metrics you can alert on with SPEKTRA Edge, and how to use
them to keep an eye on remote devices without checking them by hand.
The Manage alerts page shows you how to build an alerting policy,
using the Device connected metric as the example. This page focuses on the
opposite question: which metric should you pick, and what each one is good
for. Use it as a catalog when you create your own alerting conditions.
Where these metrics appear
When you create an alerting condition (Alerts → Alerting policies →
[your policy] → Create condition), the Alert metric field lists the
metrics available for the selected resource type (Device or Pod). The
metrics below are the ones you will find there.
Why alert on more than “Device connected”
A device can stay connected and still be in trouble: a disk fills up, the
CPU is pinned at 100%, a sensor overheats, an application stops responding, or a
cellular link degrades to the point of dropping data. Connection status alone
won’t tell you any of that.
By alerting on resource and health metrics, you get notified of these
conditions before they turn into an outage, so you can act on a device that
may be in a remote, hard-to-reach location.
Device metrics
These metrics describe the health of the device itself (resource type
devices.edgelq.com/device).
Availability
Metric
What it tells you
Typical condition
Device connected
Whether the device is online (1) or offline (0).
Less than 1 for 5 minutes.
Uptime
How long the device has been running since its last boot.
A sudden drop signals an unexpected reboot.
A low Uptime value (for example, uptime resetting to near zero) is a good
way to catch devices that are rebooting unexpectedly, even when they reconnect
quickly enough that the connection alert never fires.
Compute
Metric
What it tells you
Typical condition
CPU utilization
Percentage of CPU in use.
Greater than 80% for 30 minutes.
CPU load (1m)
1-minute load average.
Greater than the device’s core count for a sustained period.
Sustained high CPU is the classic sign of a runaway process or an application
consuming more than expected. Use a duration (for example, 30 minutes) so that
short, legitimate spikes don’t trigger noise.
Memory
Metric
What it tells you
Typical condition
Memory utilization
Percentage of RAM in use.
Greater than 90% for 15 minutes.
Memory used
Bytes of RAM in use.
Useful when you care about absolute headroom.
High memory utilization warns you before the device starts killing processes
under memory pressure.
Storage
Metric
What it tells you
Typical condition
Disk utilization
Percentage of disk space in use, per mount point.
Greater than 85%.
Disk used
Bytes of disk space in use.
Useful for absolute thresholds.
A full disk is one of the most common causes of failed application deployments
and stalled log forwarding. Alert early (for example, at 85%) to leave time to
clean up. The disk metrics are reported per mount point, so you can tell
whether it’s the system area, the data area, or an additional partition that is
filling up.
Hardware sensors
Metric
What it tells you
Typical condition
Hardware temperature
Temperature readings in °C, per chip/sensor.
Greater than a safe limit for the hardware.
Fan speed
Cooling fan RPM readings.
A drop toward zero can indicate a failing fan.
Voltage
Voltage rail readings.
Out-of-range values indicate power problems.
Power
Power consumption readings.
Unusual draw can indicate a hardware fault.
Thermal alerts are especially valuable for fanless or enclosed devices deployed
in environments where ambient temperature isn’t controlled.
Network interfaces
Metric
What it tells you
Typical condition
Bytes received / sent
Throughput per interface.
A drop to zero can mean a link is down; a spike can mean unexpected traffic.
Packets received / sent
Packet rate per interface.
Same as above, at packet granularity.
Incoming / outgoing drops
Dropped or errored packets per interface.
Greater than 0 over an interval signals a degraded link.
These are grouped per interface, so you can monitor a specific uplink (for
example, the wired interface) independently from others.
Cellular signal
For devices with a cellular modem, these metrics help you catch a connection
that is slowly degrading before it fails.
Metric
What it tells you
Typical condition
Modem RSSI
Received signal strength.
Less than a weak-signal threshold.
Modem RSRP
Reference signal received power.
Less than a weak-signal threshold.
Modem RSRQ
Reference signal received quality.
Less than a weak-signal threshold.
Modem SNR
Signal-to-noise ratio.
Less than a poor-quality threshold.
A device on a weakening cellular link may still report connected, but
alerting on signal quality lets you schedule maintenance (for example,
repositioning an antenna) before it goes offline.
Health checks
If you configure host-level health checks on a device, their results are also
available as metrics.
Metric
What it tells you
Typical condition
Health check status
Result of each configured check (1 healthy, 0 unhealthy).
Less than 1.
Health check HTTP response time
Response time of HTTP checks.
Greater than an acceptable latency.
Health check network RTT
Round-trip time of ICMP/network checks.
Greater than an acceptable latency.
Health checks let you turn “is this specific service or endpoint reachable from
the device” into an alert.
Application metrics
These metrics describe the applications (pods) running on your devices
(resource type applications.edgelq.com/pod). Select Pod as the
resource type when creating the alerting condition.
Metric
What it tells you
Typical condition
Pod CPU utilization
CPU used by the application.
Greater than an expected ceiling.
Pod memory utilization
Memory used by the application.
Greater than an expected ceiling.
Pod memory used
Absolute memory used by the application.
Useful for absolute thresholds.
Pod health
Whether the application is healthy (1) or not (0).
Less than 1.
Pod health check status
Result of the application’s health checks.
Less than 1.
Pod health check HTTP response time
Response time of the application’s HTTP checks.
Greater than an acceptable latency.
Pod health check network RTT
Round-trip time of the application’s network checks.
Greater than an acceptable latency.
These let you alert on the workload itself — for example, an application that is
unhealthy or consuming far more CPU than usual — rather than only on the device
hosting it.
A recommended starting set
If you’re not sure where to begin, these conditions cover the most common
problems for a fleet of remote devices:
Condition
Metric
Suggested trigger
Device offline
Device connected
Less than 1 for 5 minutes
Disk filling up
Disk utilization
Greater than 85%
Memory pressure
Memory utilization
Greater than 90% for 15 minutes
CPU saturation
CPU utilization
Greater than 80% for 30 minutes
Overheating
Hardware temperature
Greater than the hardware’s safe limit
Application down
Pod health
Less than 1
Tips for fleet-wide alerts
Group by device. In the time series configuration, group by
resource.labels.device_id so each device is evaluated independently and a
single policy covers your whole fleet. See the
time series configuration section on the alerts page for details
on aligners and reducers.
Use a duration. Requiring a condition to hold for a few minutes filters
out transient spikes and keeps notifications meaningful.
Attach notification channels. Connect Slack, email, or a webhook so
alerts reach you wherever you work. See notification channels.
Let the platform tune thresholds for you. If picking exact thresholds is
hard, consider AI Alerting, which adds anomaly detection and
adaptive thresholds on top of these same metrics.
Next step
Now that you know what to monitor, learn how the platform can investigate and
even remediate alerts for you with AI Alerting.
6 -
AI Alerting
Let’s learn how to use AI Alerting on SPEKTRA Edge to detect problems
without hand-tuned thresholds, and to have an AI agent investigate and remediate
alerts for you.
Managing remote devices means you can’t watch every dashboard all the time.
AI Alerting is designed for exactly this: it notices unusual behavior on its
own, figures out what is likely wrong, and either fixes it or escalates to a
human with a written explanation.
This page has two parts:
Concepts — what AI
Alerting is, its architecture, and how a fired alert is handled end to end.
Read this first to build a mental model.
Setup — a hands-on walkthrough
that builds one policy, field by field. Our example detects abnormal CPU
behavior on devices and lets the AI agent restart the offending pod after
your approval.
Concepts: what AI Alerting is and how it works
This part explains the moving pieces and how they fit together. No
configuration yet — that’s Setup.
AI Alerting vs. Alerts
SPEKTRA Edge has two complementary alerting areas in the dashboard sidebar:
Area
Best for
Alerts
Classic threshold alerts. You pick a metric and a fixed threshold (for example, CPU > 80%). See Manage alerts and Alert metrics.
AI Alerting
Anomaly and adaptive-threshold detection, plus an optional AI agent that investigates and remediates fired alerts.
This page covers AI Alerting. You’ll find it under the AI Alerting
entry in the sidebar (the AI Alerting overview page).
Architecture and end-to-end flow
AI Alerting reuses the same building blocks as classic Alerts — an
alerting policy that groups conditions and notification channels —
and adds two things on top:
Smarter conditions. In addition to fixed thresholds, a condition can use
adaptive thresholds or anomaly detection. These are two different
things — see Adaptive thresholds vs. anomaly detection below.
An AI agent that handles fired alerts. When an alert fires, the agent
investigates, decides what is going on, and takes an action — see
How the AI agent handles alerts below.
Putting those together, this is the end-to-end flow. However the alert is
triggered — a fixed threshold, an adaptive threshold, or an anomaly detector —
it enters the same AI handling pipeline: the agent gathers context (including
your supporting docs and queries), decides what is going on, and then the outcome
flows into whatever you configured — a notification, an automatic or approved
remediation, or an escalation to a human.
flowchart TD
    %% --- Detection ---
    FT["Fixed threshold"]
    AT["Adaptive threshold"]
    AD["Anomaly detection"]
    FT --> FIRE
    AT --> FIRE
    AD --> FIRE
    FIRE(["Alert fires<br/>(after 'Raise after')"])

    %% --- Investigation ---
    FIRE --> INV["AI agent investigates"]
    LIVE["Metrics, logs,<br/>resource state"] --> INV
    DOCS["Supporting docs"] --> INV
    SQ["Supporting queries"] --> INV
    SSH["Read-only checks over SSH<br/>(if connectivity enabled)"] --> INV

    %% --- Decision ---
    INV --> DEC{"AI agent decides"}
    DEC -->|"transient blip"| IGN["Ignore"]
    DEC -->|"over-sensitive"| ADJ["Adjust condition"]
    DEC -->|"fixable"| REM["Remediation:<br/>Fix in SSH or Reboot"]
    DEC -->|"cannot resolve"| ESC["Escalate to operator"]

    %% --- Remediation approval gate ---
    REM --> AA{"Auto-accept<br/>enabled?"}
    AA -->|"no"| WAIT["Await operator approval"]
    AA -->|"yes"| APP["Apply automatically"]
    WAIT -->|"approved"| APP
    APP --> RECHECK{"Still firing?"}
    RECHECK -->|"yes"| ESC

    %% --- Outcomes notify channels ---
    IGN --> NOT
    ADJ --> NOT
    APP --> NOT
    ESC --> NOT
    NOT[["Notify channels:<br/>Slack / email / webhook"]]
Adaptive thresholds vs. anomaly detection
Both go beyond a fixed threshold, but they answer different questions.
Adaptive thresholds are still thresholds — an upper and/or lower bound.
The only difference from a fixed threshold is that the platform computes the
bound for you from recent history (by default, the last week) instead of you
typing a fixed number. It looks at the range the metric actually reached, adds
some buffer, and alerts when the value crosses that band. The question it
answers is “is the value too high or too low right now?” — it just keeps the
“too high / too low” line up to date as the device’s normal level drifts.
Anomaly detection is a learned model of behavior, not a bound. A small
AI model (an LSTM autoencoder) is trained on the metric’s history and learns its
normal shape over time — including how it rises and falls through the day. It
then flags readings that don’t match that learned pattern. The question it
answers is “does this look like how this device normally behaves?” — so it can
catch a value that is unusual even though it never leaves the normal band
(for example, CPU sitting flat at 40% overnight when it normally idles near 5%).
Adaptive threshold
Anomaly detection
What it is
An auto-maintained upper/lower bound
An AI model of normal behavior over time
Detects
Value crossing a band
Deviation from the learned pattern (shape, timing)
How the “normal” is set
Historic min/max range + buffer
Model trained over a training period
Catches in-range oddities?
No — only out-of-band values
Yes — unusual patterns even within the band
Setup input
Auto-adapt upper/lower (+ optional guard rails)
Analysis window + training period
Cost / lead time
Cheap, available quickly
Needs a training period (at least a day) before it detects
They also complement each other: while an anomaly detector is still training
(or if it isn’t defined), the adaptive thresholds keep watch, so you have
coverage from day one and sharper detection once the model is ready. A common
setup is to enable adaptive thresholds and one or more anomaly detectors on the
same condition.
How the AI agent handles alerts
When an alert fires — from any of the detection methods above — the AI agent runs
a short loop: investigate → decide → act.
What the agent looks at
To diagnose an alert, the agent pulls together several sources of context:
Live signals — the device’s metrics, logs, and resource state around the
time of the alert.
Supporting queries — predefined metric, log, or resource lookups attached
to the policy. They run automatically when an alert fires and their results
are handed to the agent, so it always starts with the data you consider
relevant (see Add supporting queries).
Supporting documents — natural-language references the agent reads while
diagnosing (see the next section).
Read-only device checks — only if you enabled agent connectivity, the
agent may run safe, read-only commands on the device over the secure SSH
tunnel.
How supporting documents are used
Supporting documents are natural-language references — runbooks, operational
notes, known-issue write-ups — that you attach to a policy or condition. The
agent reads them as context while diagnosing an alert; they are not code and
they don’t run. They shape the agent’s understanding and its decision.
For example, a short runbook that says:
If the processor service spikes CPU right after a config push, it’s a known
issue — restarting the pod is safe and resolves it.
lets the agent recognize the situation, explain it in its diagnosis, and
confidently choose the Reboot remediation instead of escalating. Without
that note, the same symptom might be escalated to a human because the agent has
no way to know the restart is safe.
Good supporting documents are specific and action-oriented: they describe a
symptom, what it usually means, and what a safe response is. They’re the main
way you transfer your team’s operational knowledge to the agent. You attach them
during setup (see Attach supporting documents).
What the agent decides and does
After investigating, the agent chooses one outcome:
Ignore — the cause looks transient and harmless.
Adjust — the condition was too sensitive; the platform retunes it.
Remediate — apply a Fix in SSH command or Reboot the affected
pod. If auto-accept is off, the agent only proposes the fix and waits
for an operator to approve it; if it’s on, the fix is applied automatically.
If a remediation is applied and the alert keeps firing, the agent escalates.
Escalate — it can’t resolve the issue and hands off to a human.
Every step is recorded as an AI diagnosis note on the alert, so you can read
how the agent reached its conclusion.
Guardrails: keeping the agent safe
A few guardrails are built in and worth knowing:
The agent only connects to a device when you enable agent connectivity;
otherwise it works from collected metrics and logs alone.
You can restrict which command-line tools the agent may use during
investigation, limiting it to a known-safe set.
Remediations are limited to the kinds you allow (Fix in SSH and/or
Reboot), and — unless you enable auto-accept — require your approval before
anything runs.
Setup: create and configure a policy
Now the hands-on part. We’ll build the CPU example from the top of the page:
detect abnormal device CPU, and let the agent restart the offending pod after
your approval.
Go to AI Alerting → Policies in the sidebar to open the AI Alerting
overview page, then click Create policy in the top-right corner.
The Create policy page is a single form. We’ll walk through it top to bottom.
1. Choose a template and name the policy
Template — start from a predefined set of conditions (for example, a base
device or pod template). Templates come with sensible conditions already
filled in, which you can tune later. For our example, pick a device template.
Note that the template cannot be changed after the policy is created.
Display name — a human-readable name, for example Device CPU anomaly.
Description — optional free text describing what the policy is for.
2. Attach supporting documents and notification channels
Supporting docs — attach the runbooks or notes the agent should read while
diagnosing an alert (this is the feature described in
How supporting documents are used). It’s
optional but makes the agent noticeably better.
Notification channels — select the same Slack, email, or webhook
notification channels you use elsewhere. You can leave this empty
and add channels later.
3. Enable the AI agent and pick remediations
This is the heart of AI Alerting. Turn on AI agent enabled to switch on
AI-powered analysis and remediation for alerts raised by this policy. Two more
controls appear once it is on:
Setting
What it does
AI agent enabled
Turns on AI-powered analysis and remediation for alerts raised by this policy.
Enable agent connectivity
Lets the agent connect to the device (over the platform’s secure SSH tunnel) to investigate beyond the collected metrics and logs.
Enable auto accept AI agent remediation
Applies the agent’s proposed fix automatically, without waiting for a person to approve it (fully autonomous mode).
Remediations
The kinds of fixes the agent may perform: Fix in SSH (run a remediation command on the device — requires agent connectivity) and/or Reboot (restart the affected pod — requires the policy to identify a pod).
For our example, enable the AI agent, enable connectivity, leave auto-accept
off, and select both Fix in SSH and Reboot as allowed remediations.
Start with a human in the loop
Leave auto accept off at first. The agent will then propose a remediation
and wait for your approval, so you can review what it intends to do before
anything changes on the device. Turn on auto-accept only once you trust the
policy’s behavior.
4. Set the processing location and resource
Remediations and Processing location sit side by side on the form.
For Processing location, choose Backend (in the cloud) or Edge (on
the device itself). Edge processing keeps detection working locally even when
connectivity to the cloud is intermittent; Backend is the right choice for
metrics that only make sense centrally (such as connectivity). This field
cannot be changed after creation. For our anomaly-detection example, keep it
on Backend — on-device anomaly detection is coming soon, but today anomaly
models run in the backend (adaptive and fixed thresholds work in either
location).
Resource — the resource type this policy monitors, for example Device
or Pod. The Reboot remediation is only available when the policy can
identify a pod.
5. (Optional) Add supporting queries
Supporting queries are the predefined lookups described in
What the agent looks at. They are gathered
automatically and handed to the agent as context whenever an alert fires. Click
Add query and choose a Type:
Time series query — a metric lookup with a filter and aggregation
(alignment period, per-series aligner, cross-series reducer, group-by fields).
Log query — a log lookup with a filter.
REST get / REST list query — fetch a resource (or a list of resources)
from a SPEKTRA Edge service, using an endpoint, path, view, and field mask.
Filters use templates, so you can reference the alert’s labels with
<label_key> placeholders (for example resource.labels.device_id="<device_id>").
The built-in <project_id> and <region_id> placeholders are always available.
When the form is complete, click Create to save the policy.
Add conditions
A policy without conditions never fires. Open your new policy from the
AI Alerting overview page and add a time series condition (the template you
picked may have already added some, which you can edit or delete).
Each condition defines one or more queries (metric filter + aligner +
reducer) and how they turn into alerts. You can use fixed thresholds, adaptive
thresholds, and anomaly detection — together if you like. For the difference,
see Adaptive thresholds vs. anomaly detection.
Threshold and adaptive thresholds
Set a Threshold to alert when a value crosses a fixed bound. To make that
bound adapt to the device’s own history instead of being a fixed number, turn
on:
Auto adapt upper — the platform maintains the upper bound for you.
Auto adapt lower — the platform maintains the lower bound for you.
With adaptive thresholds you can still set hard guard rails (a maximum upper and
a minimum lower bound) so the adaptive value never becomes too tolerant or too
sensitive. The platform derives the adaptive bound from historic data (by
default the last week) plus a configurable buffer.
Anomaly alerting
Add an entry to the Anomaly alerting list to catch deviations from the
metric’s learned pattern. This trains a small AI model on the metric’s history,
so it needs a training period before it starts detecting. The key fields are:
Analysis window — the sliding window of data the model looks at each time.
Training period — how much history the model learns from before it starts
flagging deviations (at least one day).
A good starting pattern is one wide, coarse detector (a long analysis window
with a larger step) to catch slow drifts, plus one narrow, fine detector to
catch sudden spikes.
Anomaly detection runs in the backend for now
On-device (Edge) anomaly detection is coming soon. Today, anomaly detection
runs in the backend, so keep the policy’s Processing location on
Backend when you use anomaly alerting. Adaptive and fixed thresholds work
regardless.
Raise after / silence after
For both methods you can set:
Raise after (sec) — how long the condition must hold before an alert fires
(noise reduction).
Silence after (sec) — how long after violations stop before the alert
clears.
Save the condition when you’re done.
Enable the policy
Back on the AI Alerting overview page, slide the Enabled switch on for your
policy. Detection (and, once alerts fire, the AI agent) is now live.
Reading alert state
On the AI Alerting overview page, the alerts tables show the handling state:
Open an alert to see the full AI diagnosis, the proposed remediation, and
the controls to Approve a remediation or Acknowledge the alert.
Choosing which events notify you
For AI Alerting you can pick exactly which lifecycle events send a notification
on each channel, including:
New firing — a new alert started.
AI escalated to operator — the agent needs a human.
AI remediation awaiting approval — a fix is proposed and waiting for you.
AI remediation applied / Operator remediation applied — a fix was
applied by the agent or by a person.
Stopped firing — the alert cleared.
Next step
Combine AI Alerting with well-chosen alert metrics for broad
coverage, and route everything through your notification channels so
you hear about remote devices the moment something looks wrong.