SPEKTRA Edge simplifies the application deployment on thousand dispersed
IoT devices across the globe.
We see the application deployment life cycle differently from the
conventional means and re-designed it from the ground up. We combined
the cloud environment management and the container framework in a seamless
and accessible way. With a few simple operations, you can develop, deploy,
and manage applications on your devices from anywhere.
The getting started guide introduces you to the platform
by deploying a Nginx application on your Raspberry Pi device all through
the SPEKTRA Edge dashboard.
After successfully deploying and running the application on your device,
next thing you want to do is to manage ant monitor both your devices and
applications. You can do it through the scalable
SPEKTRA Edge dashboard easily and intuitively.
And also, the cuttle CLI command is necessary to complete this guide,
which is used to access the Nginx application from the local machine for the
verification purpose. However, it is not required for deploying applications
on SPEKTRA Edge.
Create a project
Let’s first create a project, which manages the group of devices. It’s
the one stop shop to deploy and manage your devices and applications in
an unified fashion.
To create your first project, log into your SPEKTRA Edge dashboard and
click Create project on your right.
Create project button on the Projects page.
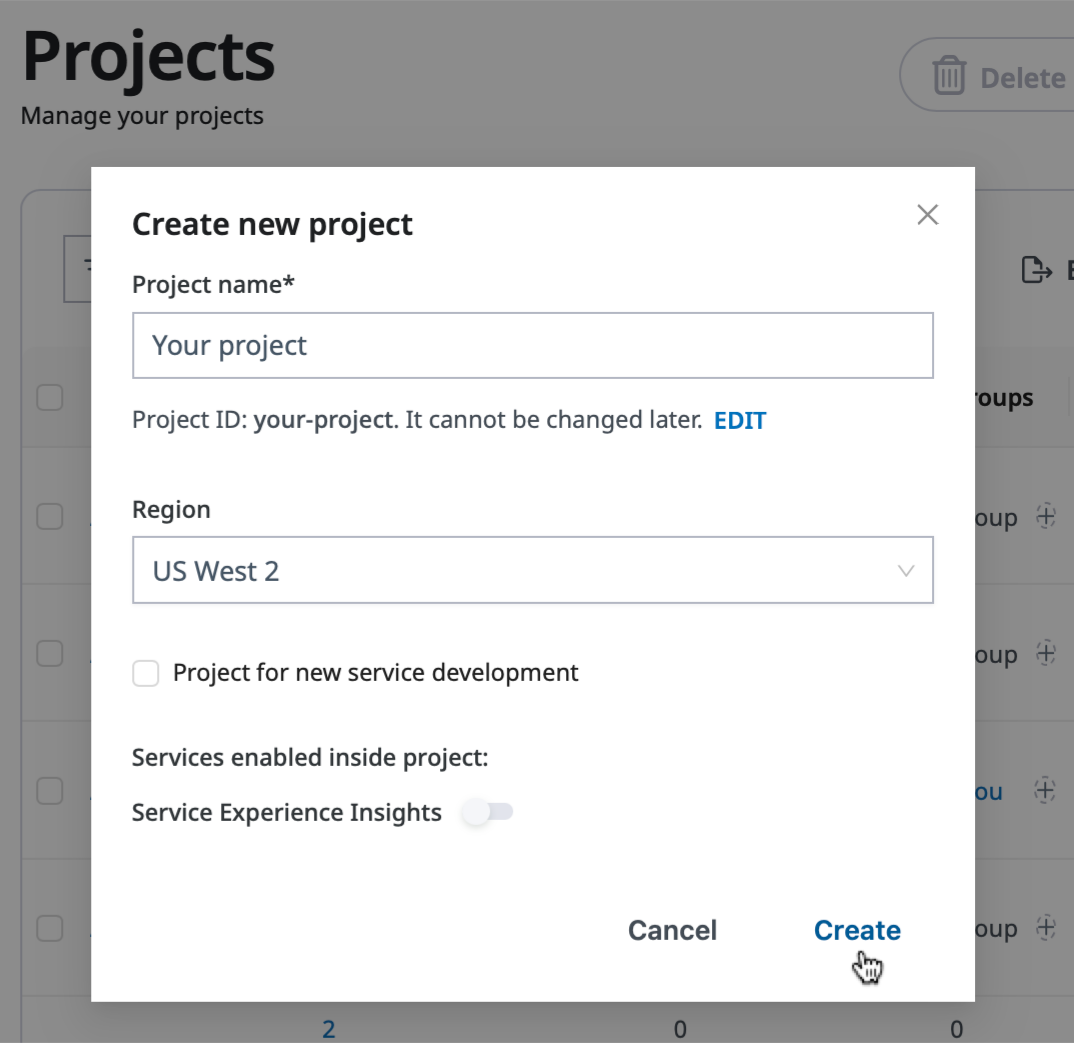
Enter a project name and the region close to your devices, and click
Create:
Create button on the Create new project pane.
You’ll then be redirected to the summary of projects, which you can select
one you just created and add your first Raspberry Pi.
Add a device and download OS
SPEKTRA Edge builds a custom SPEKTRA Edge OS image configured for the
Raspberry Pi device, which allow it to be provisioned for SPEKTRA Edge
platform in the later stage.
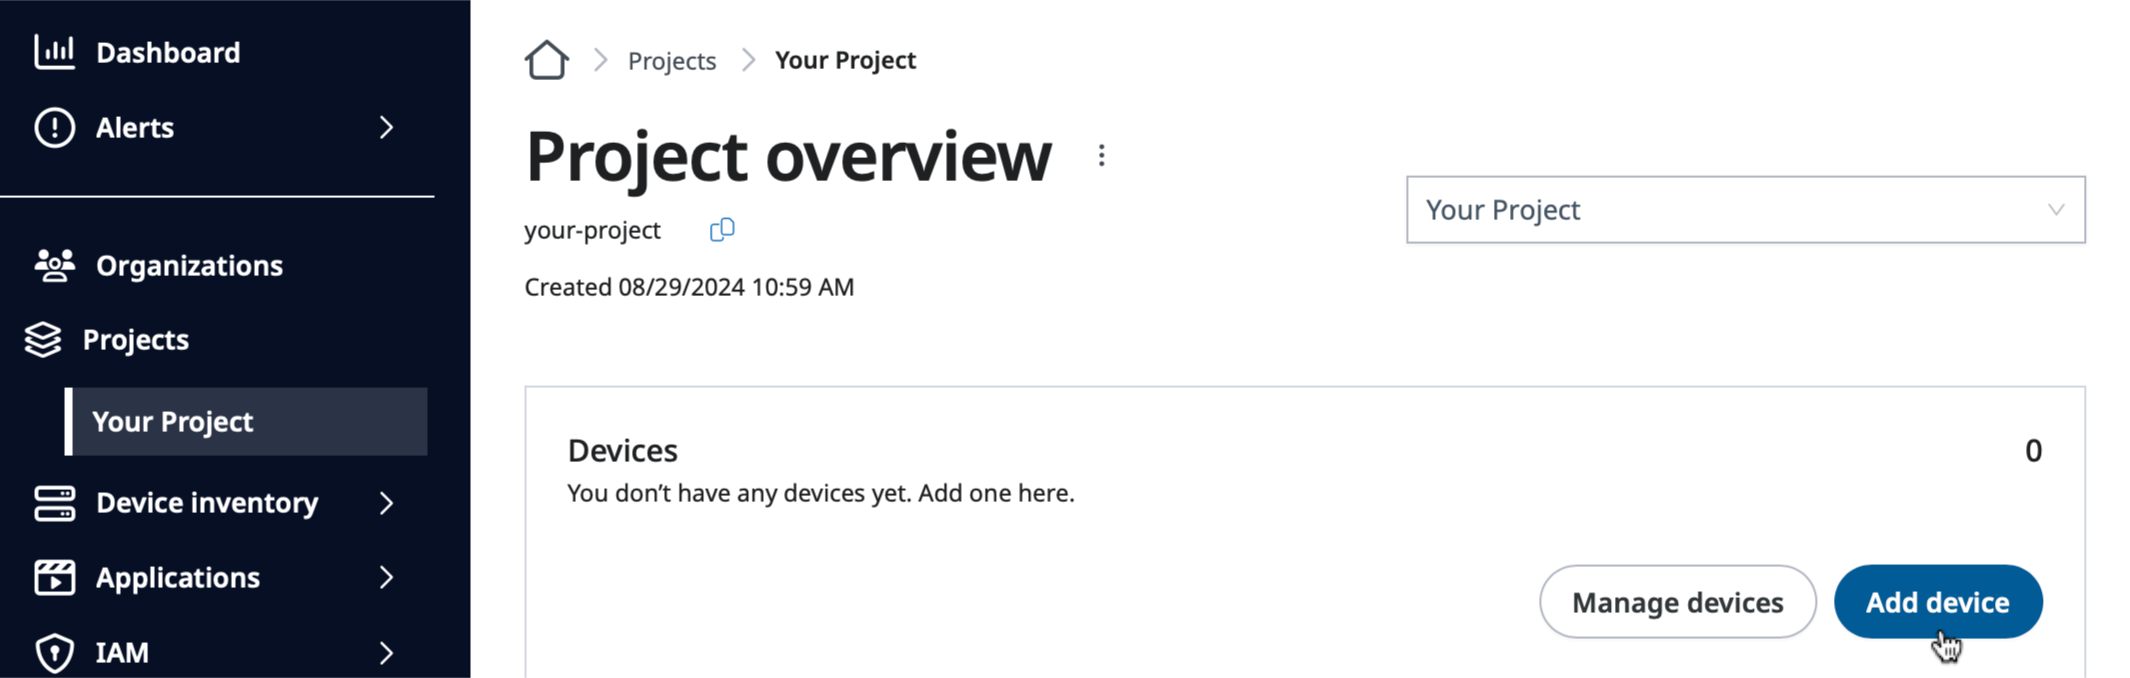
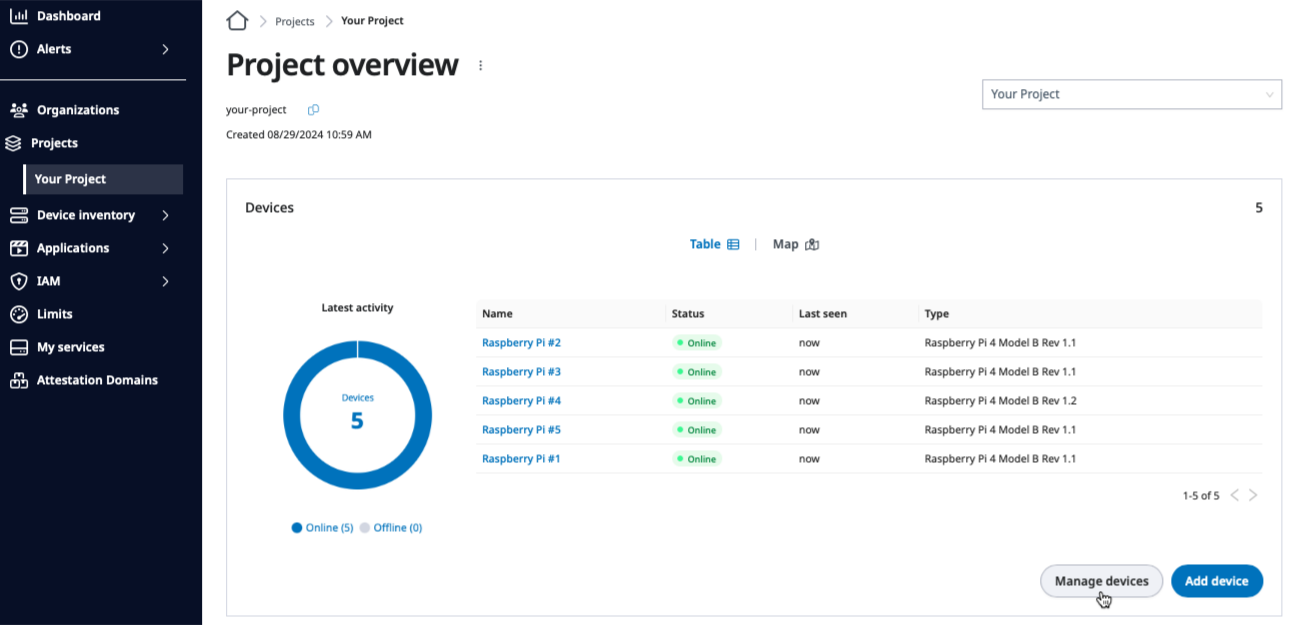
Add device button on the Project overview page.
Start by clicking Add device
on the project overview and select Download bootable OS with default
configuration option under the register devices section.
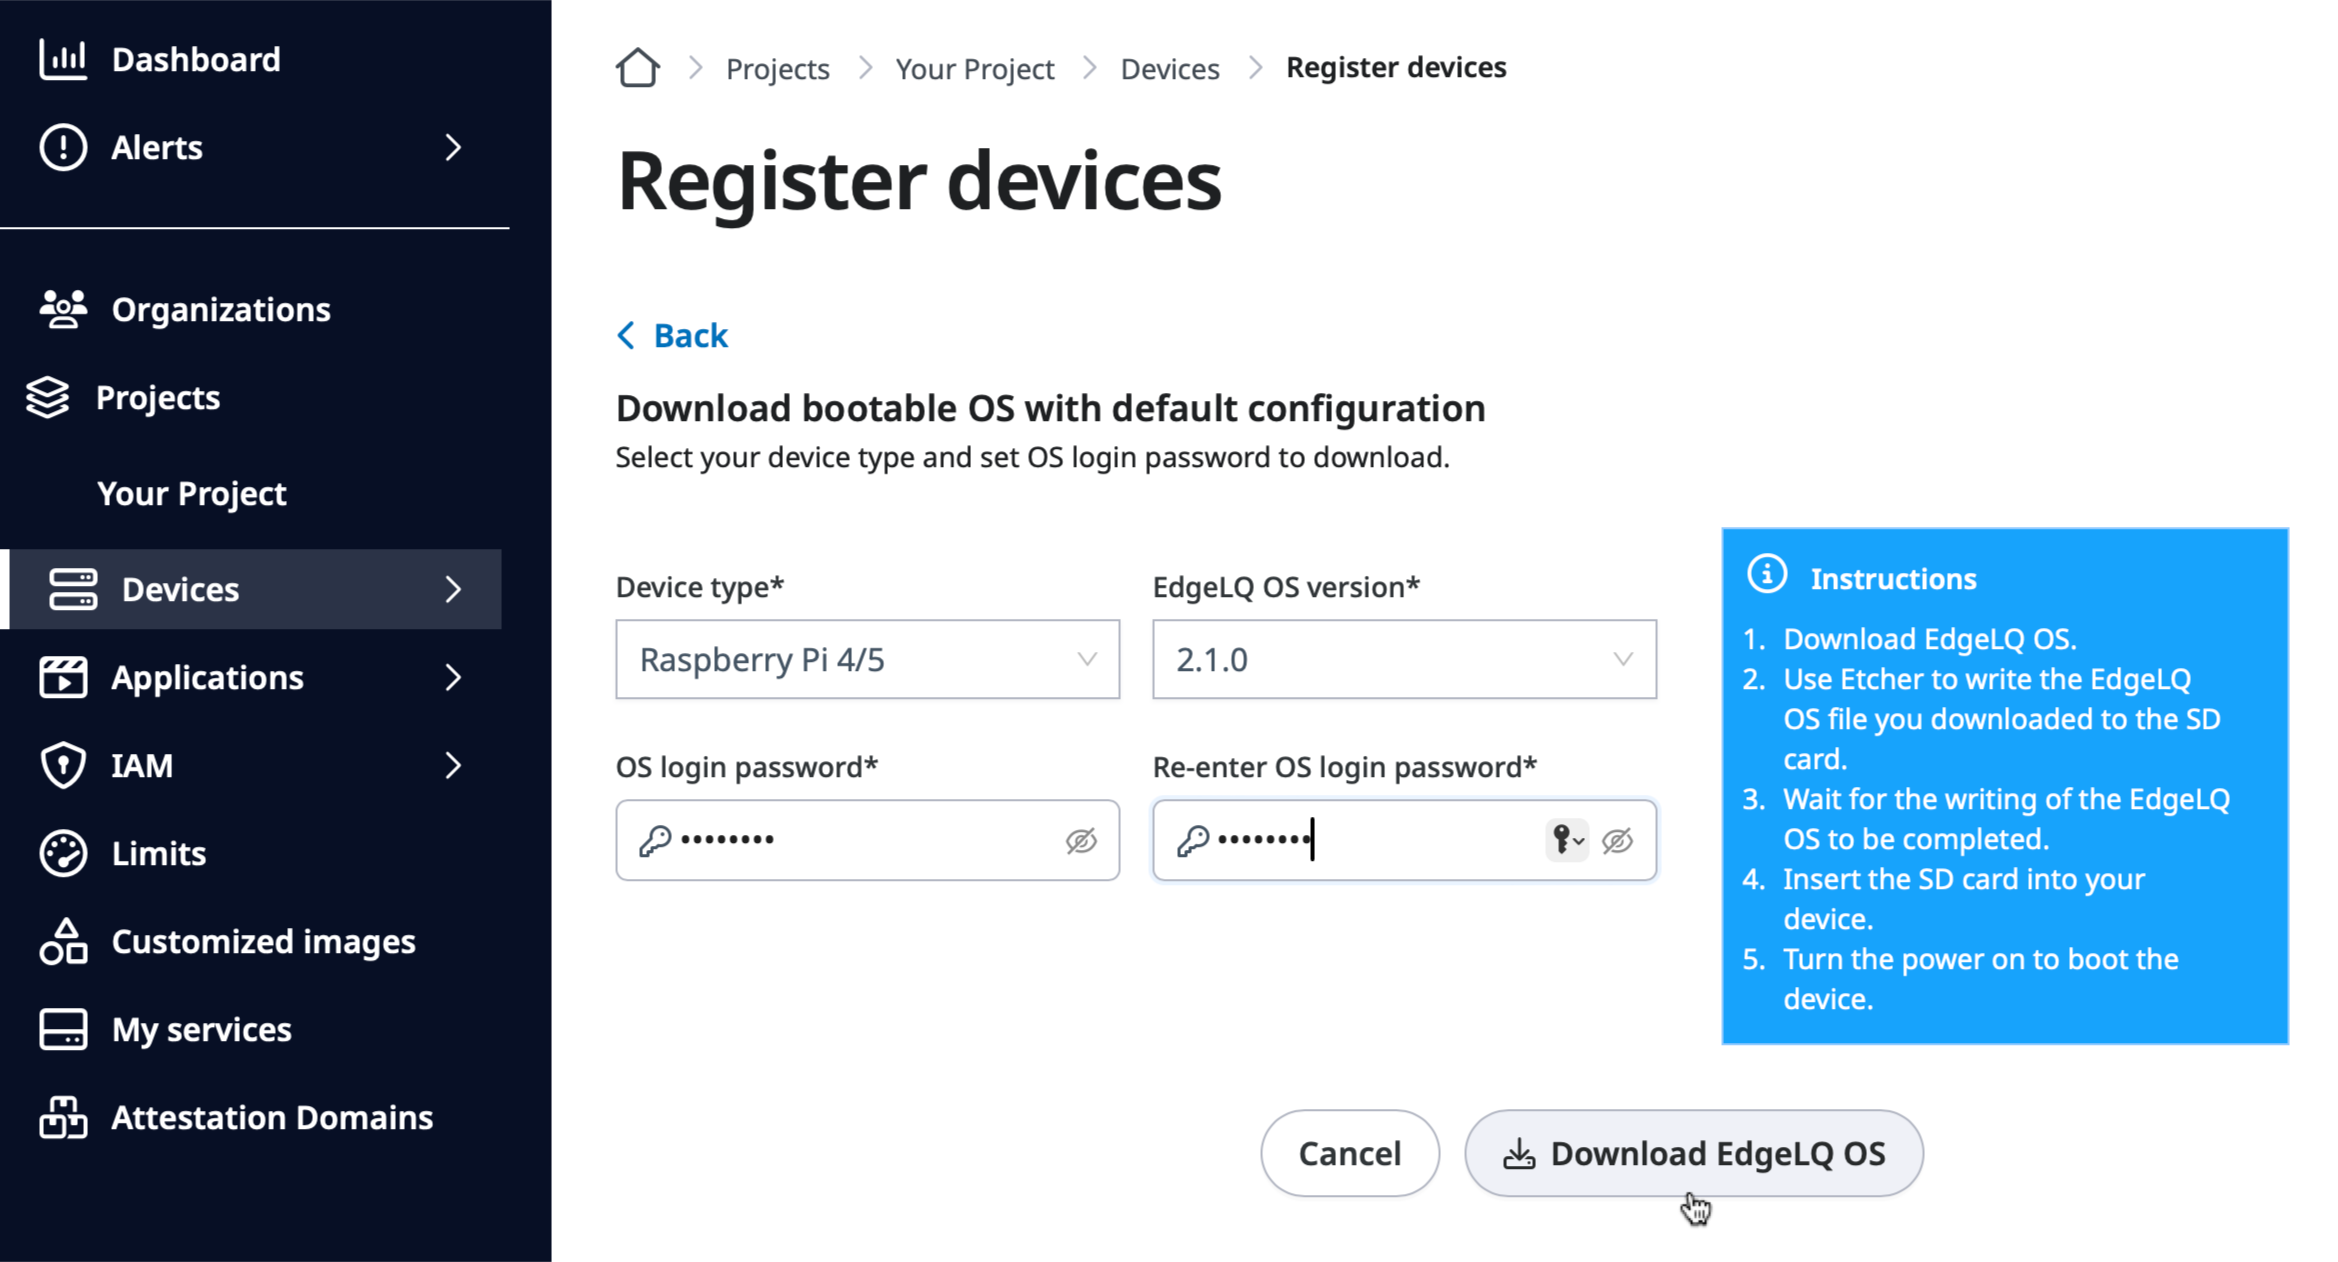
Download EdgeLQ OS button on the Register devices page.
Select the device type as Rasberry Pi 4/5 with the supported OS version.
Click Download once you give the root login password.
Device provisioning
Now, let’s flash the downloaded SPEKTRA Edge OS image to the device.
Here is the steps to follow to flash the OS image and boot the device:
Insert the SD card to the local machine.
Write the SPEKTRA Edge OS image you downloaded to the SD card.
Insert the SD card into the Raspberry Pi.
Power up the Raspberry Pi with the power cable to boot the device.
Make the on-board eMMC storage accessible to the local machine.
Write the SPEKTRA Edge OS image you downloaded to the eMMC storage.
Boot the device from eMMC storage.
Please take a look at the official Raspberry Pi compute module
documentation for more detail.
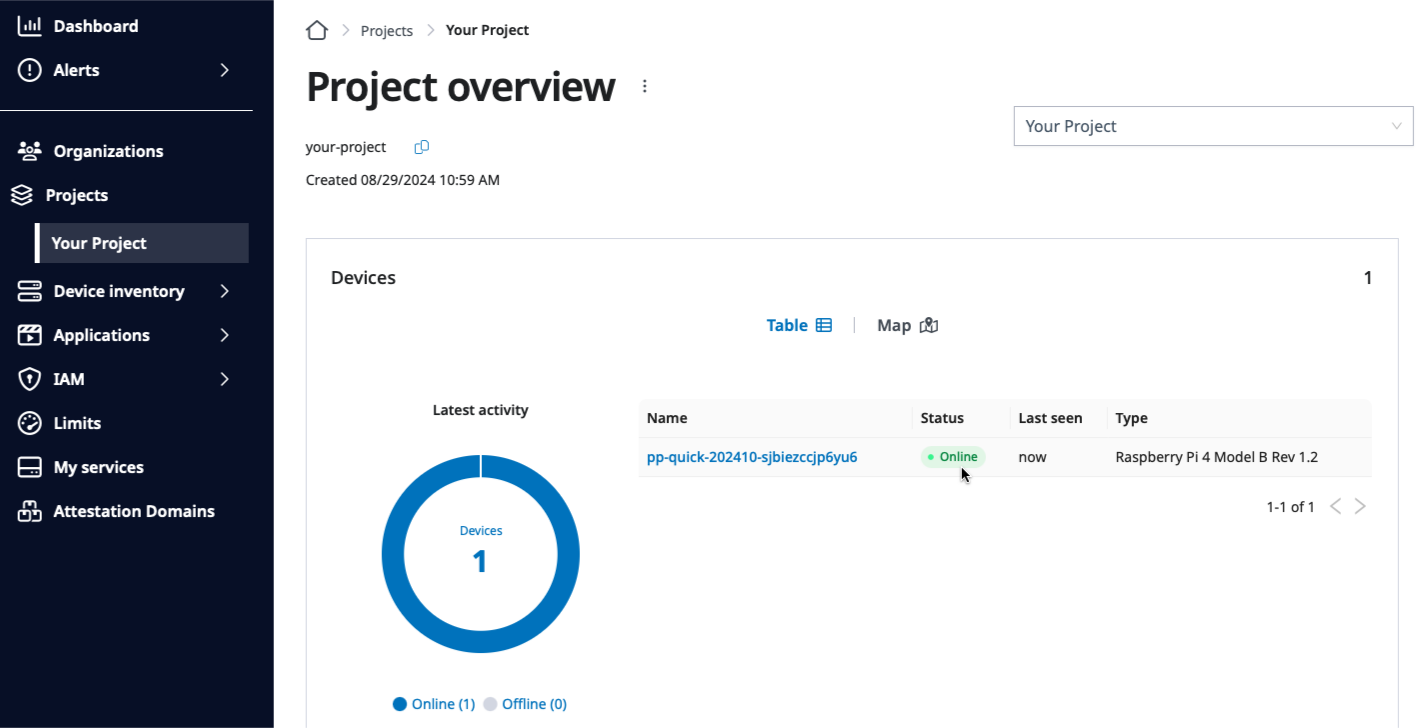
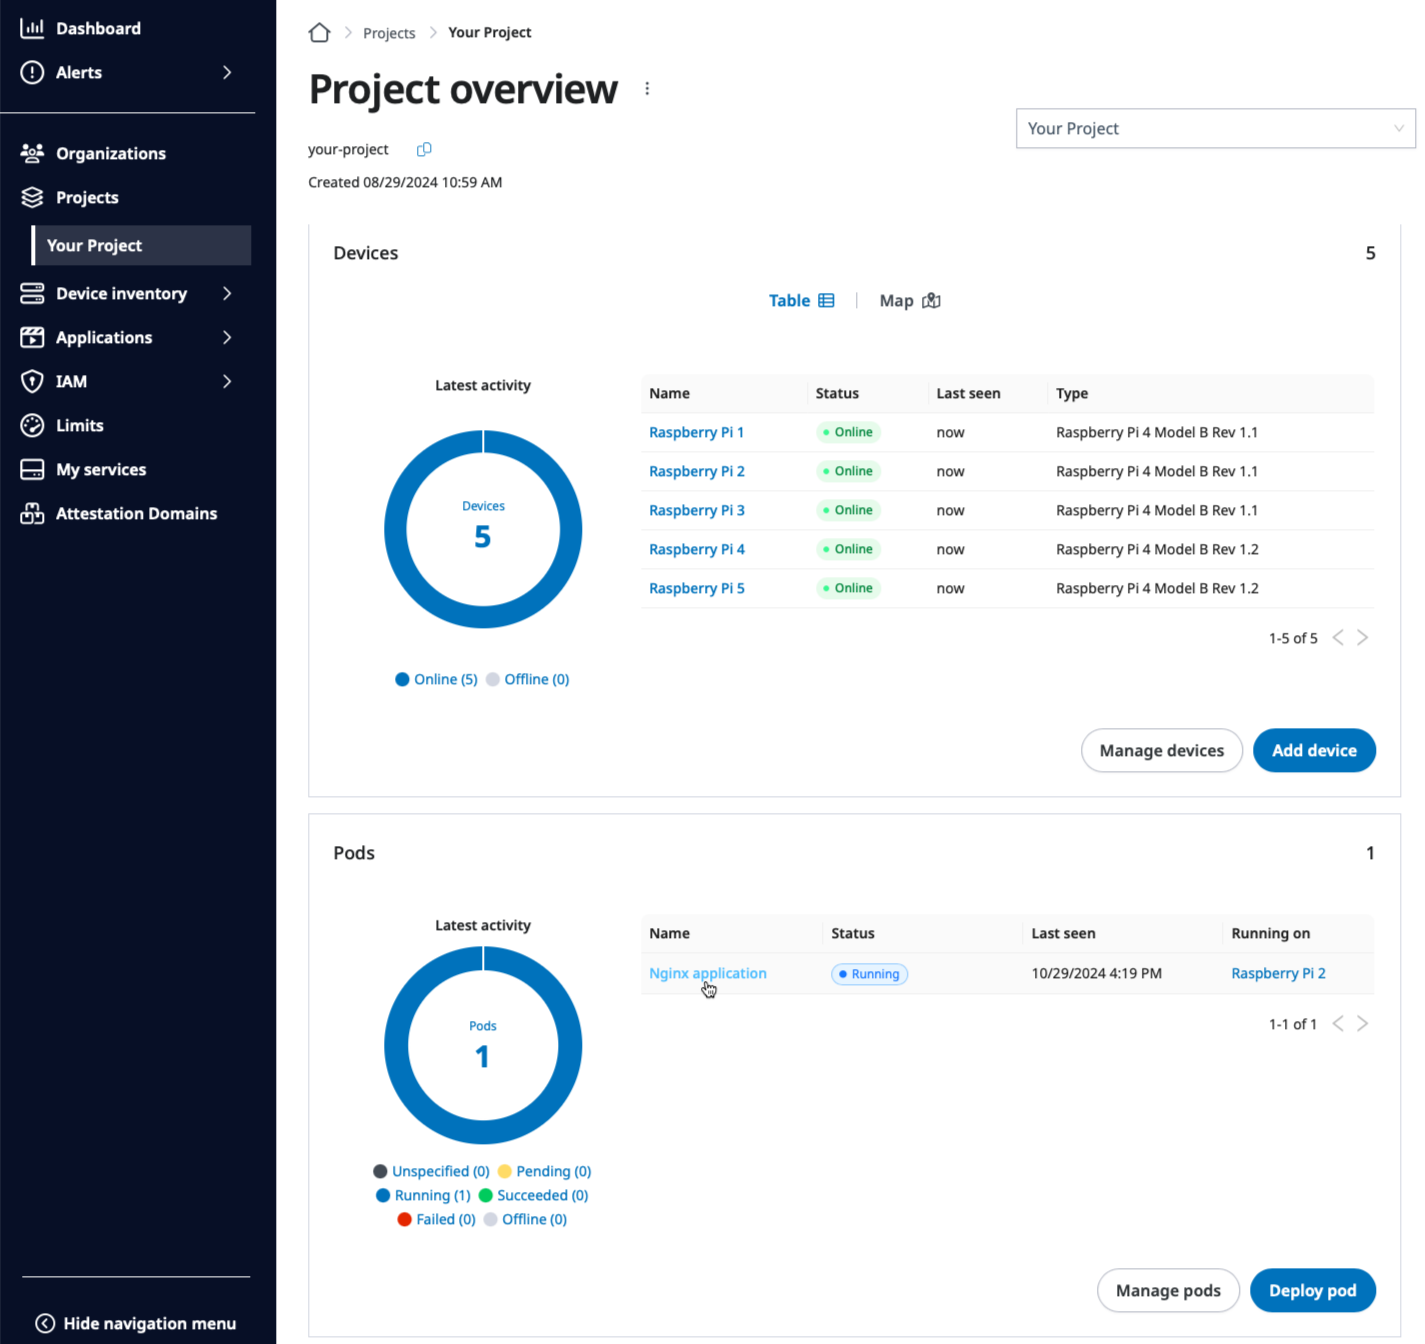
Once it’s connected to the network, the new device should be shown as
online and you should be able to develop application on it.
The newly provisioned device in Online status on the Project overview page.
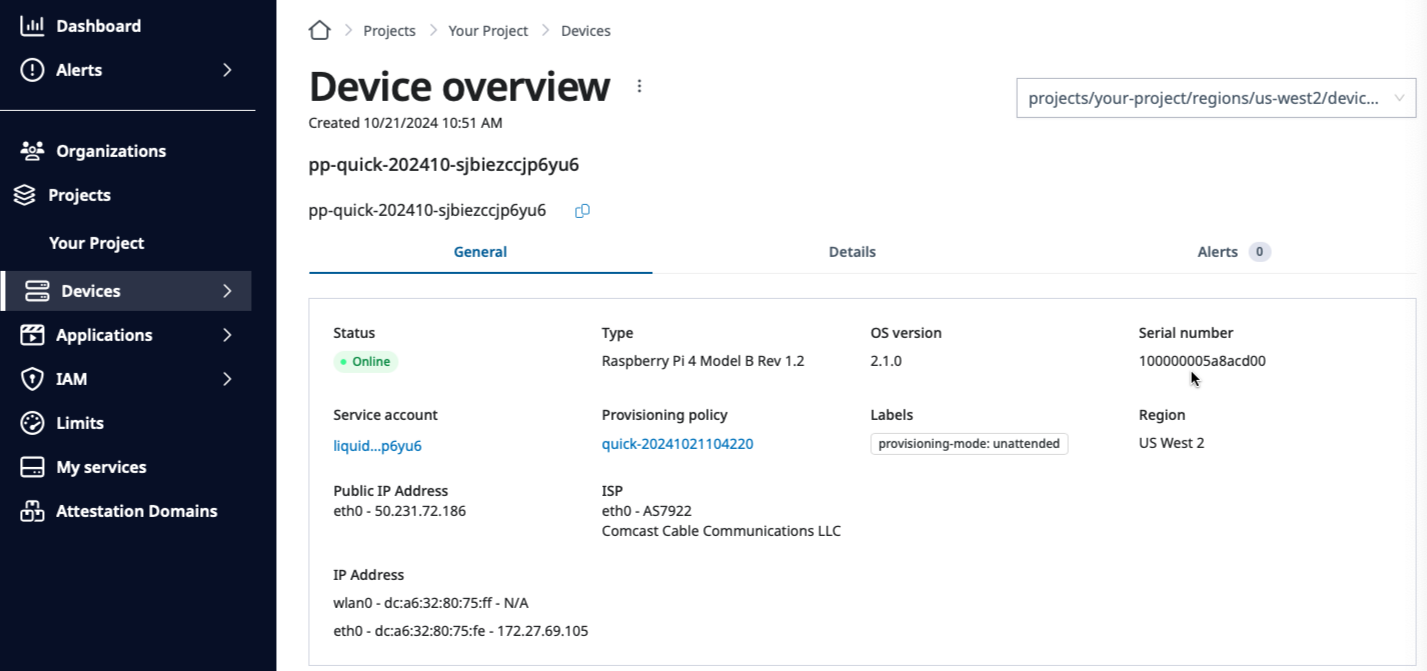
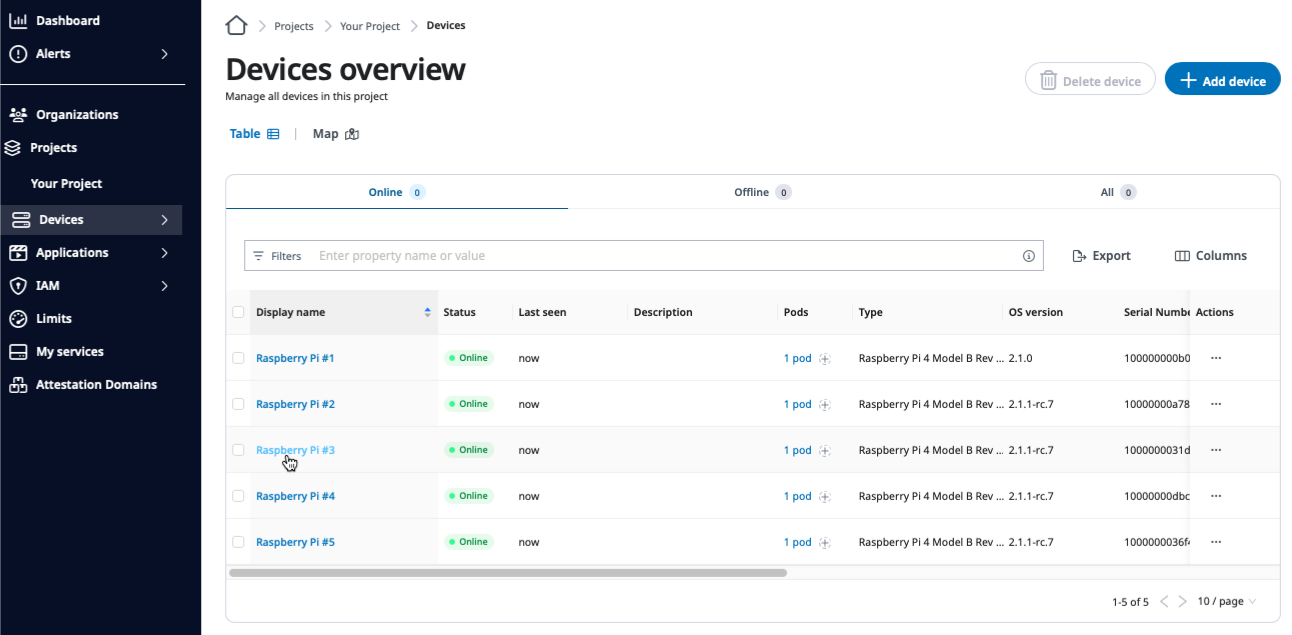
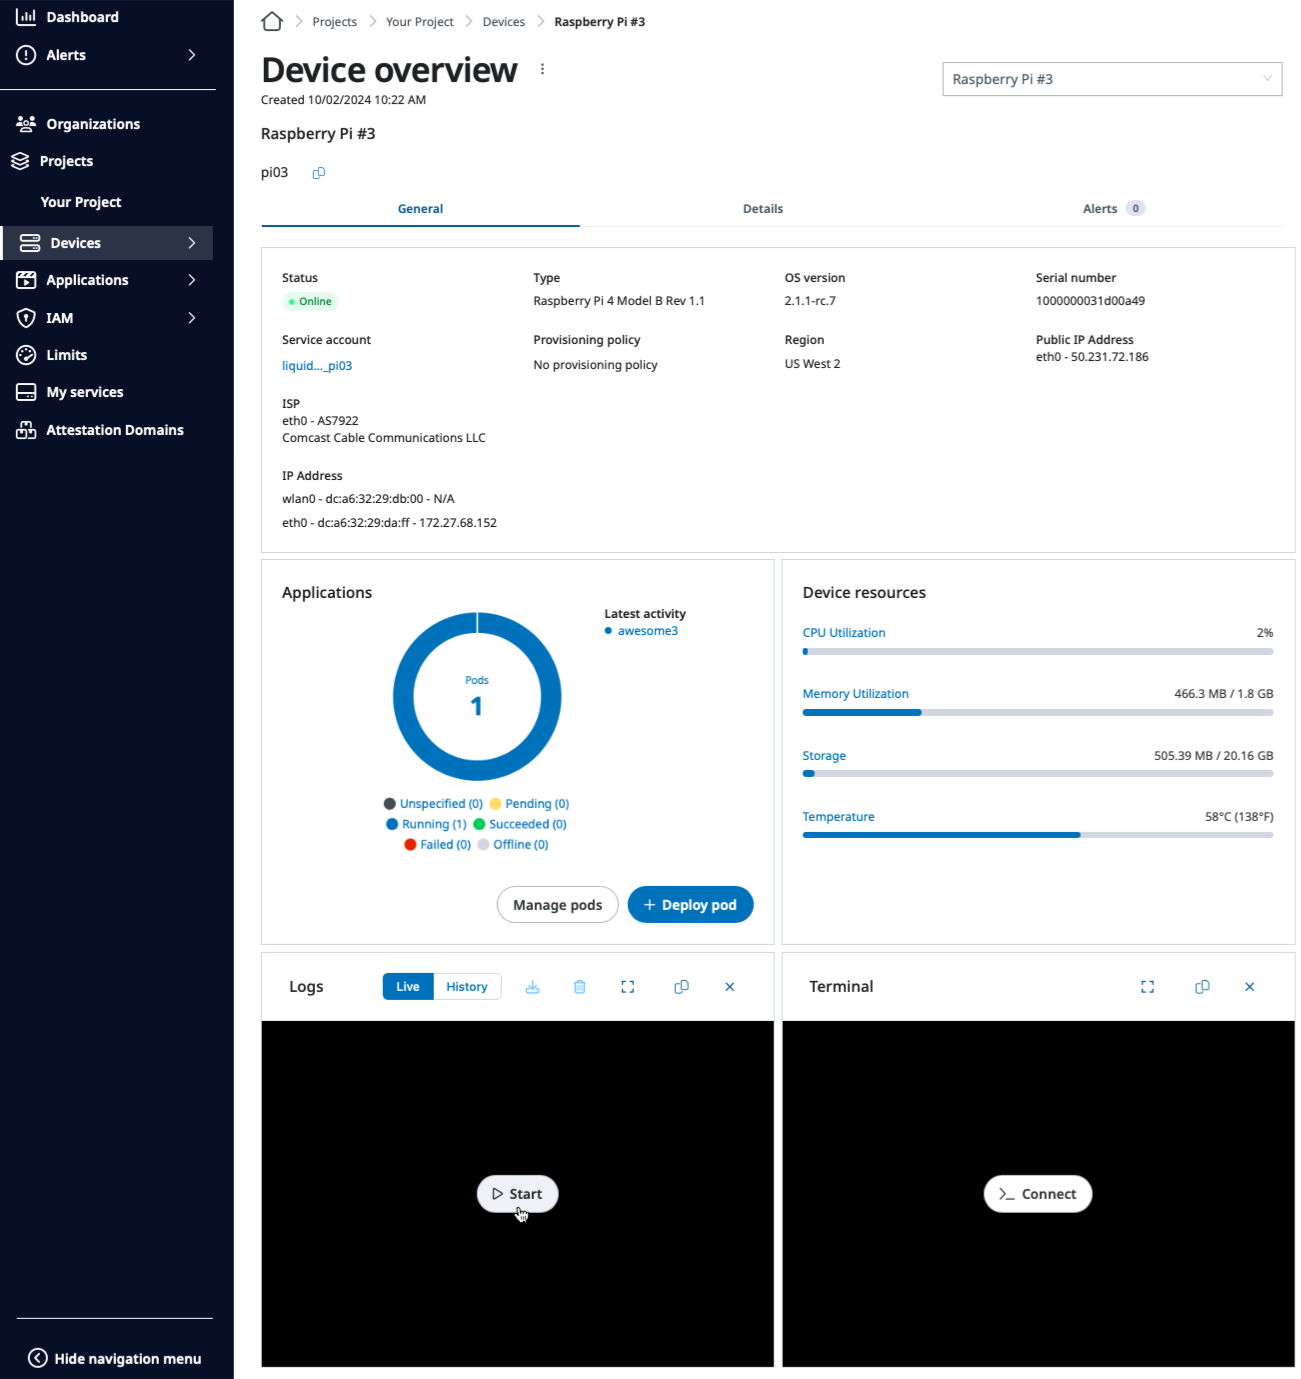
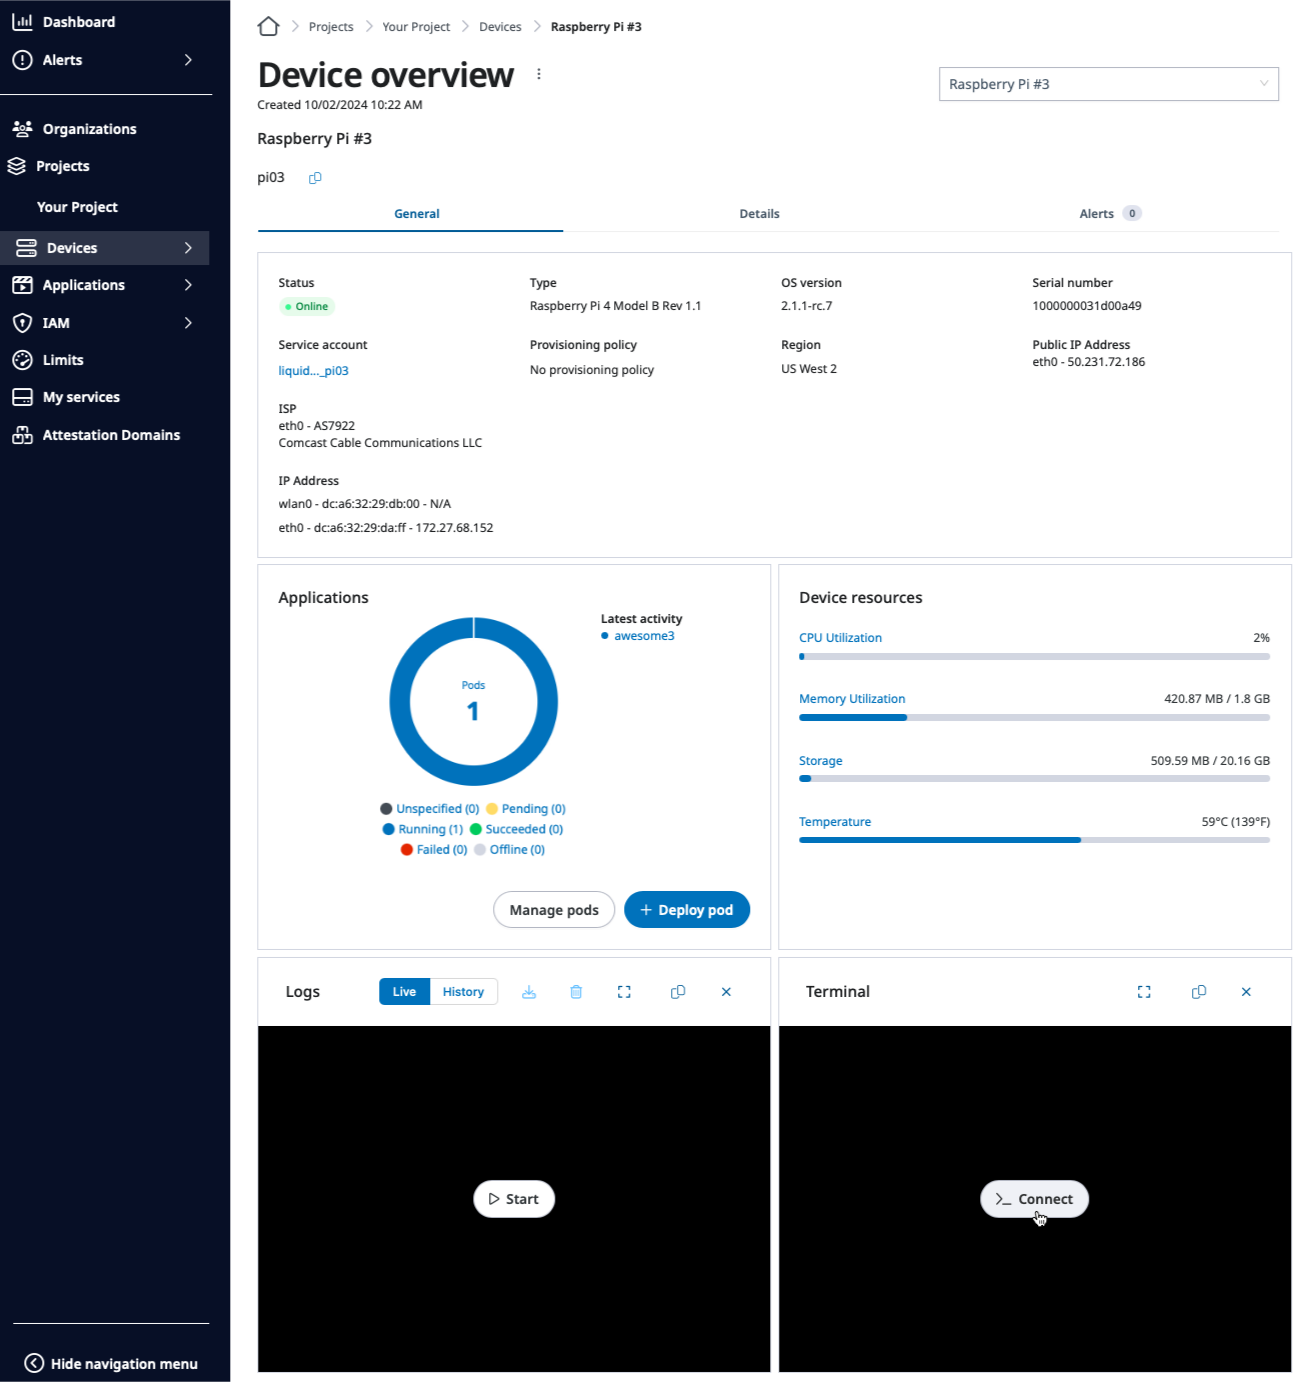
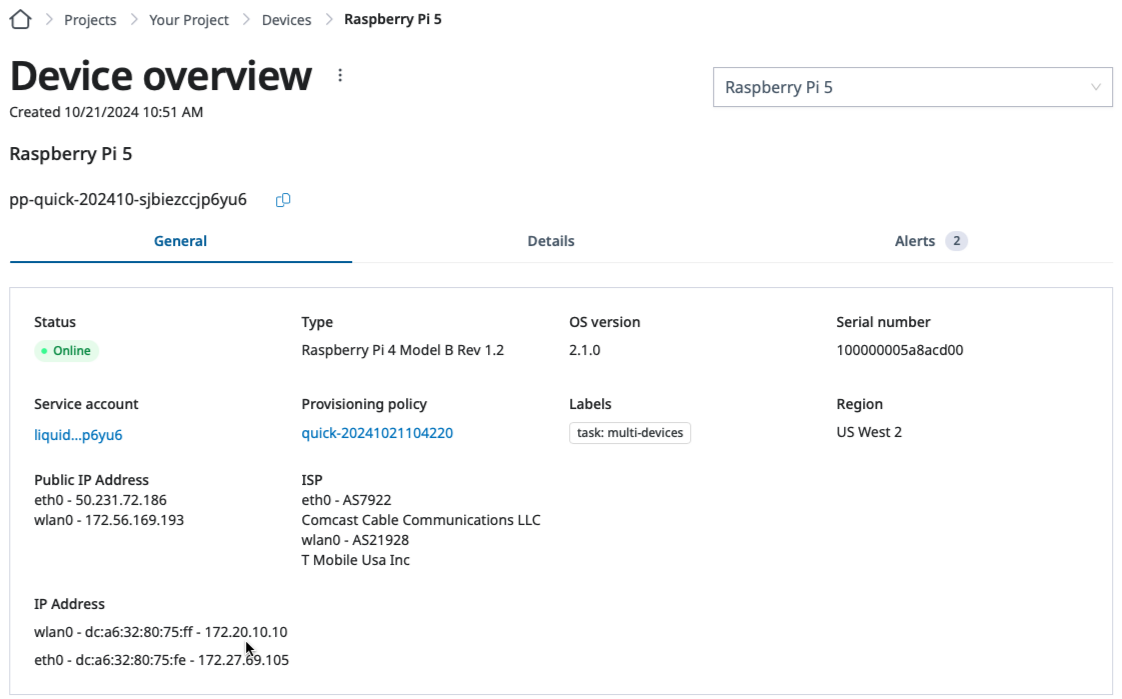
Let’s check the device serial number and other device information to double check
if it’s the correct device. Click the name of the device to go to the
Device overview page.
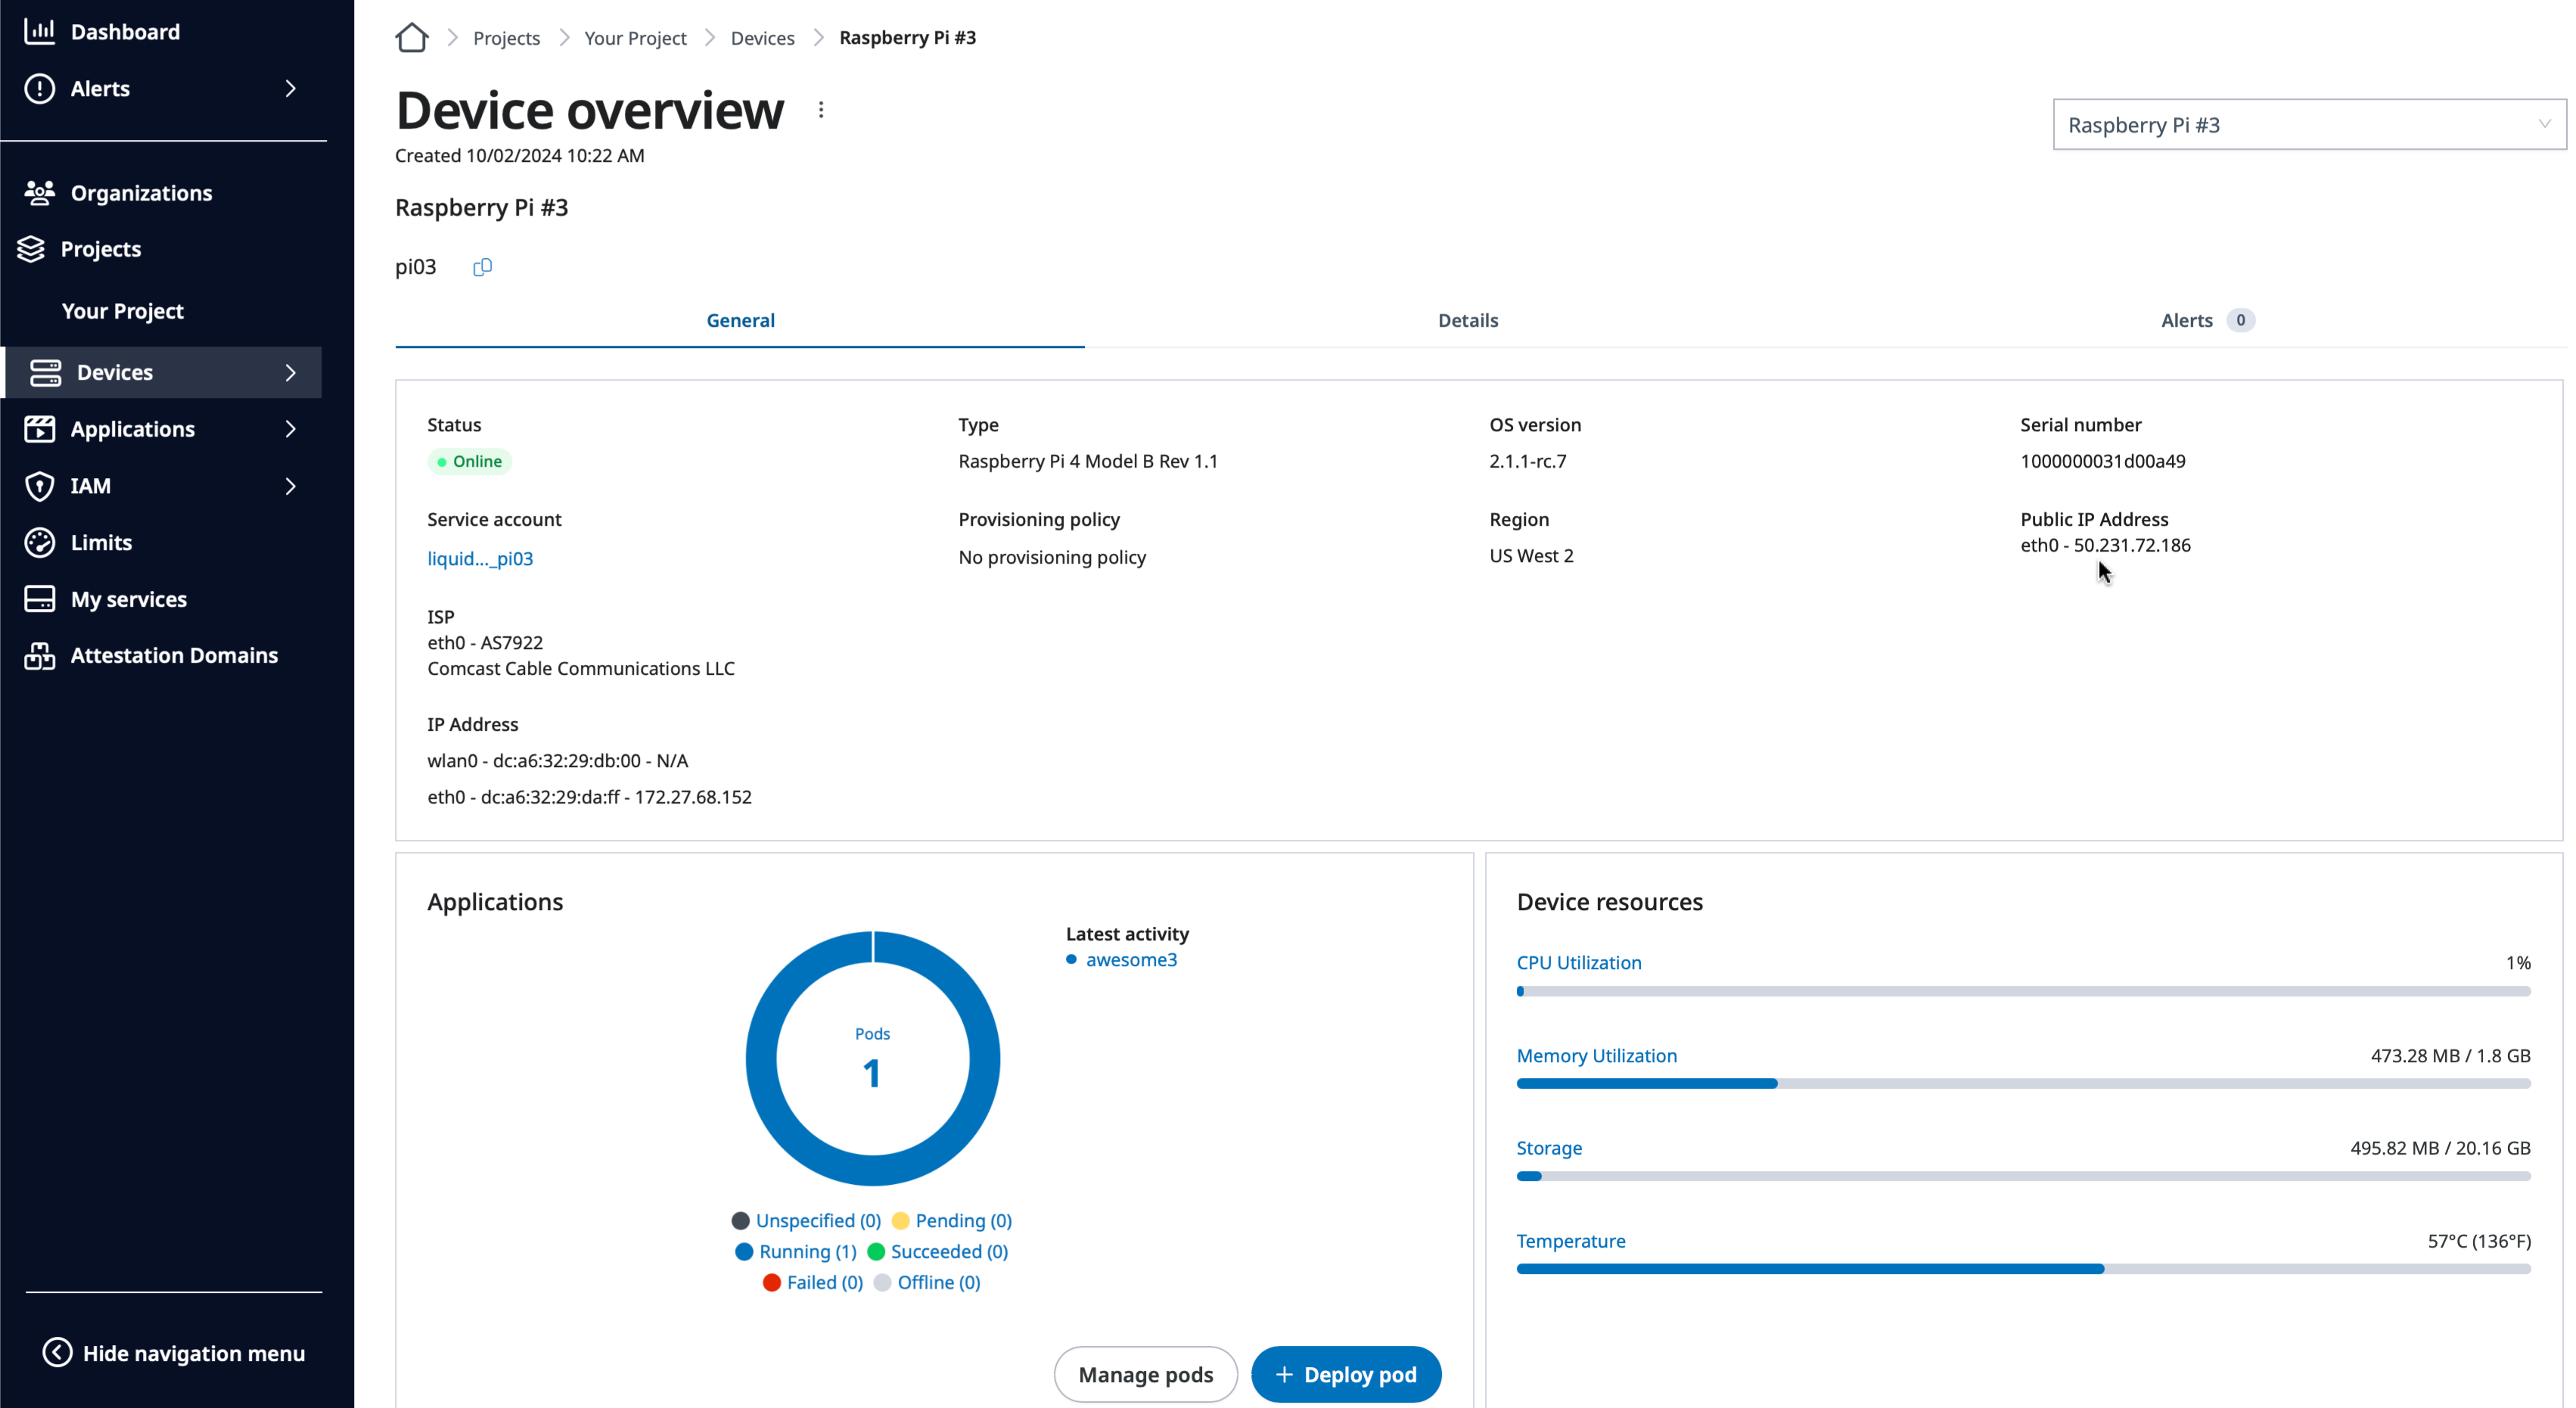
Here, you can check the device information including:
Device status
Device type
OS version
Device serial number
IP addresses
Device serial number on the Device overview page.
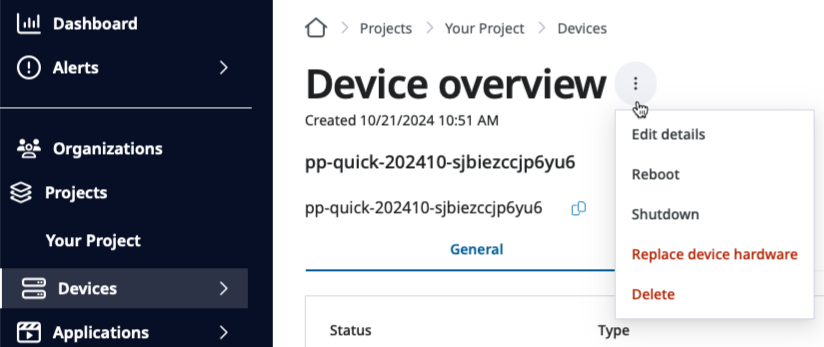
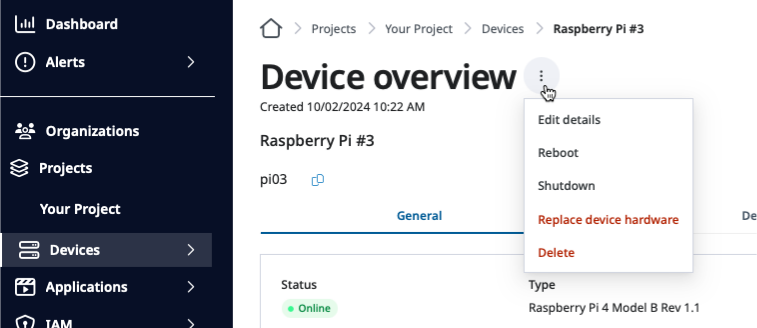
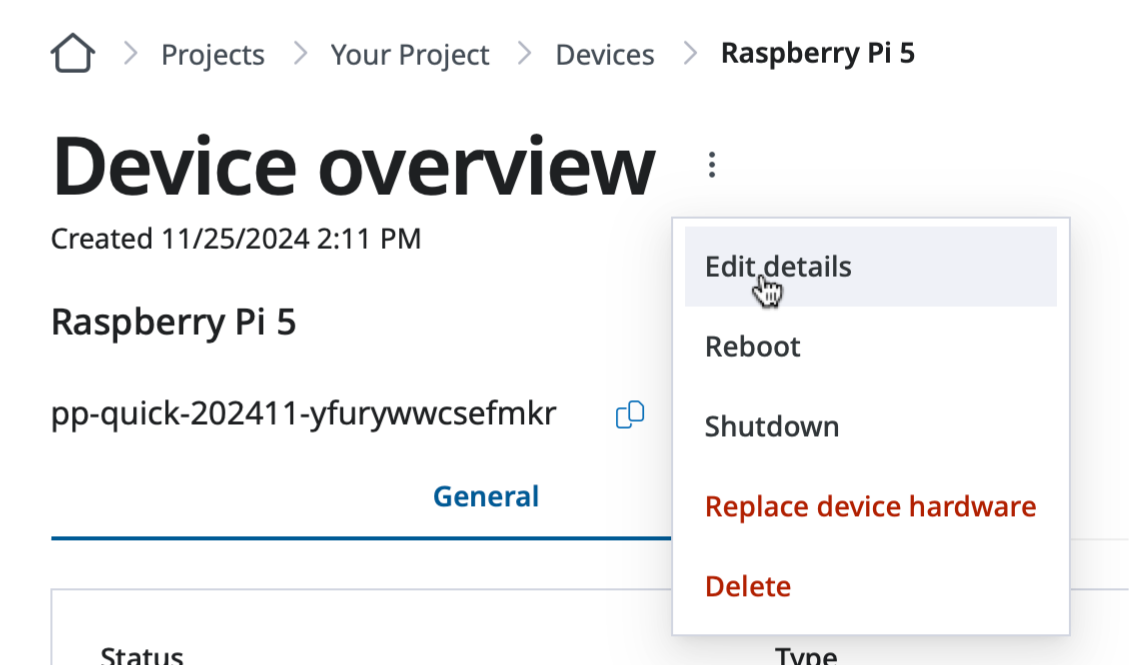
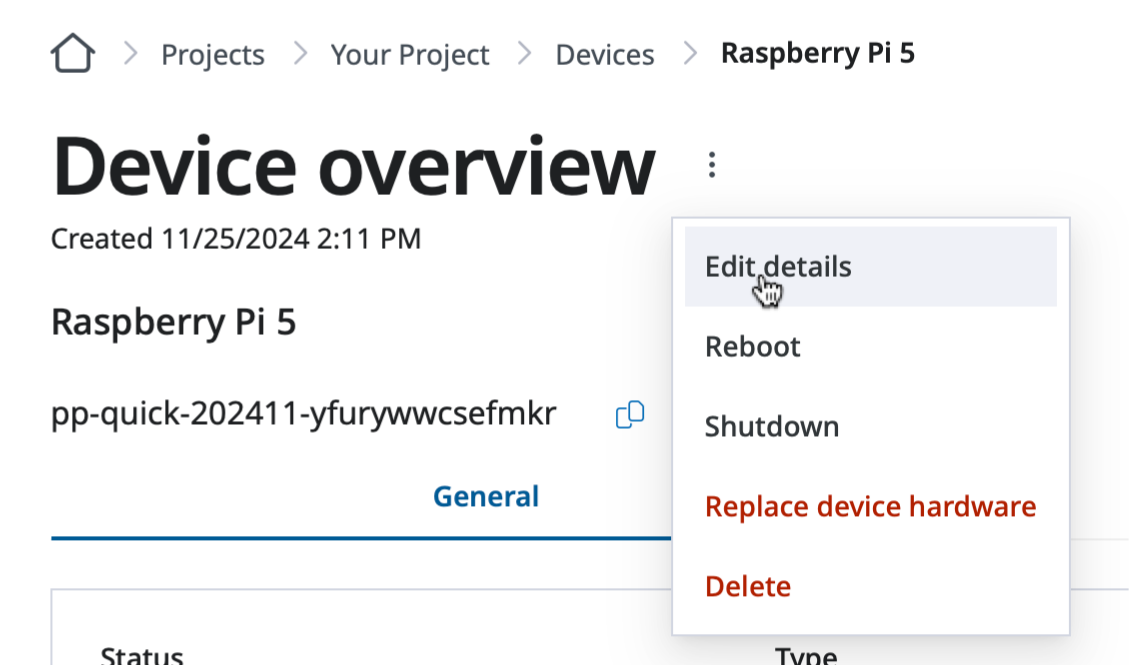
Now, let’s set the device name for easy reference. Select the Edit details
option of the Device overview pull-down menu shown by hovering to the vertical
triple dots right next to the Device overview page title.
The Device overview pull-down menu on the Device overview page.
Let’s deploy your first application on this device.
Deploy your application
Now the device is ready, let’s deploy a Nginx application on your device.
SPEKTRA Edge provides the docker compose environment on your
device so that the applications can be declared and deployed through the
standard docker compose file format.
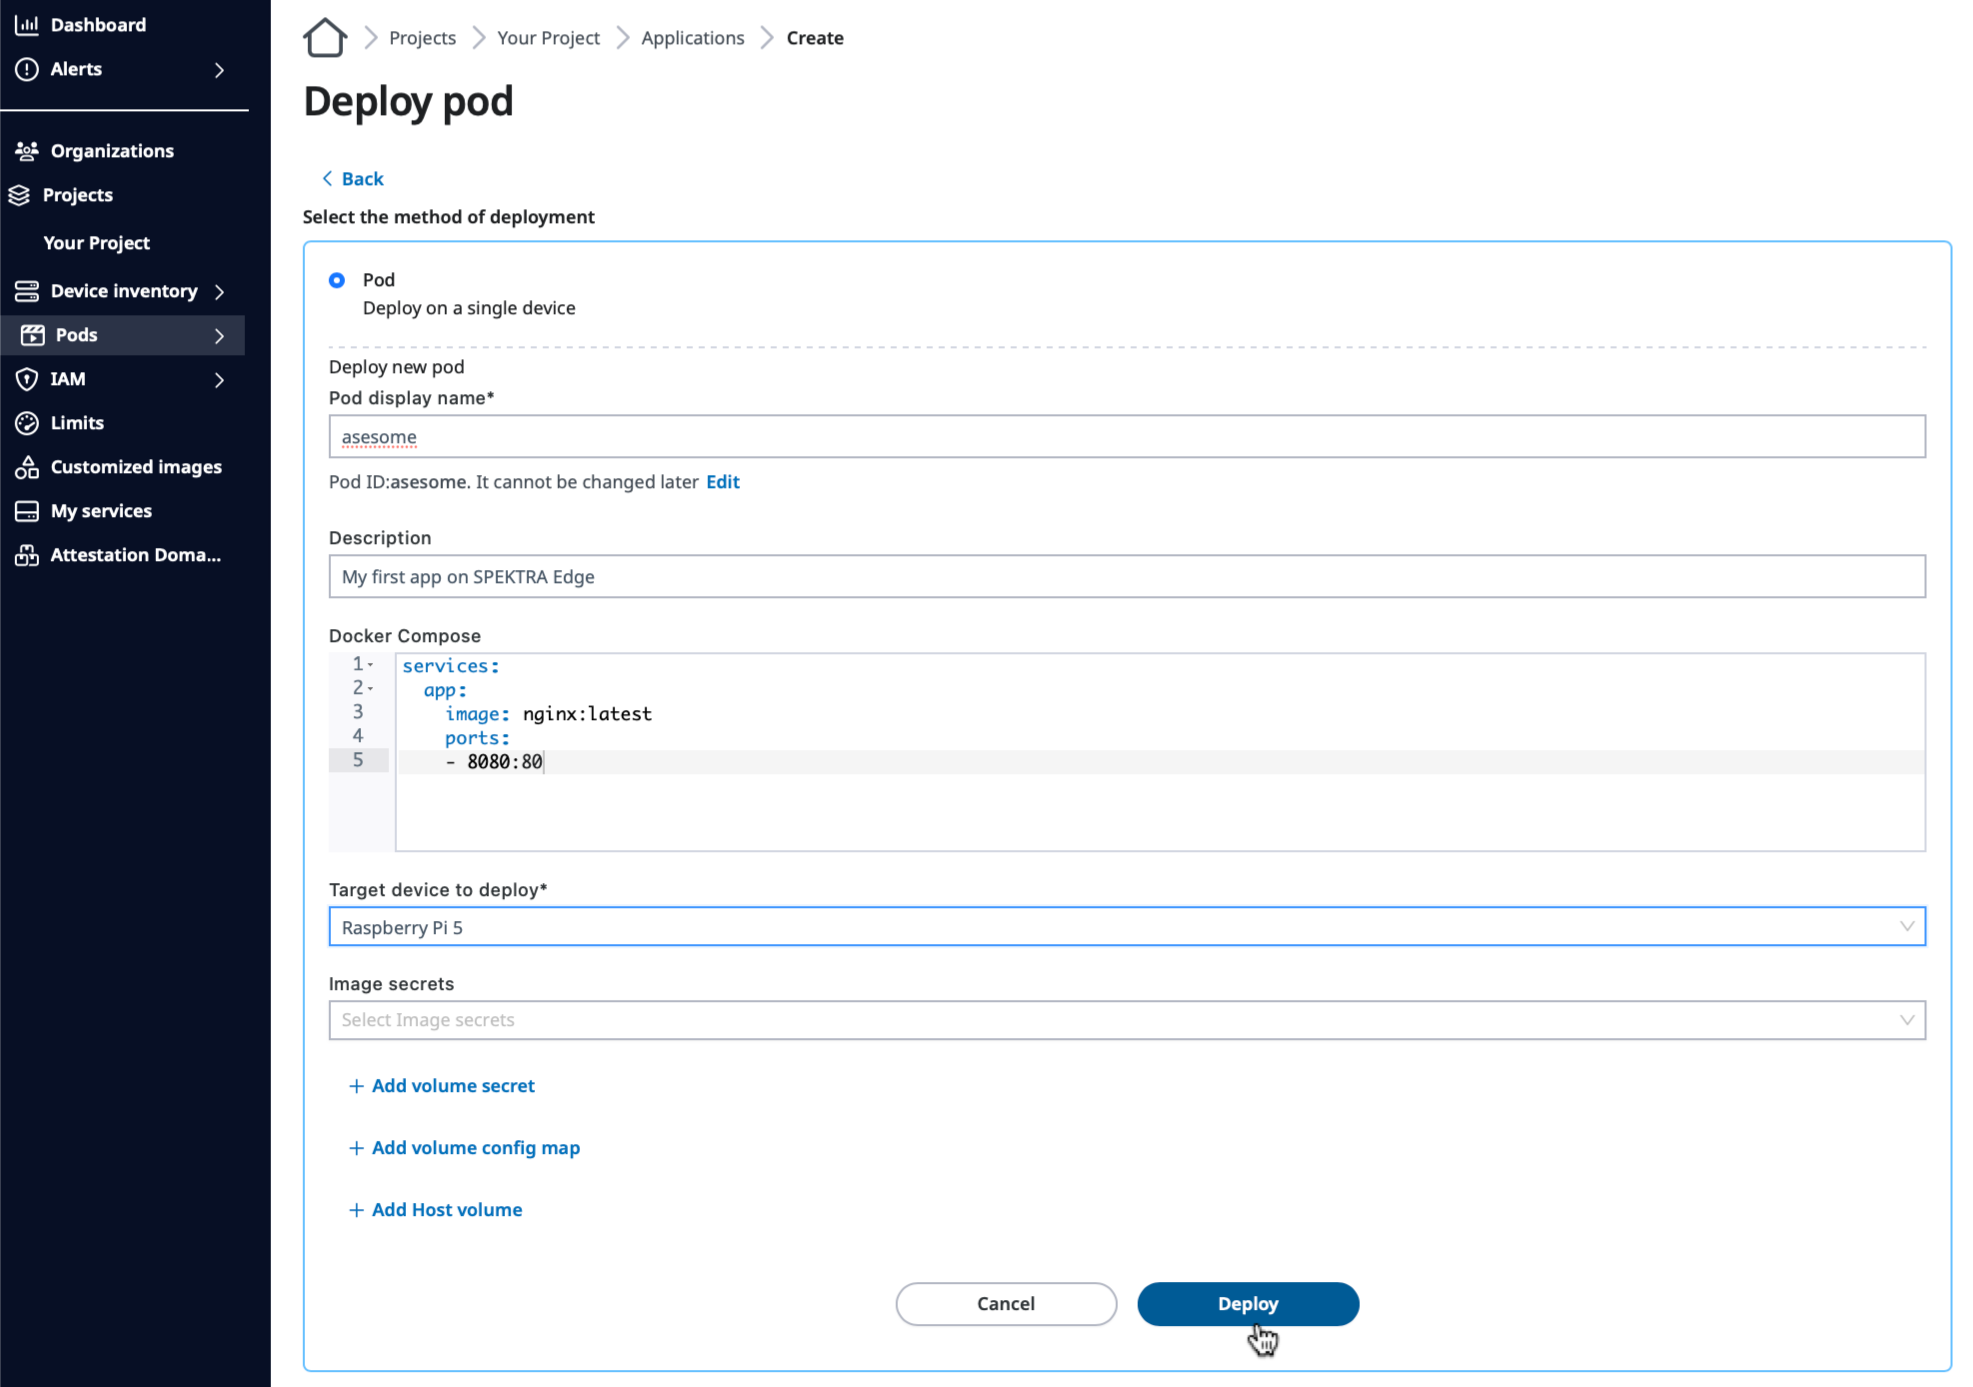
Then, click Deploy to deploy your first application.
Deploy button on the Deploy pod page.
Congratulations. You just deployed the first application on your device
through SPEKTRA Edge!
Verify your application
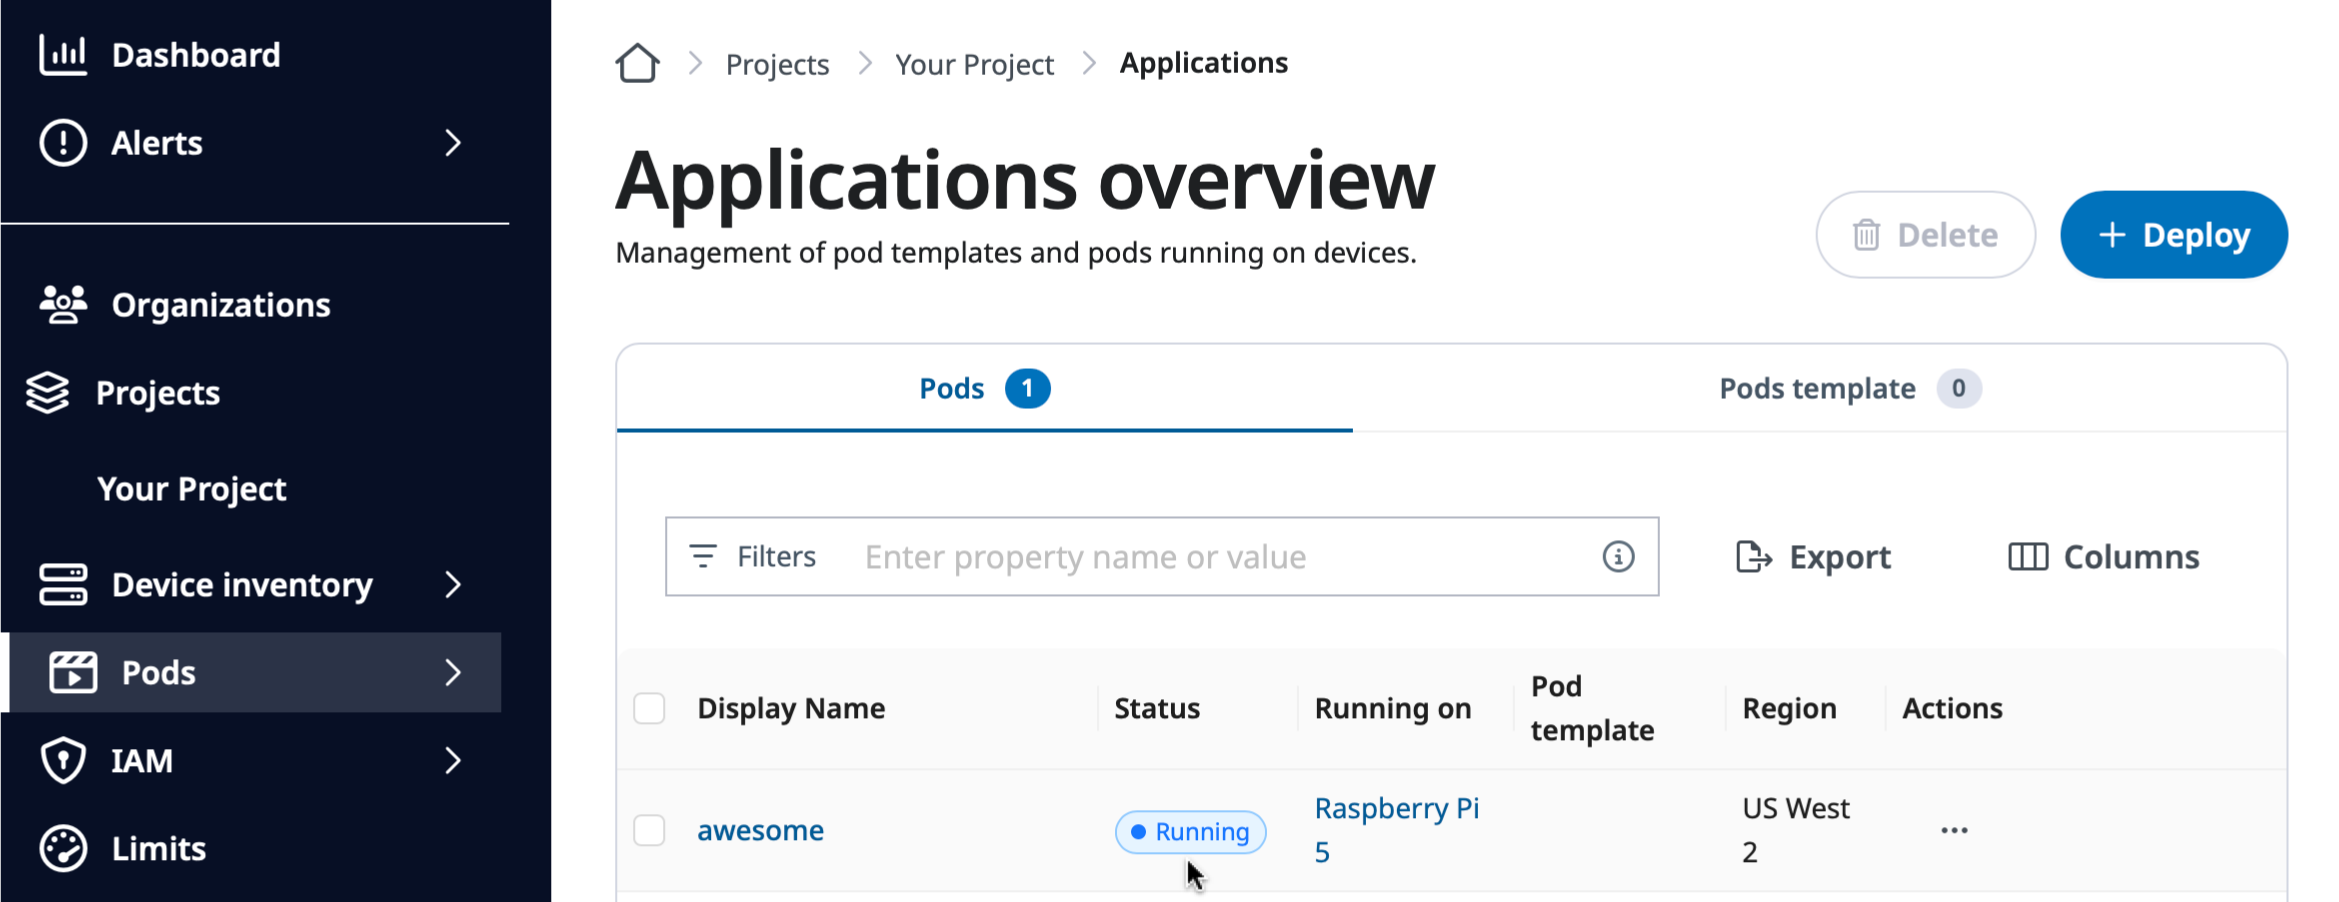
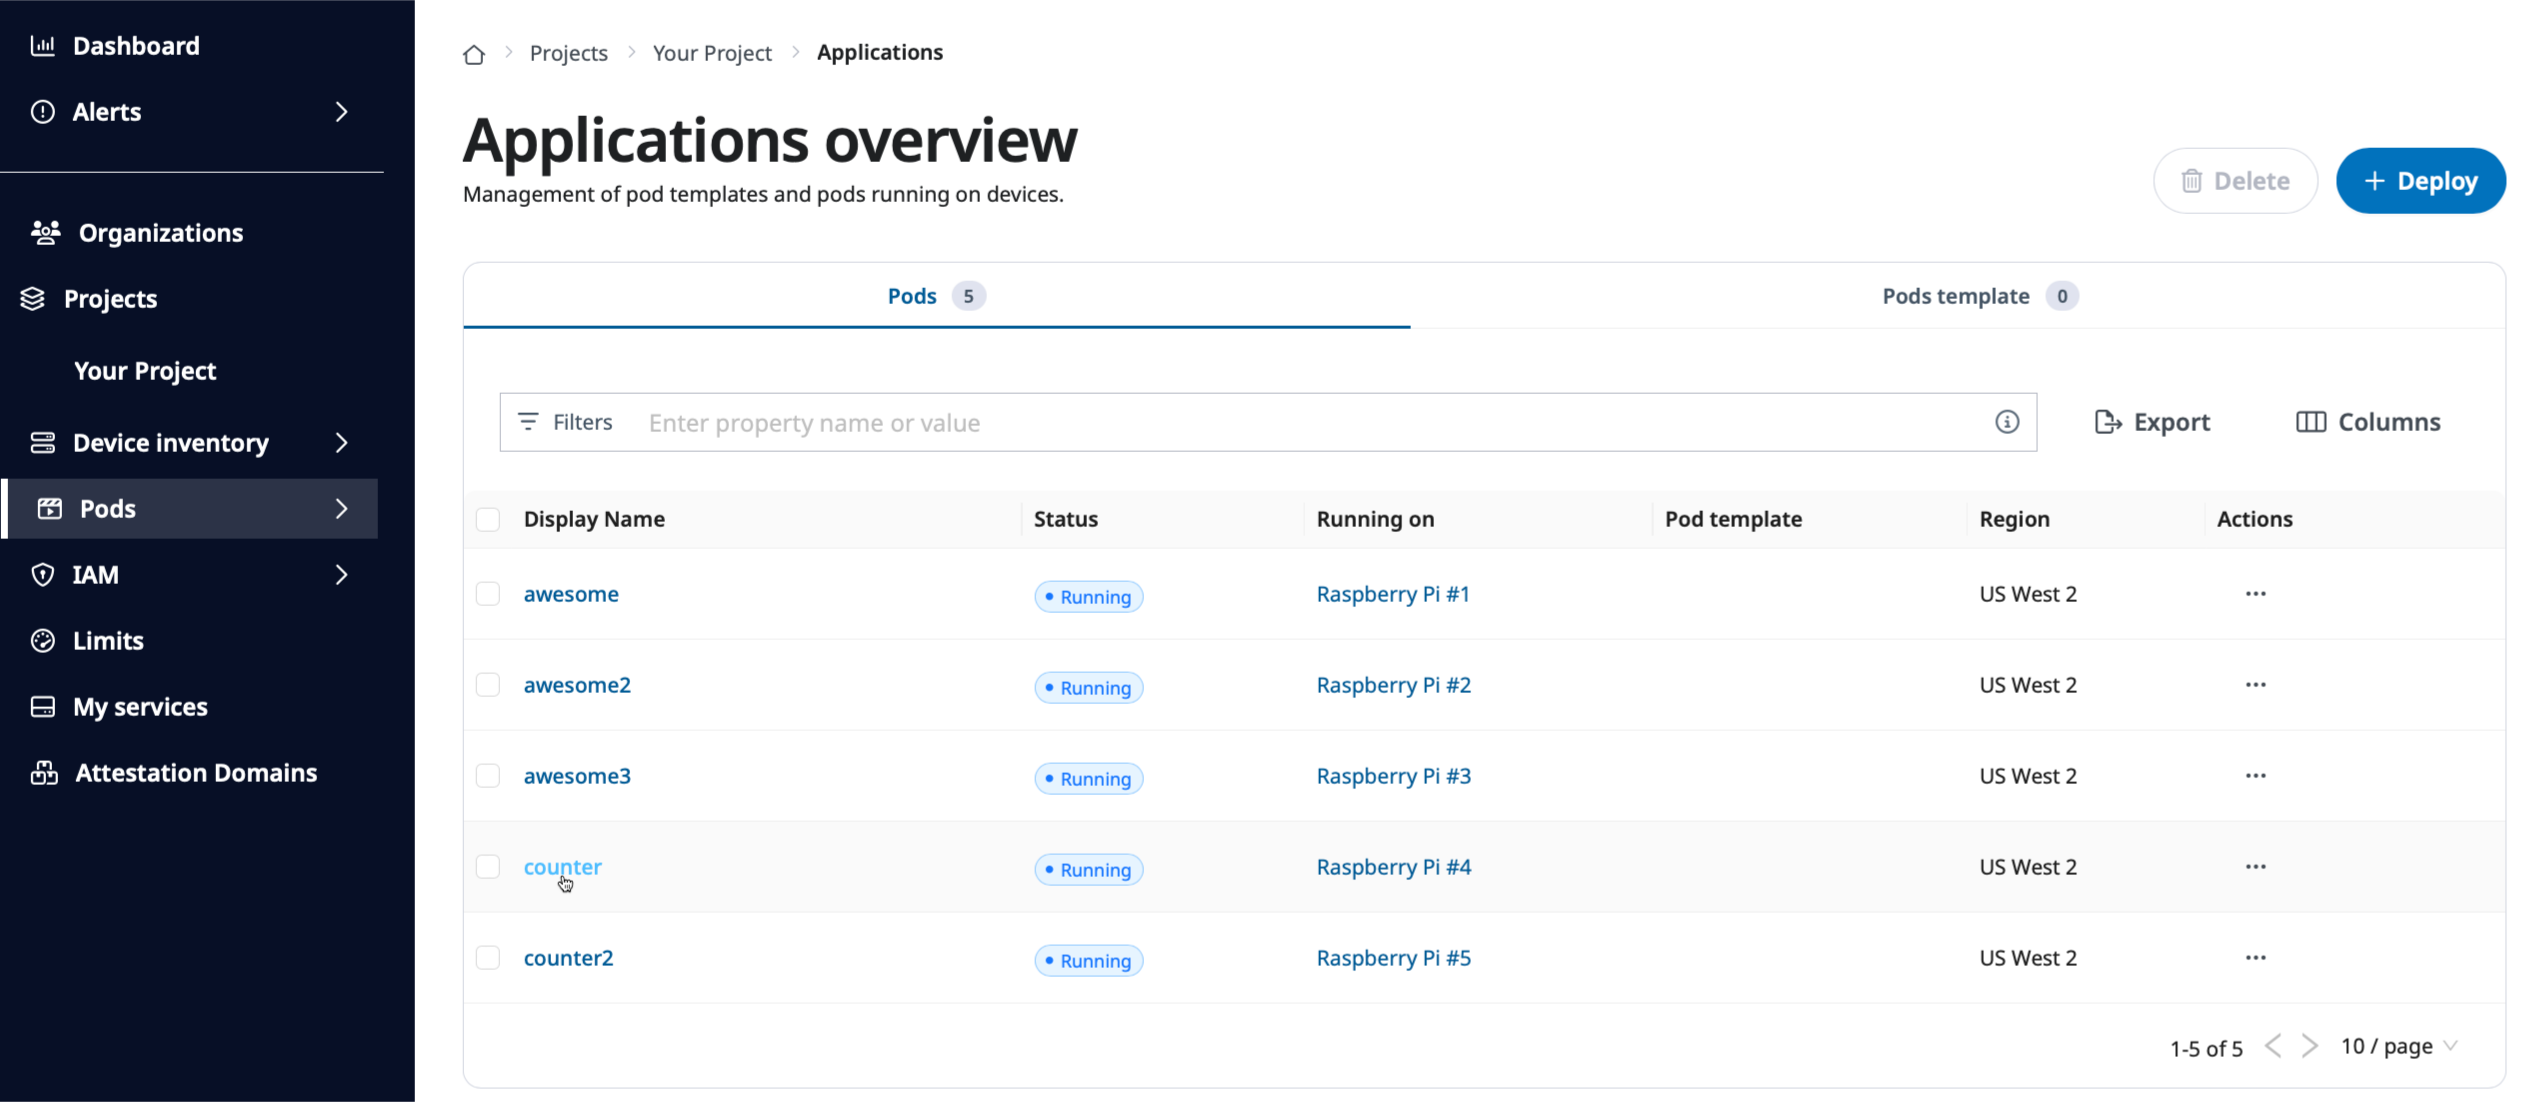
Now check the application through the applications overview page.
Here, you can see the application you just deployed successfully running
on your device.
Application status column on the Applications overview page.
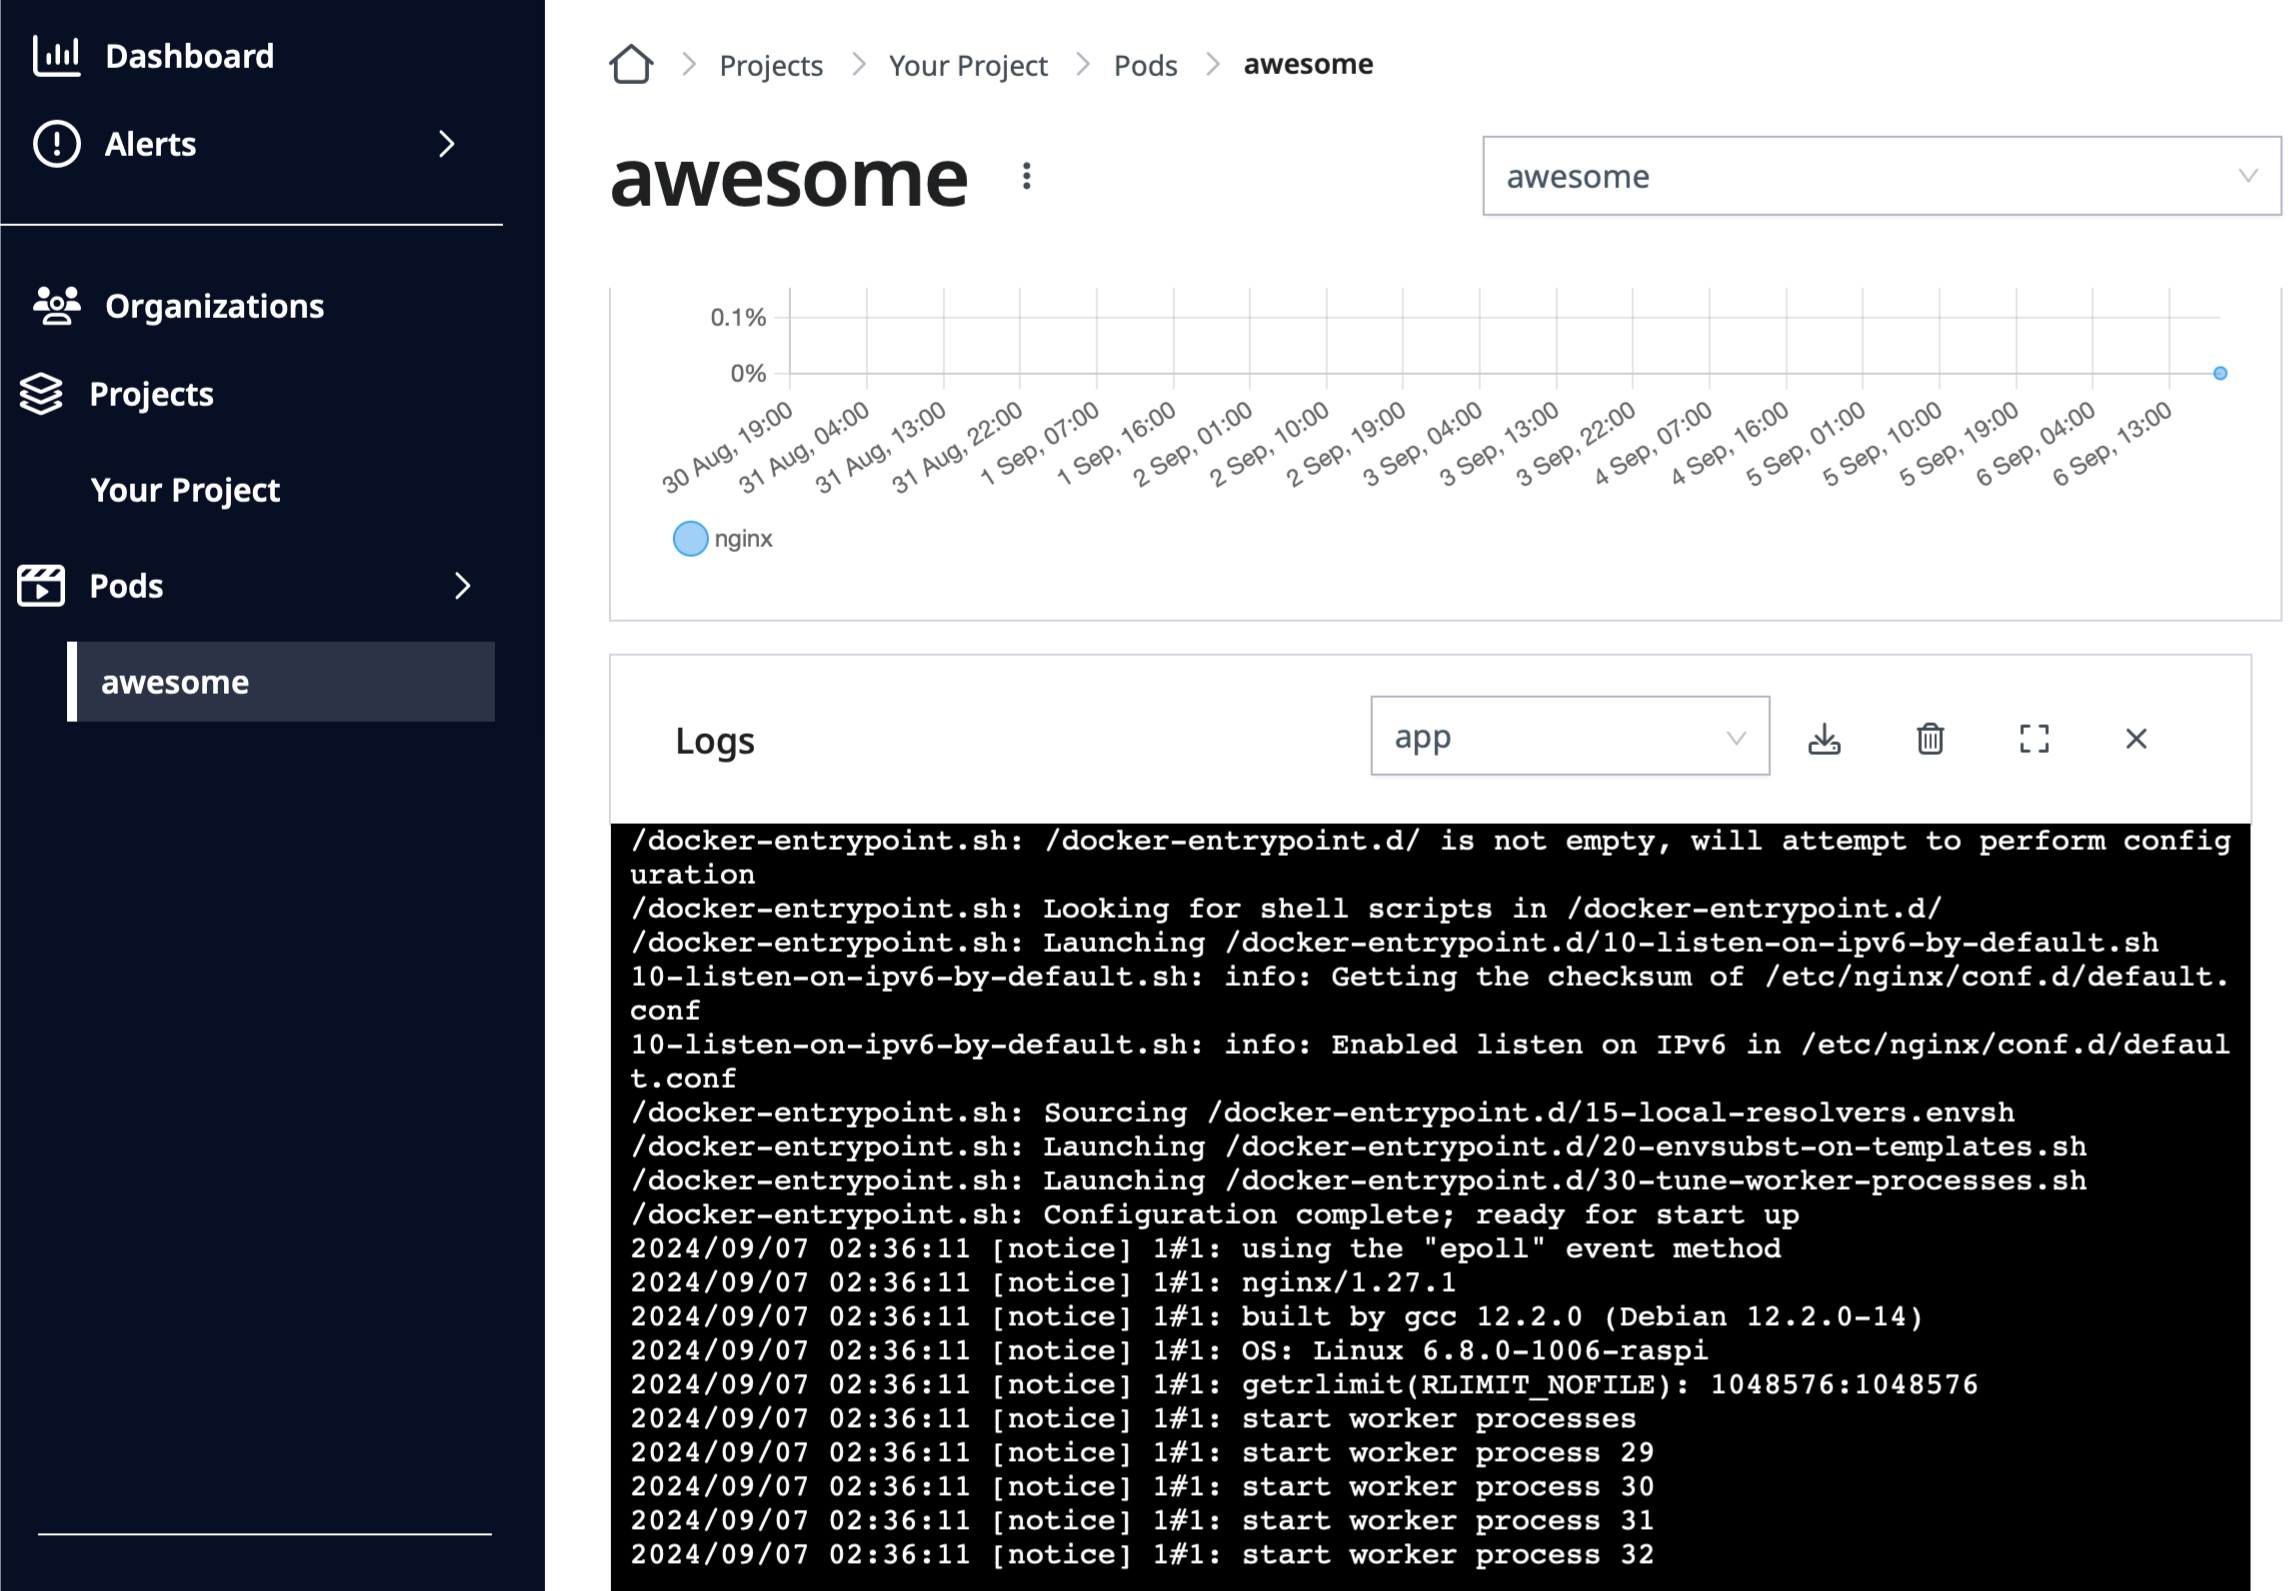
Click the application name on the page above and scroll down to the
Logs section of the application detail page to check the application
logs by clicking the Start button.
Application logs window on the Application page.
Here you can see your application successfully running on your device.
Accessing your application
You can access your application from your local machine with
the SPEKTRA Edge port-forwarding feature.
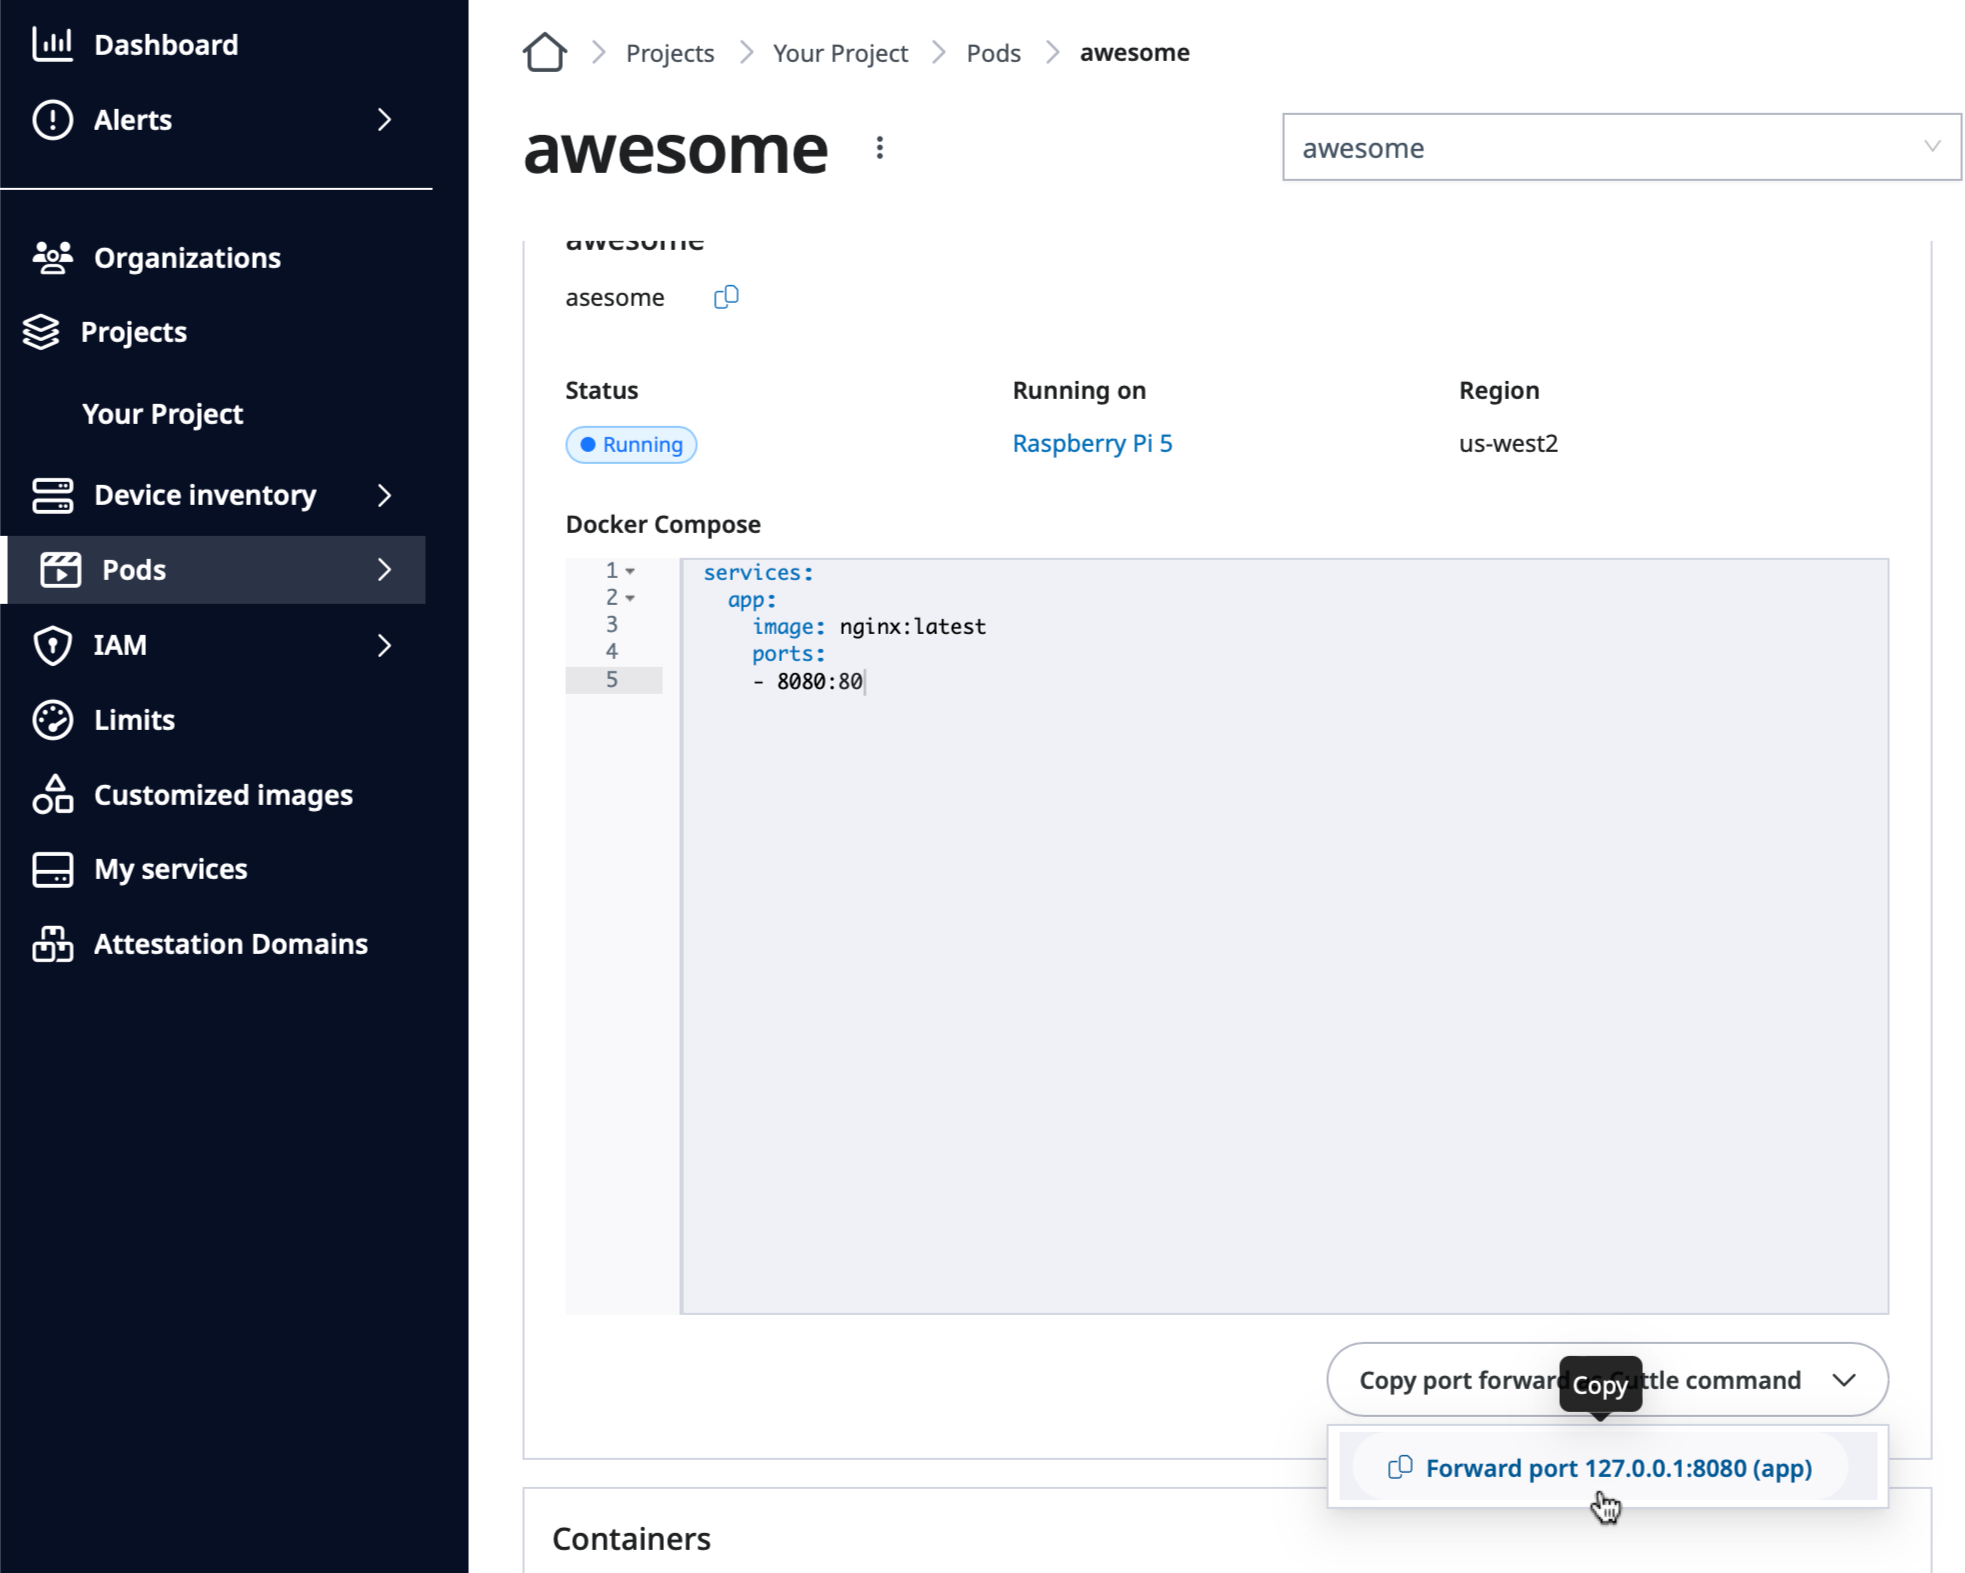
Go to the application page and copy the port-forward command located under
the Docker compose section.
Copy Port forward command option on the Application page.
Open the terminal on your local machine. Paste the command you just copied
onto your terminal and run it to enable the port-fowarding to access your
application from the local machine.
Here is the example port-forward command for your reference. It enables
your application, which is listening on device’s port 8080, reachable
through your local machine’s port 8080.
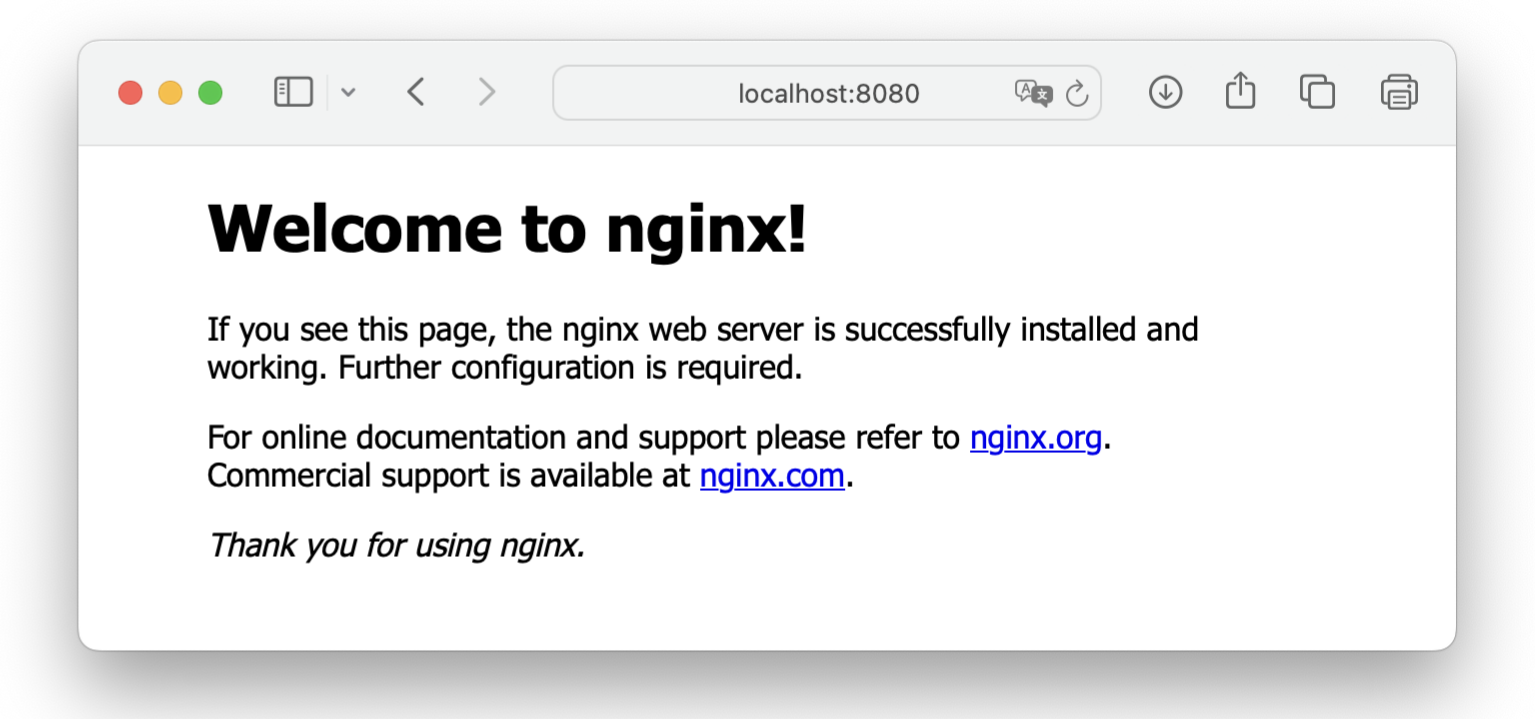
With the above port-forwarding command running, point your browser to
http://localhost:8080 to access your
application from your local machine.
Successfully accessing the application running on your device.
Next steps
Great job! You successfully deployed and verified your first application
running on your device with SPEKTRA Edge.
Please note that you can scale this process to 100+ or 1,000+ devices
through the SPEKTRA Edge platform. Explore the following learning
materials to make it a reality.
Manage and monitor your applications through the SPEKTRA Edge
dashboard.
Let’s learn more about the SPEKTRA Edge way to develop and deploy your
applications on the edge!
2 -
Develop an application
This page describes how to develop applications for the SPEKTRA Edge
platform.
SPEKTRA Edge utilizes the Docker containers to package and deploy
applications for your devices. We follow the standard
docker build process for creating applications so that
you can benefit from the knowlege and experience you may already have
through the prior application development process. Once the image is
built, you publish it to one of the container registries to make devices
to retrieve and run it on the device.
What you need
To build and publish the application image to the registry, you need:
Docker Engine on your local machine
An access to the container registry
Follow the Docker installation guide to install Docker
Engine on your machine. For the container registry access, please consult
your container registry documentation, e.g. Docker Hub
quickstart guide.
Dockerfile
SPEKTRA Edge application development starts with a Dockerfile.
Docker builds images by reading the instructions from a Dockerfile.
A Dockerfile is a text file containing instructions for building your
source code. The Dockerfile instruction syntax is defined by the
specification reference in the Dockerfile reference.
Those are the typical instructions used in Dockerfile:
FROM <image>
initializes a new build stage and sets the base image for subsequent
instructions.
RUN <command>
executes any commands to create a new layer on top of the current image.
WORKDIR <directory>
sets the working directory for any RUN, CMD, ENTRYPOINT, COPY,
and ADD instructions that follow it in the Dockerfile.
COPY <src> <dest>
copies new files or directories from <src> and adds them to the
filesystem of the image at the path <dest>.
CMD <command>
sets the command to be executed when running a container from an
image.
Python Flask application example
Let’s take a look at the example Dockerfile, which builds the
simple Python Flask application:
# syntax=docker/dockerfile:1FROM ubuntu:22.04# Prepare the python environment on the image.RUN apt-get update && apt-get install -y python3 python3-pipRUN pip install flask==3.0.*# Copy the Flask app to the image.COPY hello.py /# Run the Flask app.ENV FLASK_APP=hello
EXPOSE 8000CMD ["flask", "run", "--host", "0.0.0.0", "--port", "8000"]
then, run the following command to build your application image.
docker build --tag test:latest .
You can give any tag name here, for example awesome:v1.0.0, but
pick the one you can remember, as you will reference it when you
push it to the container registry.
The last '.' in the command
It’s called Docker build context and specifies
the location of the build environment, which in this case, composed
of Dockerfile and hello.py files shown above.
Now, your application image is ready. Let’s publish it to the container
registry next.
Push to registry
Repositories let you share container images to be downloaded by the devices.
In this section, we’ll use the Docker Hub as the container
registry, as it’s free and publicly accessible. Please consult your
container registry documentation in case you use other one.
Private container registries
You can deploy applications from the private registries on SPEKTRA Edge.
Please take a look at the private registries page
how to do it.
You can create a free account on Docker Hub. Please follow the
Docker Hub quickstart guide to create
one if you haven’t created.
Here is the simple step to publish your application to the Docker Hub:
Login to the Docker Hub:
docker login
Re-tag the image you build in the previous step to point to
the Docker Hub repository you own:
docker tag test:latest <hub-user>/<repo-name>:<tag>
Push the image to the registry:
docker push <hub-user>/<repo-name>:<tag>
Please consult the official Docker documentation if
you get error with those commands.
Next step
Once you develop your application and publish it to the registry,
it’s time to deploy it on your device. Please move on to the deployment
document next.
3 -
Deploy the application
Once you developed and published your application to the container registry,
as in the previous section, now is time to deploy your application
on your device.
SPEKTRA Edge provides the Docker compose environment
on your device so that you can declare your application in the standard
Docker compose file format to run it on your device.
Let’s create a compose.yaml file for the application we developed
in the previous section and deploy it on your device through
the SPEKTRA Edge dashboard.
Private Container Registries
Please take a look at the private registry section
in case you use the private container registries, such as Amazon Elastic Container
Registry, Azure Container Registry, or Google Artifact Registry.
What you need
To deploy your application on your device, you need:
The Docker compose environment on your local
machine for the local verification
A device provisioned through the SPEKTRA Edge dashboard
And also, the cuttle CLI command is necessary to complete this tutorial,
which is used to access the application from the local machine for the
verification purpose. However, it is not required for deploying applications
on SPEKTRA Edge.
Device Provisioning
Please go through the getting started guide
if you haven’t done that.
Local verification
Let’s create and verify compose.yaml file on your local machine.
compose.yaml
Here is the compose.yaml file to deploy the
application we developed in the previous section.
This is the top level element of the compose file to abstract
the definition of a computing resource within an application which
can be scaled or replaced independently from other components.
The ports is used to define the port mappings between the host machine
and the containers. This is crucial for allowing external access to
service running inside containers.
This example exposes the container application’s port 8000 to be
accessible through the local machine’s port 8000.
Please take a look at the official document for
the ports attribute definition.
docker compose up
With the compose.yaml file ready on your local machine, run
docker compose up command in the directory where the file
locates:
$ tree .
.
└── compose.yaml

1 directory, 1 file
$ docker compose up
[+] Running 2/0
✔ Network sample_default Created 0.0s
✔ Container sample-app-1 Created 0.0s
Attaching to app-1
app-1 | * Serving Flask app 'hello'app-1 | * Debug mode: off
app-1 | WARNING: This is a development server. Do not use it in a production deployment. Use a production WSGI server instead.
app-1 | * Running on all addresses (0.0.0.0)app-1 | * Running on http://127.0.0.1:8000
app-1 | * Running on http://172.20.0.2:8000
app-1 | Press CTRL+C to quit
Here you can see the application running and listening on the port
8000 on your local machine.
With the compose.yaml ready, let’s deploy your application on your device
through the SPEKTRA Edge dashboard.
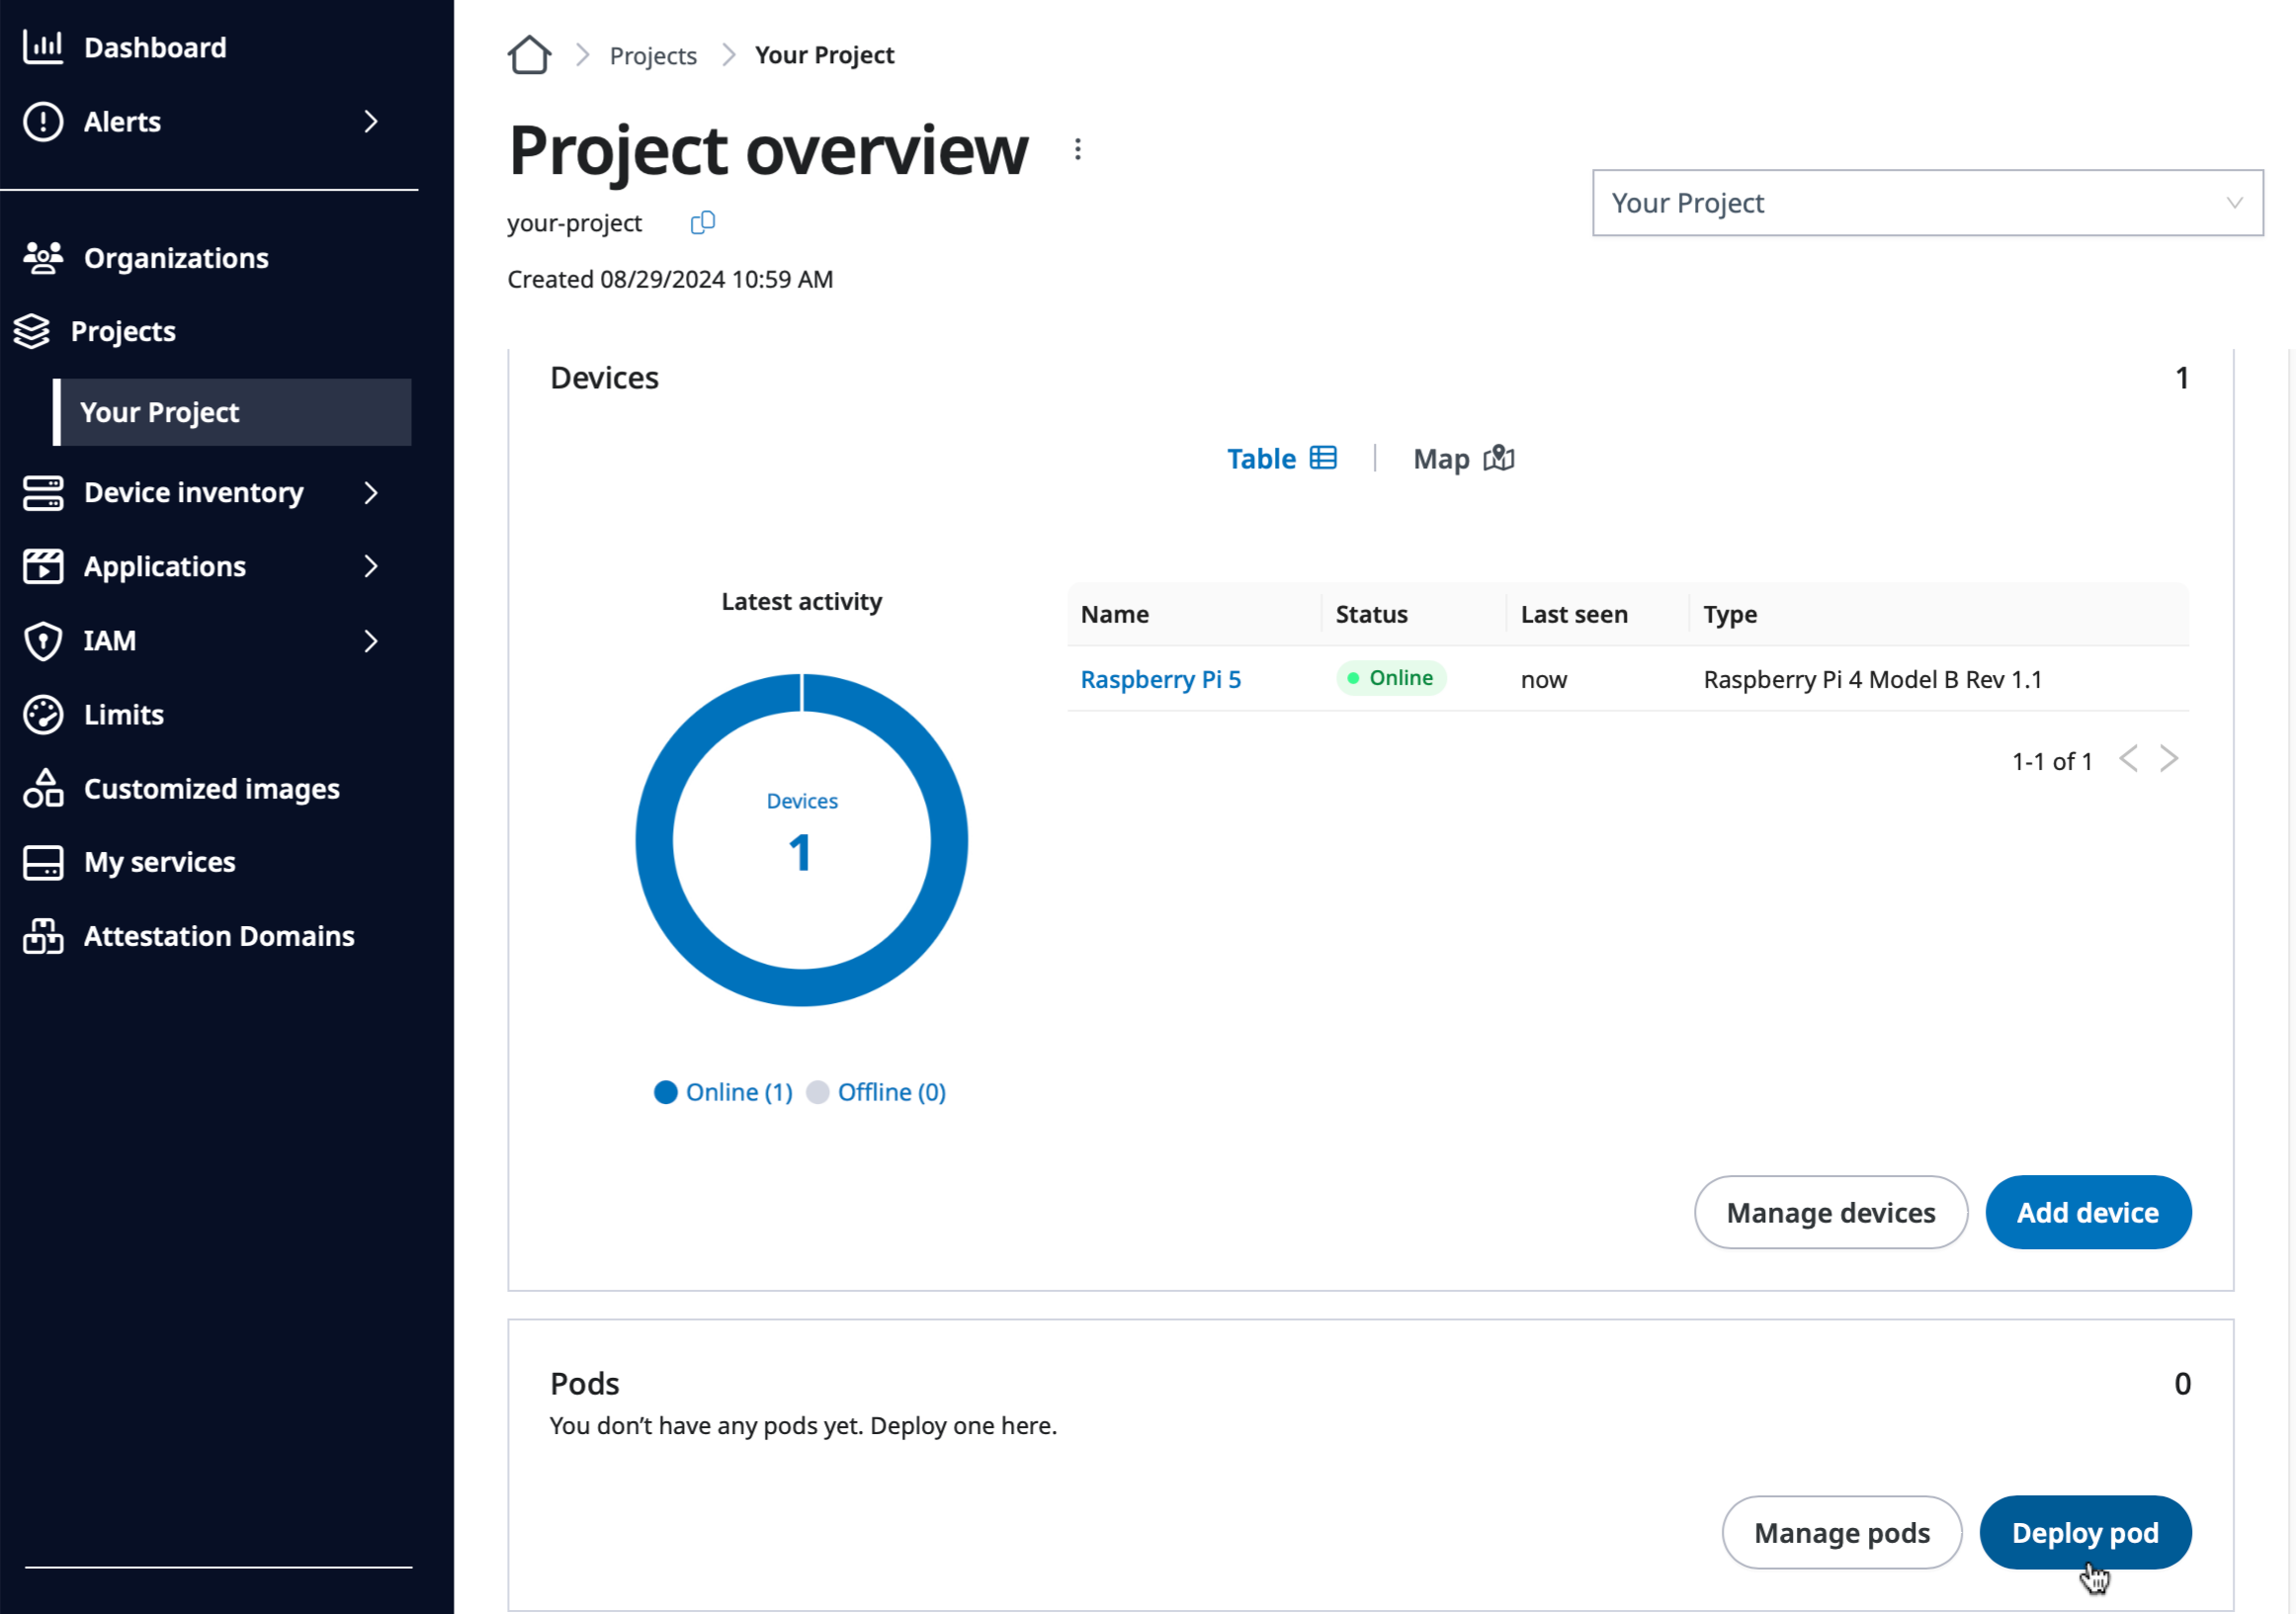
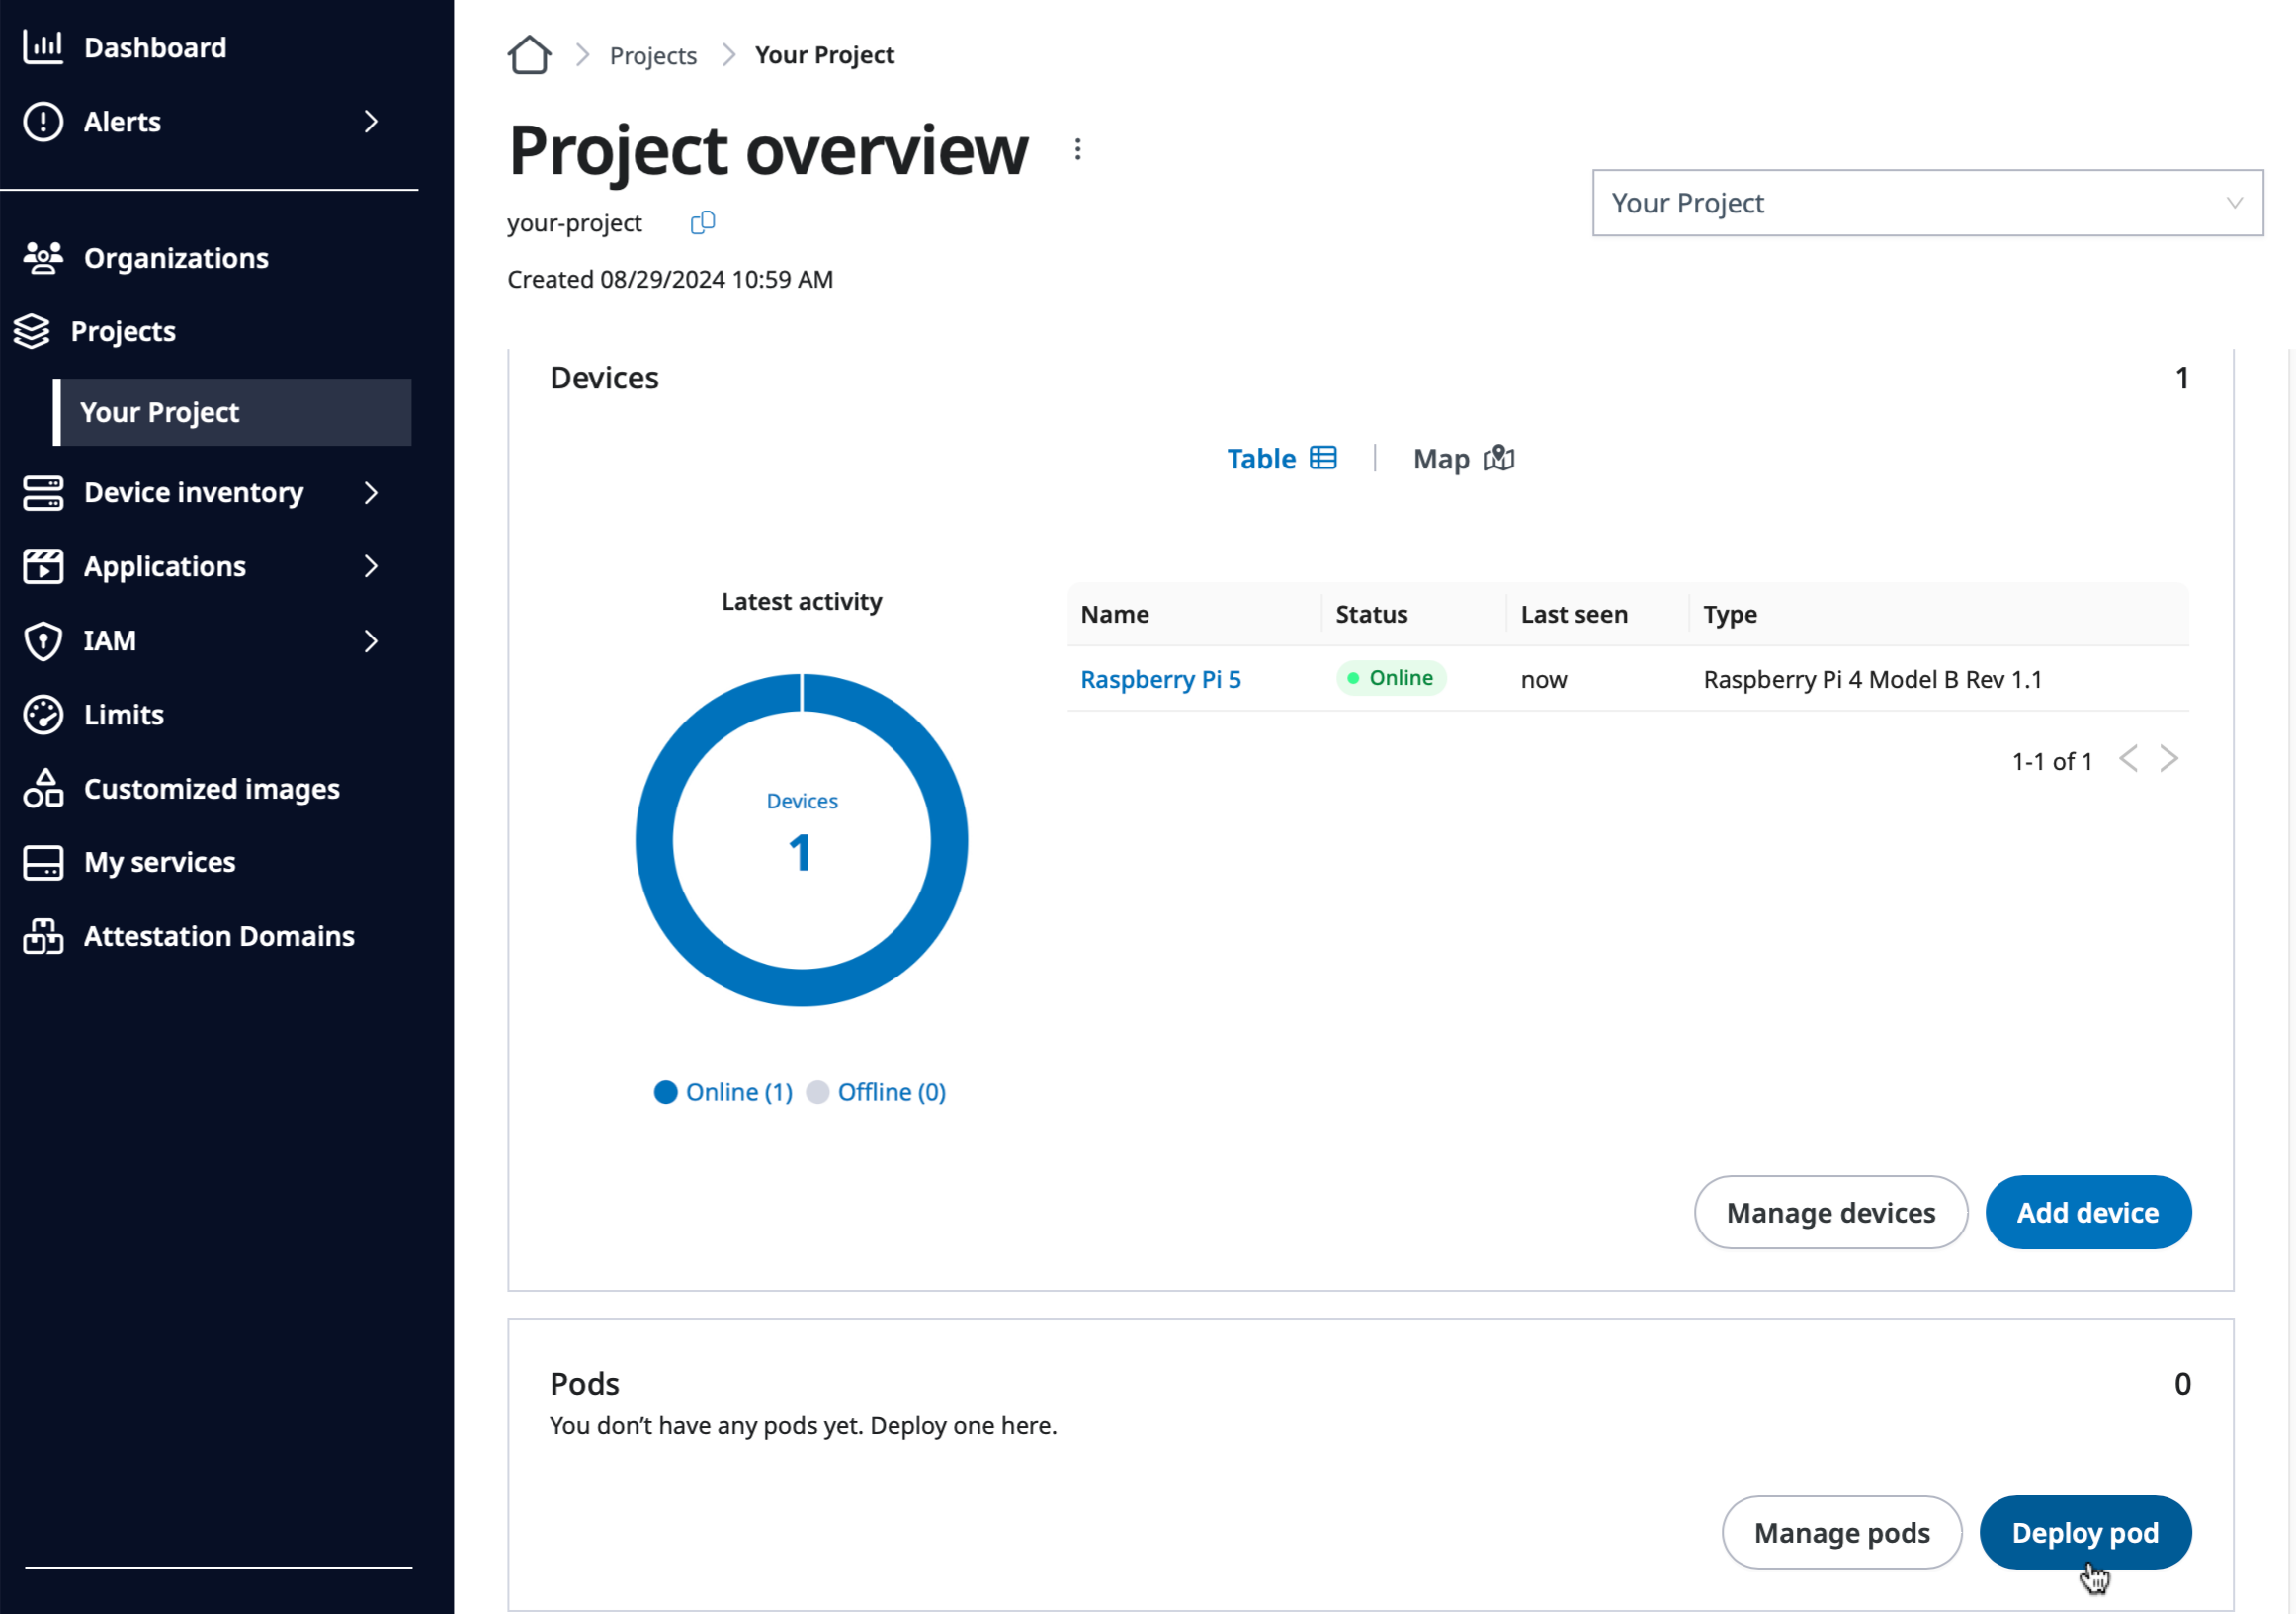
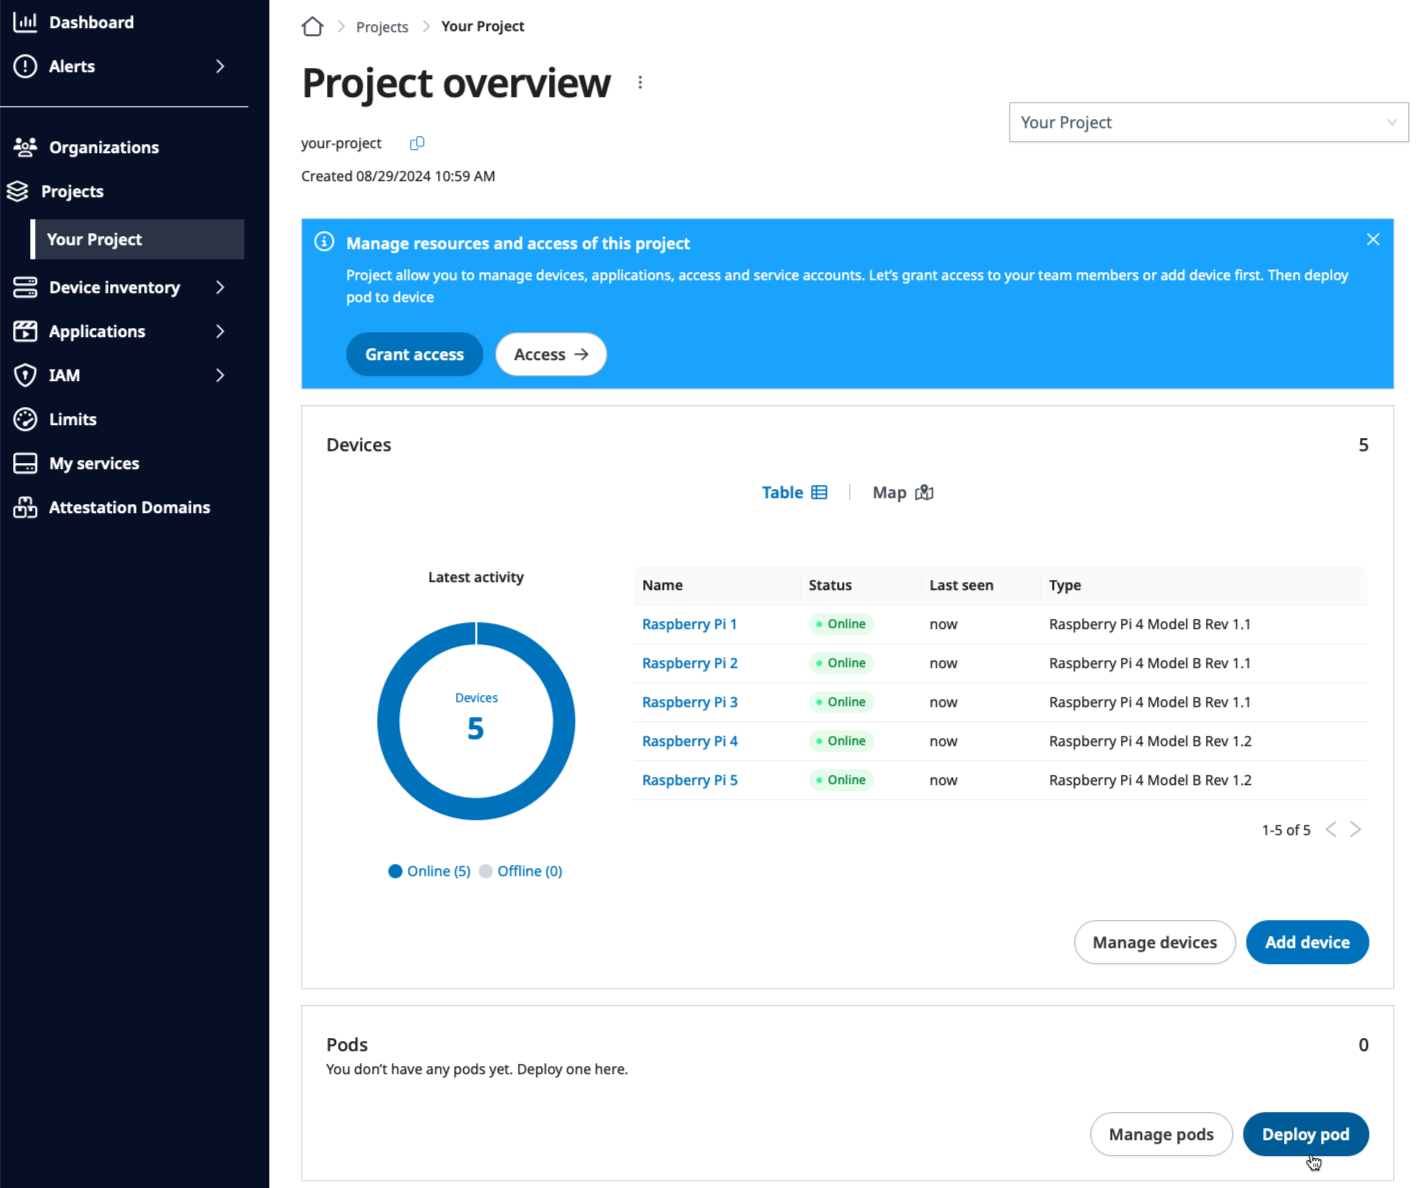
Go to the project overview page and click Deploy pod.
Deploy pod button on the Project overview page.
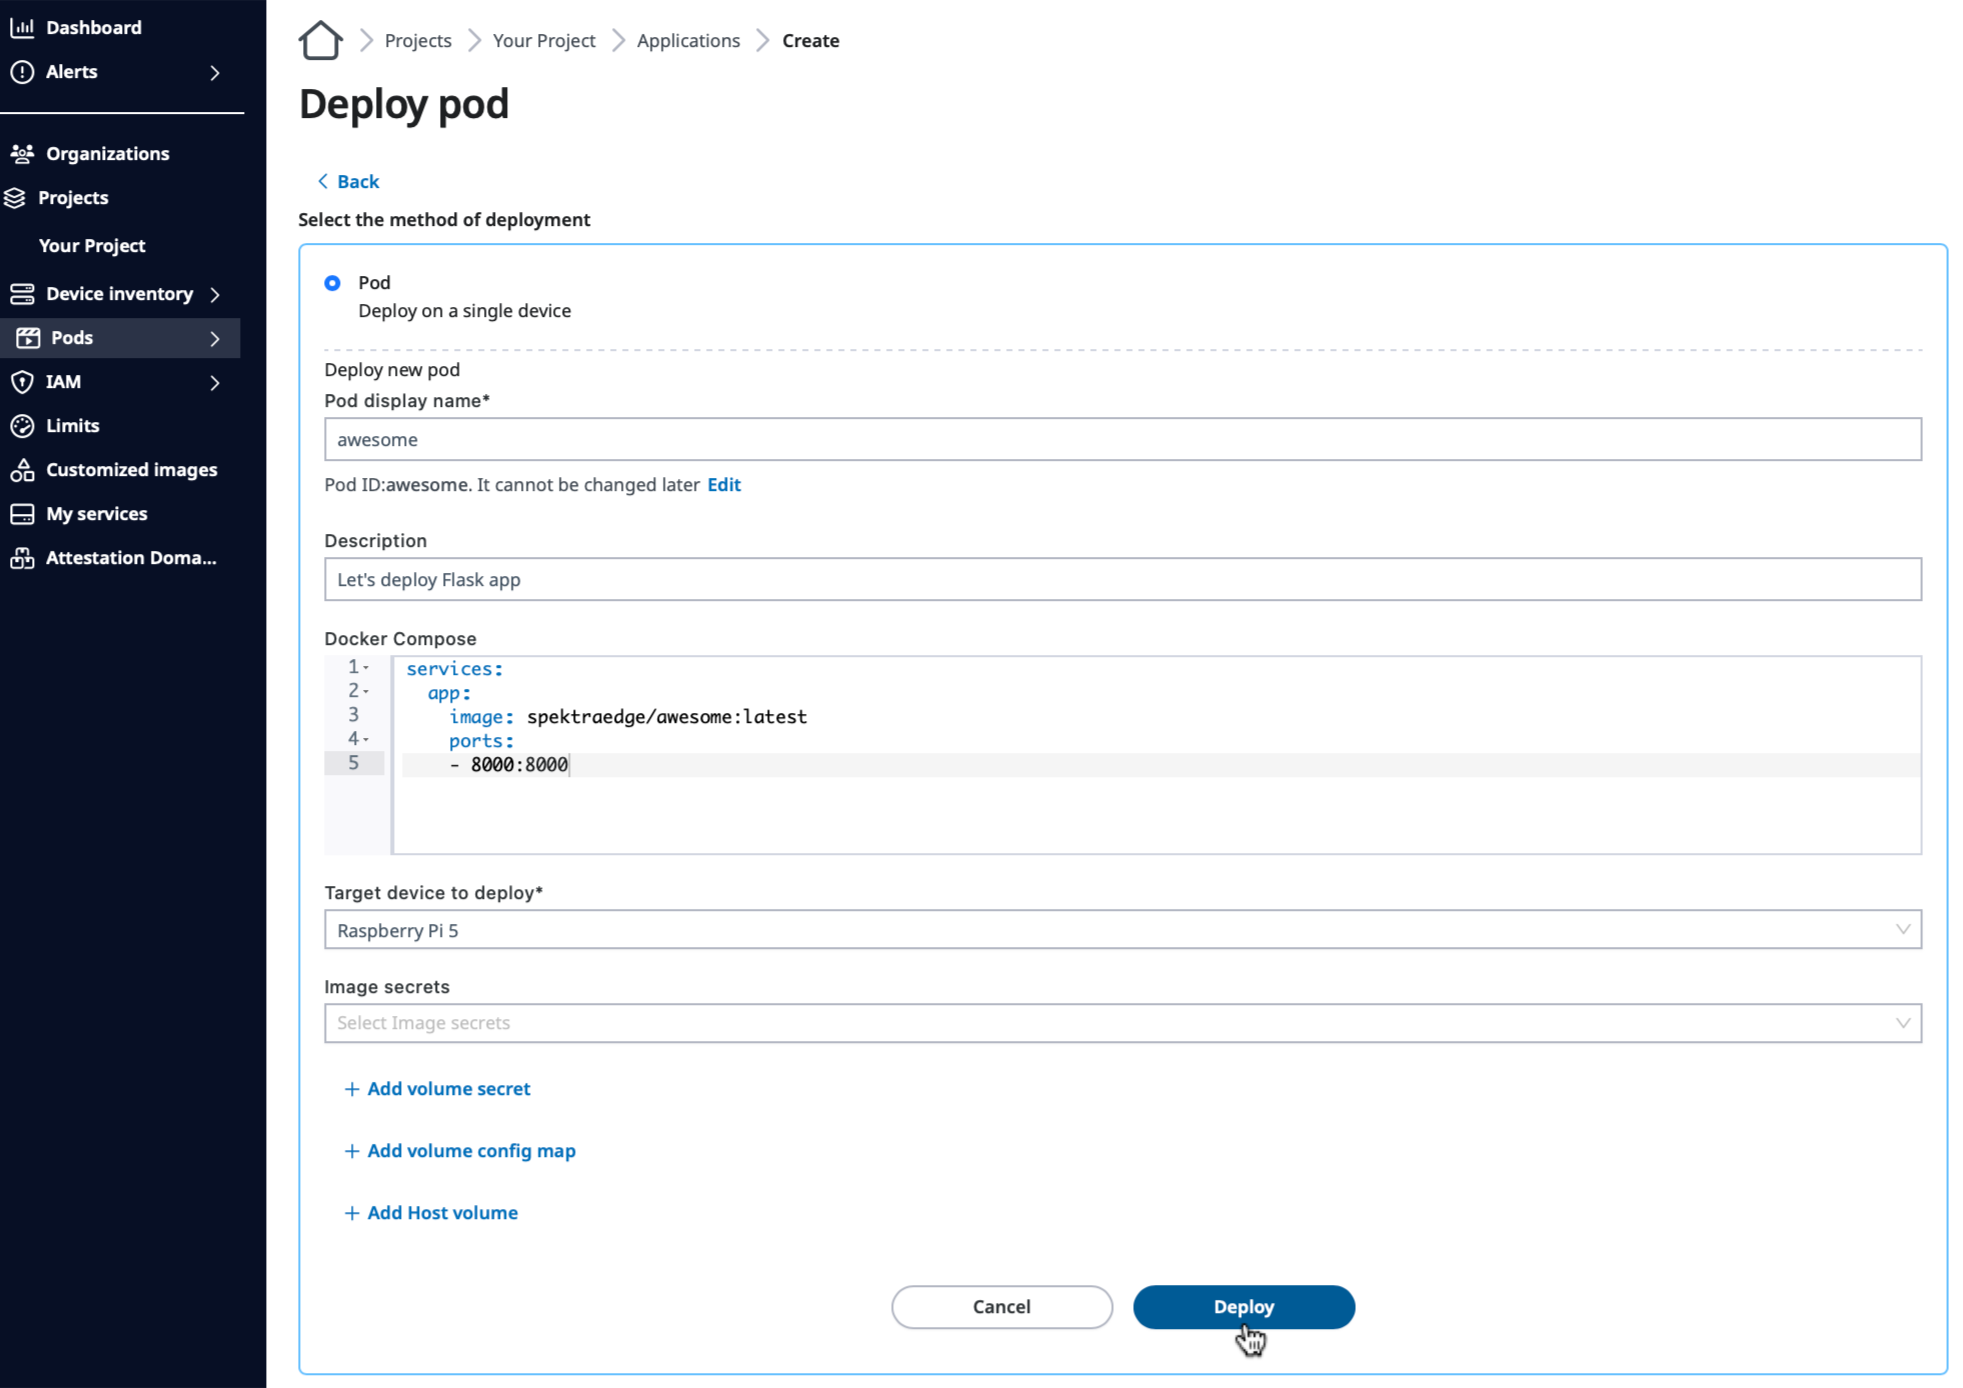
Select Deploy on a single device option and provide the following
information.
Application name
Application description
Docker compose, compose.yaml file for your reference
Target device to deploy
Deploy on multiple devices
You can deploy applications on multiple devices on SPEKTRA Edge. Please
take a look at the multiple devices page for more detail.
Then, click Deploy to deploy your application.
Deploy button on the Deploy pod page.
Congratulations!
You now deployed your application on your device through the SPEKTRA Edge
dashboard.
Verify your application
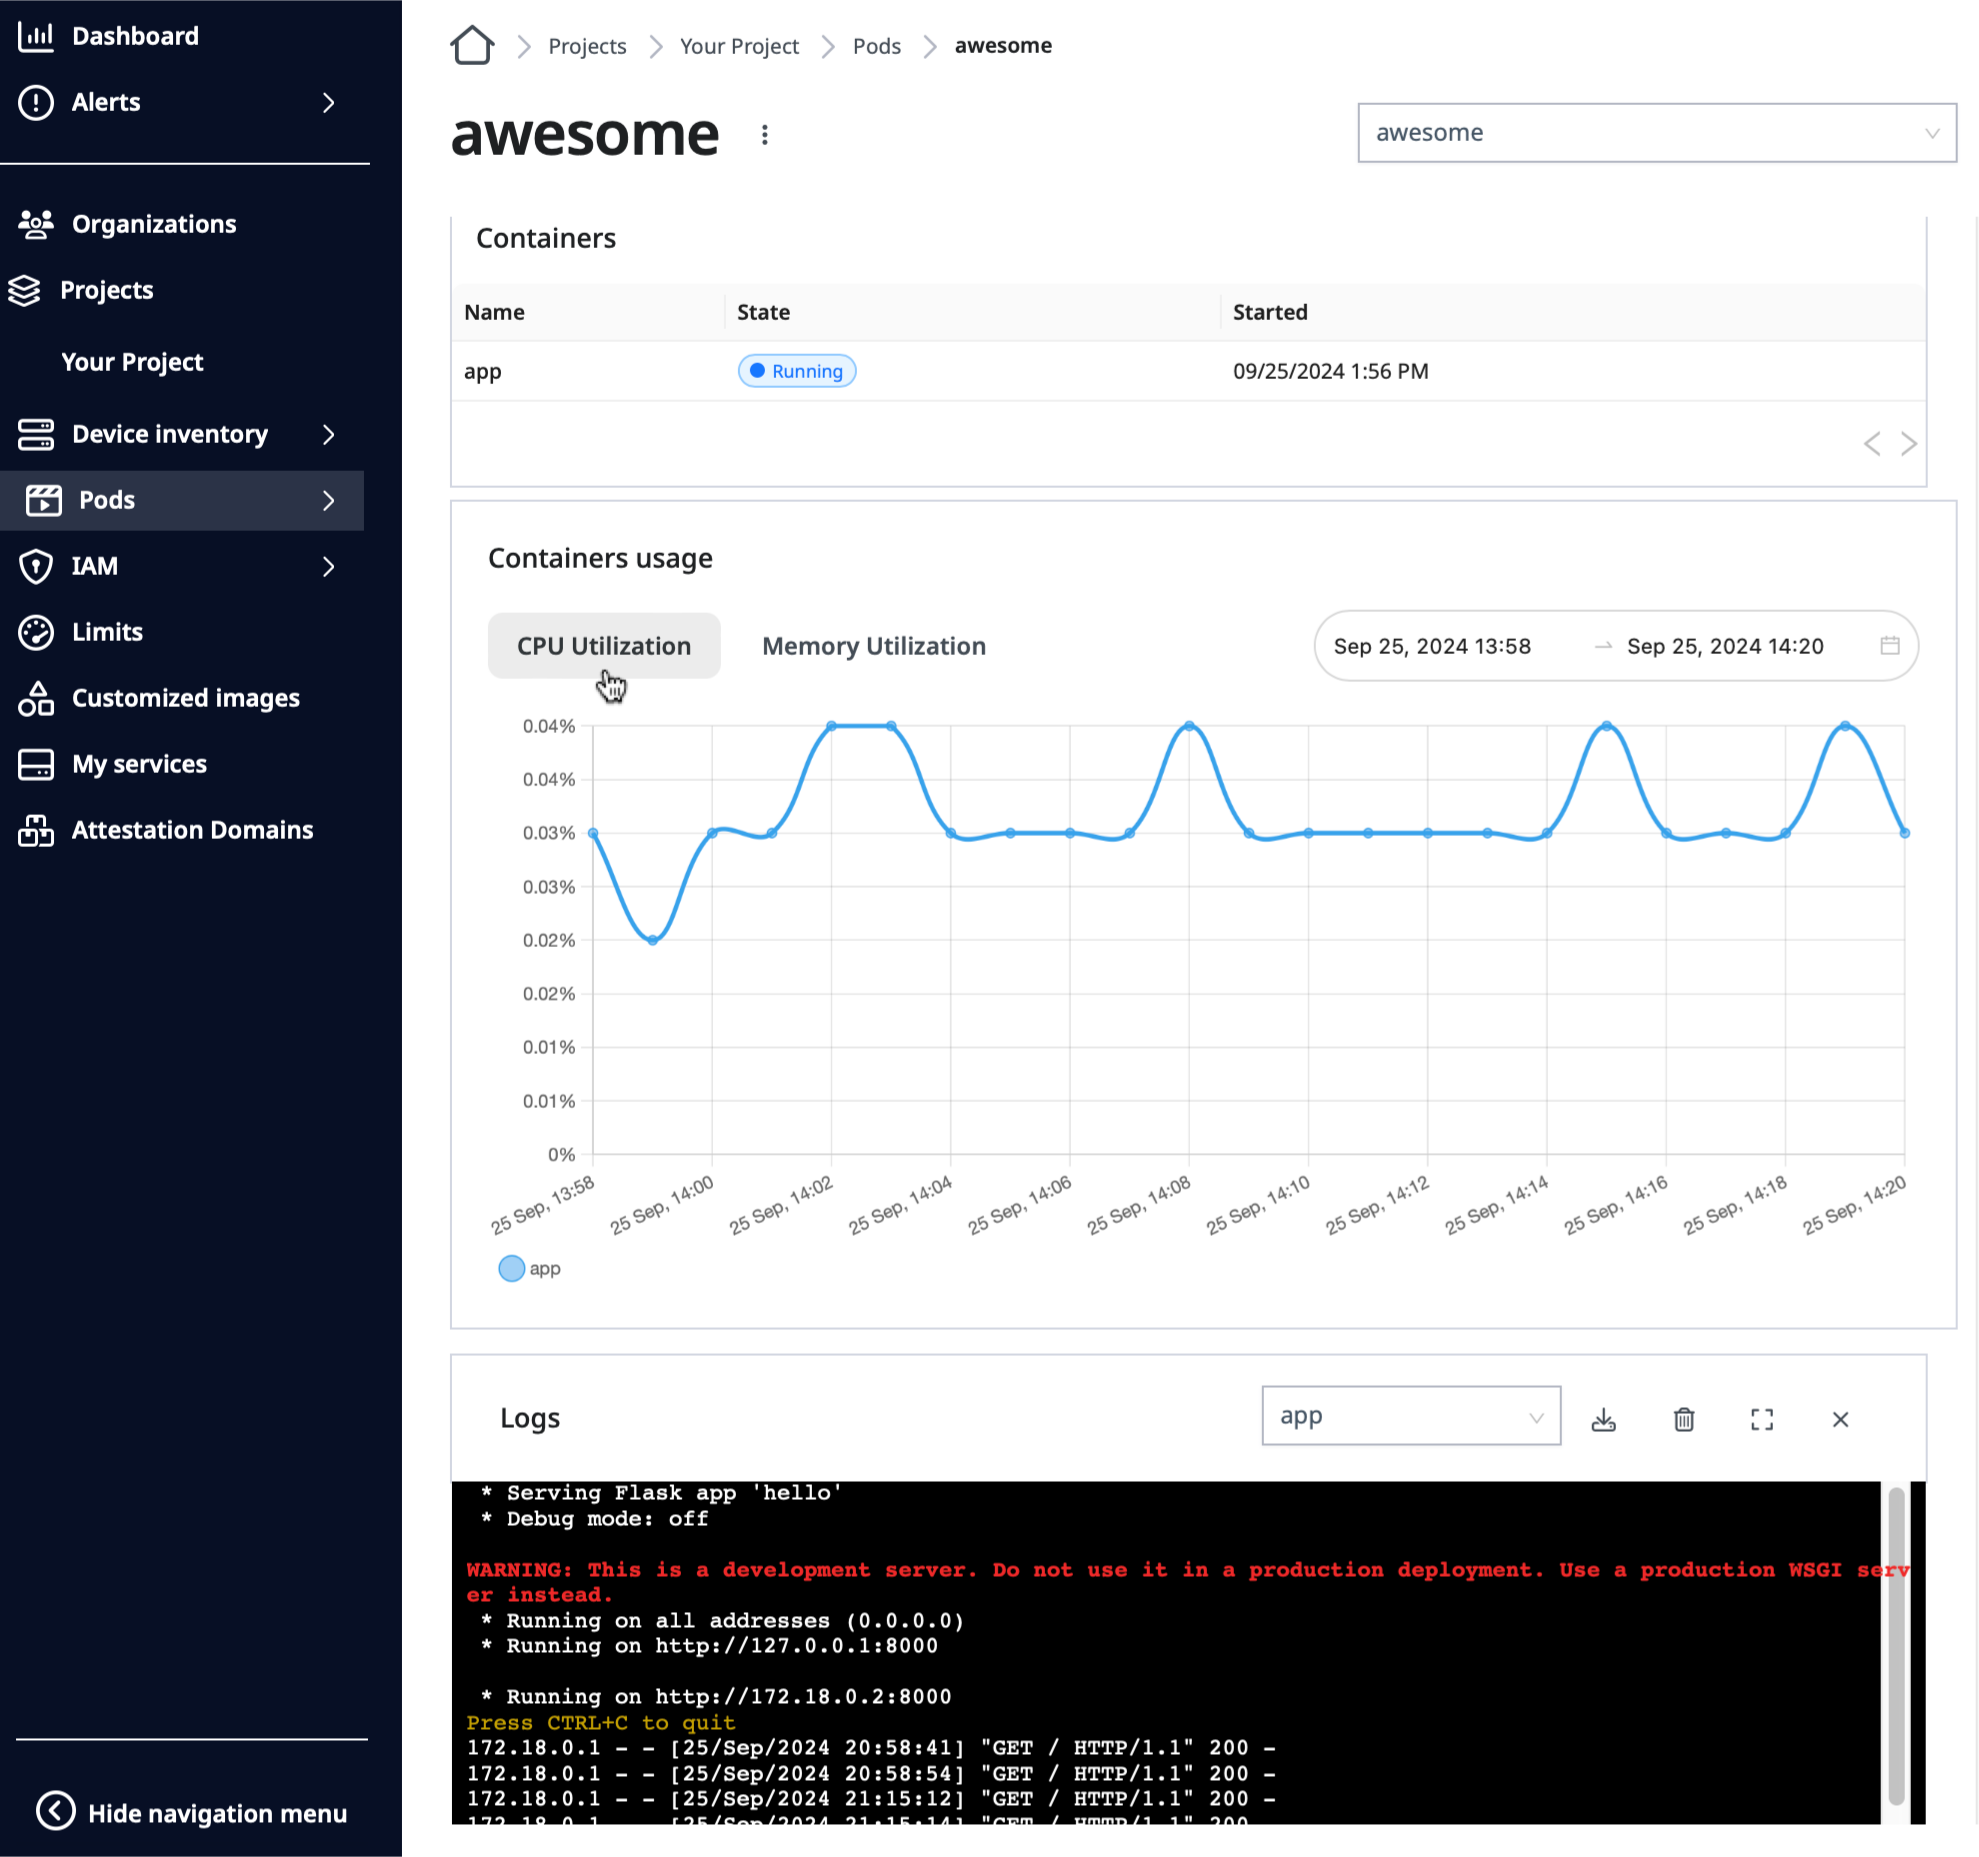
You can verify your application’s health from the SPEKTRA Edge dashboard.
The application page provides the following statistics:
Application’s overall status
Each container’s status
Each container’s CPU utilization
Each container’s memory utilization
Application’s logs
CPU Utilization button on the Application page.
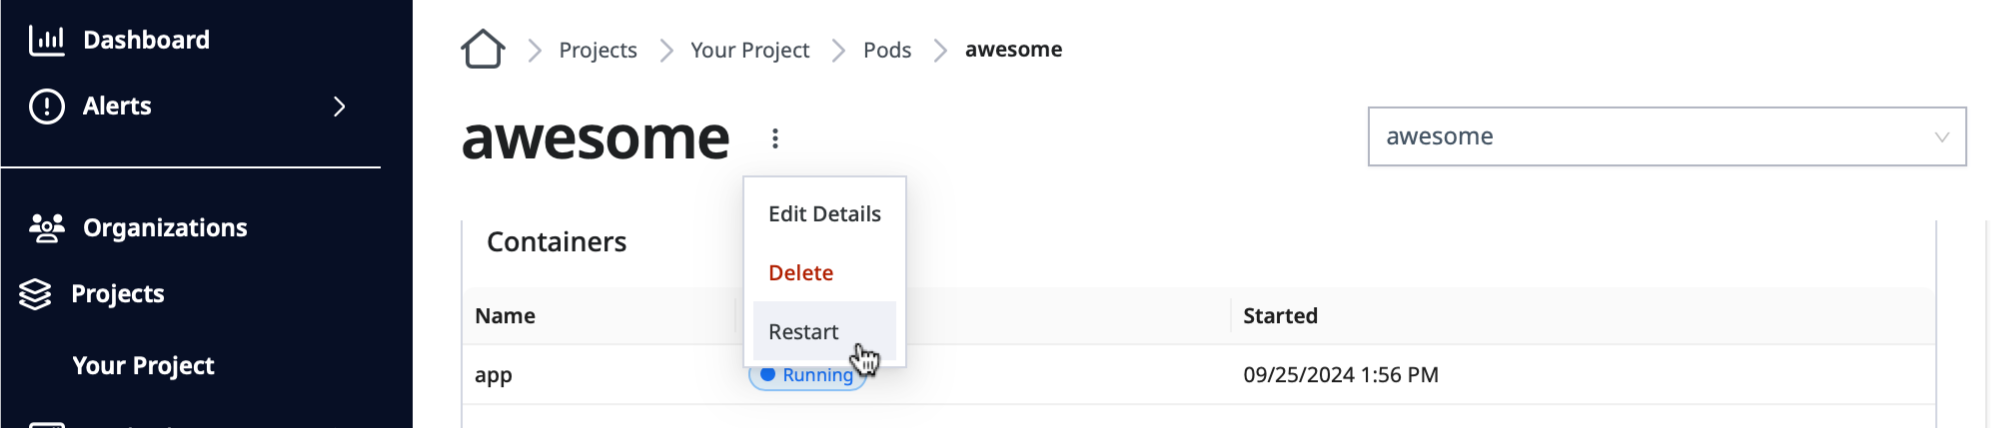
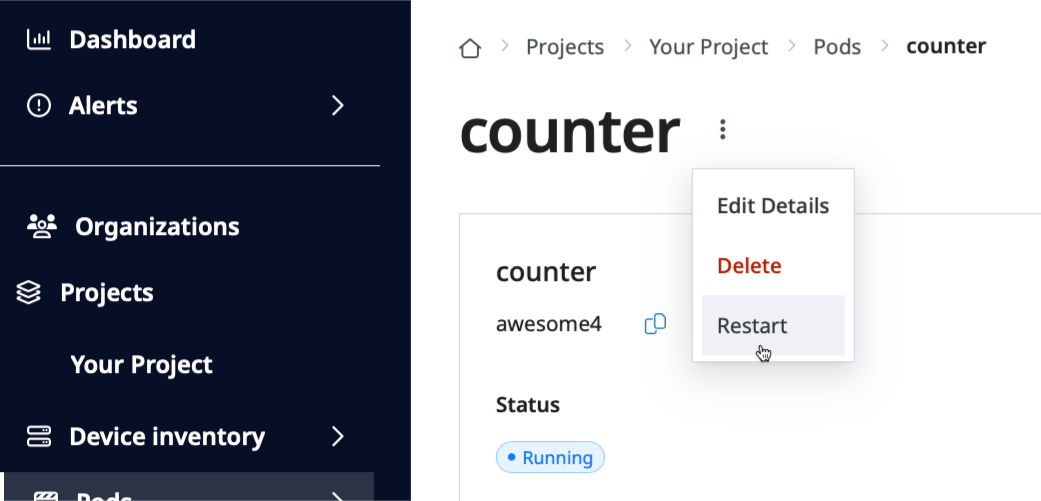
You can also restart the application by clicking the Restart option
of the drop down menu right next to the application’s name:
Restart option on the Application pull-down menu.
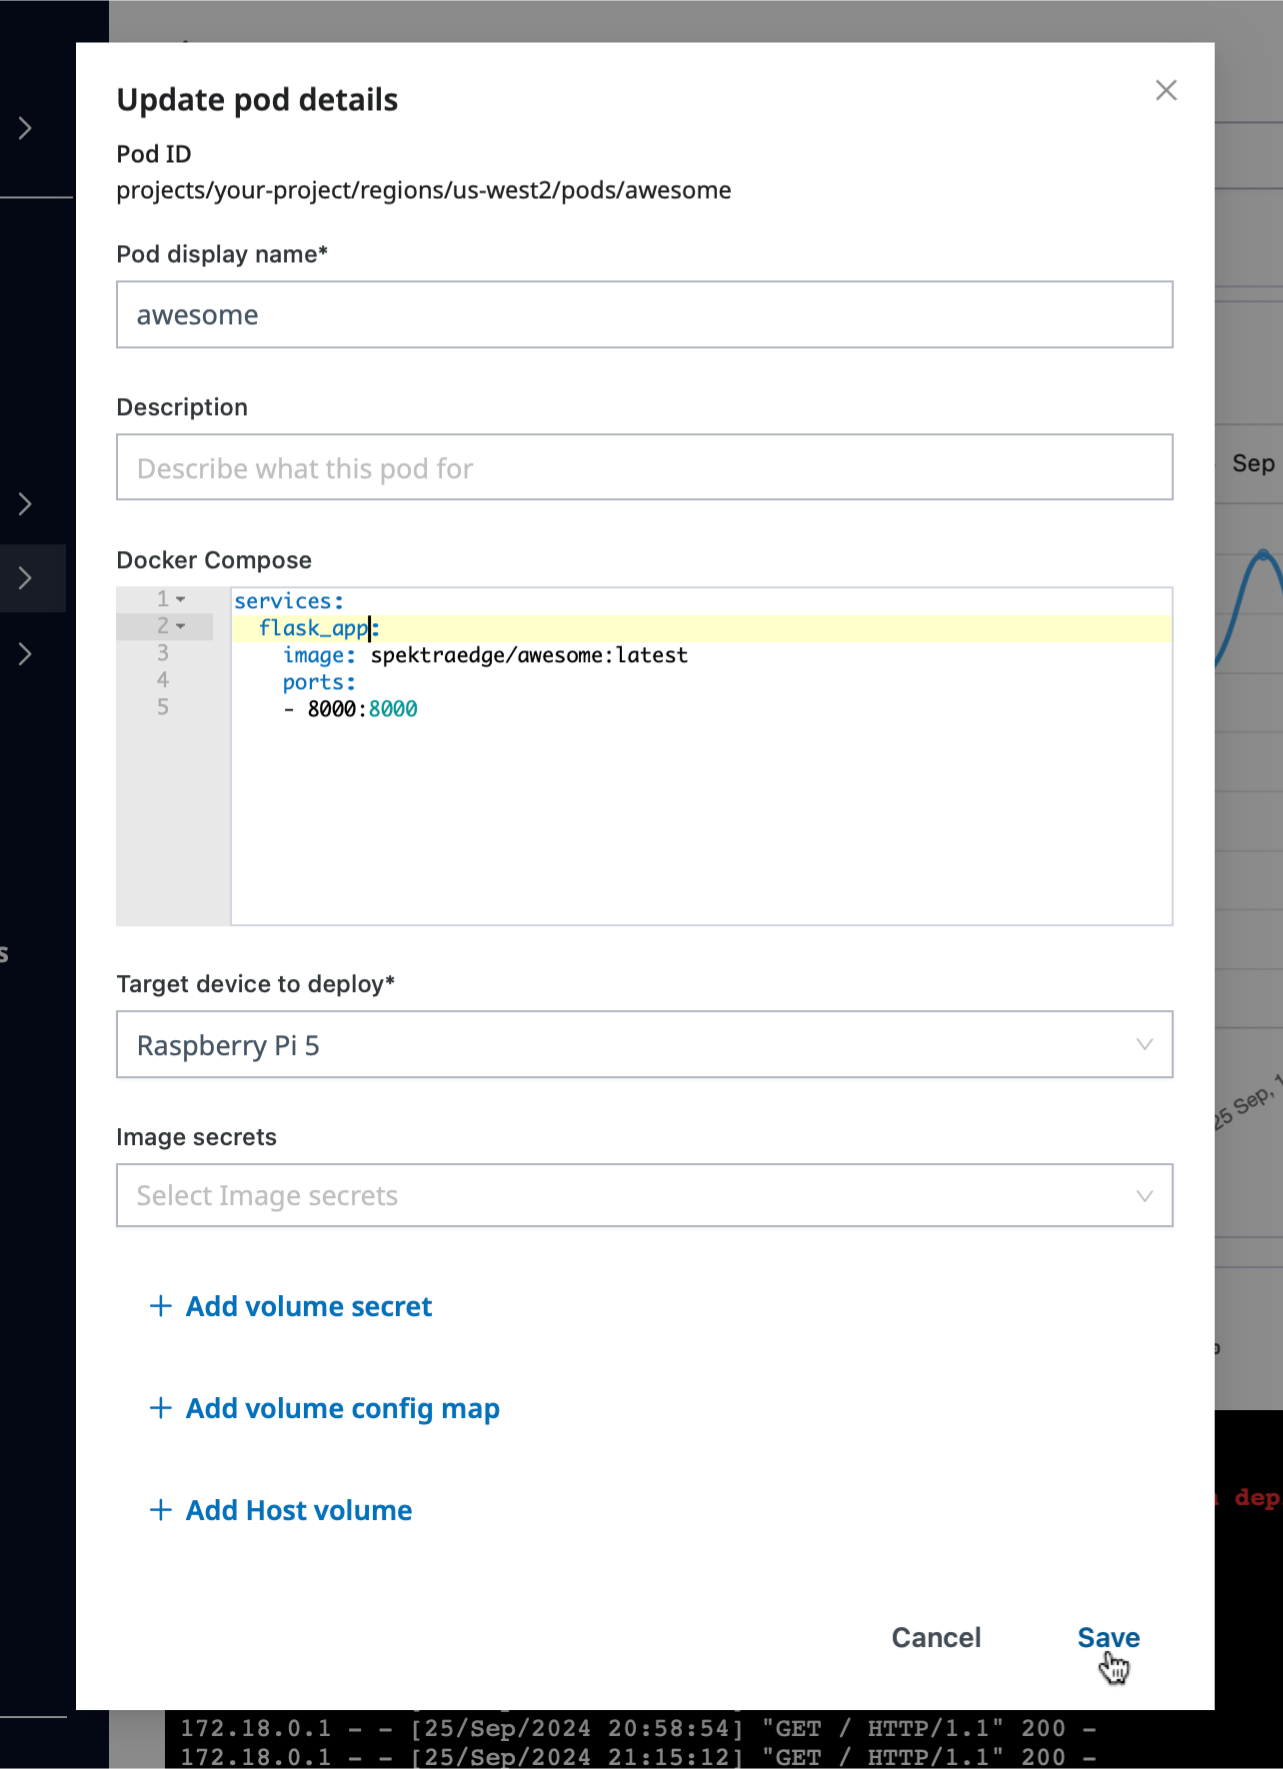
Or you can edit the applications, e.g. compose.yaml, by clicking the
Edit option of the drop down menu right next to the application’s name:
Editting Docker compose file in the Update pod details pane.
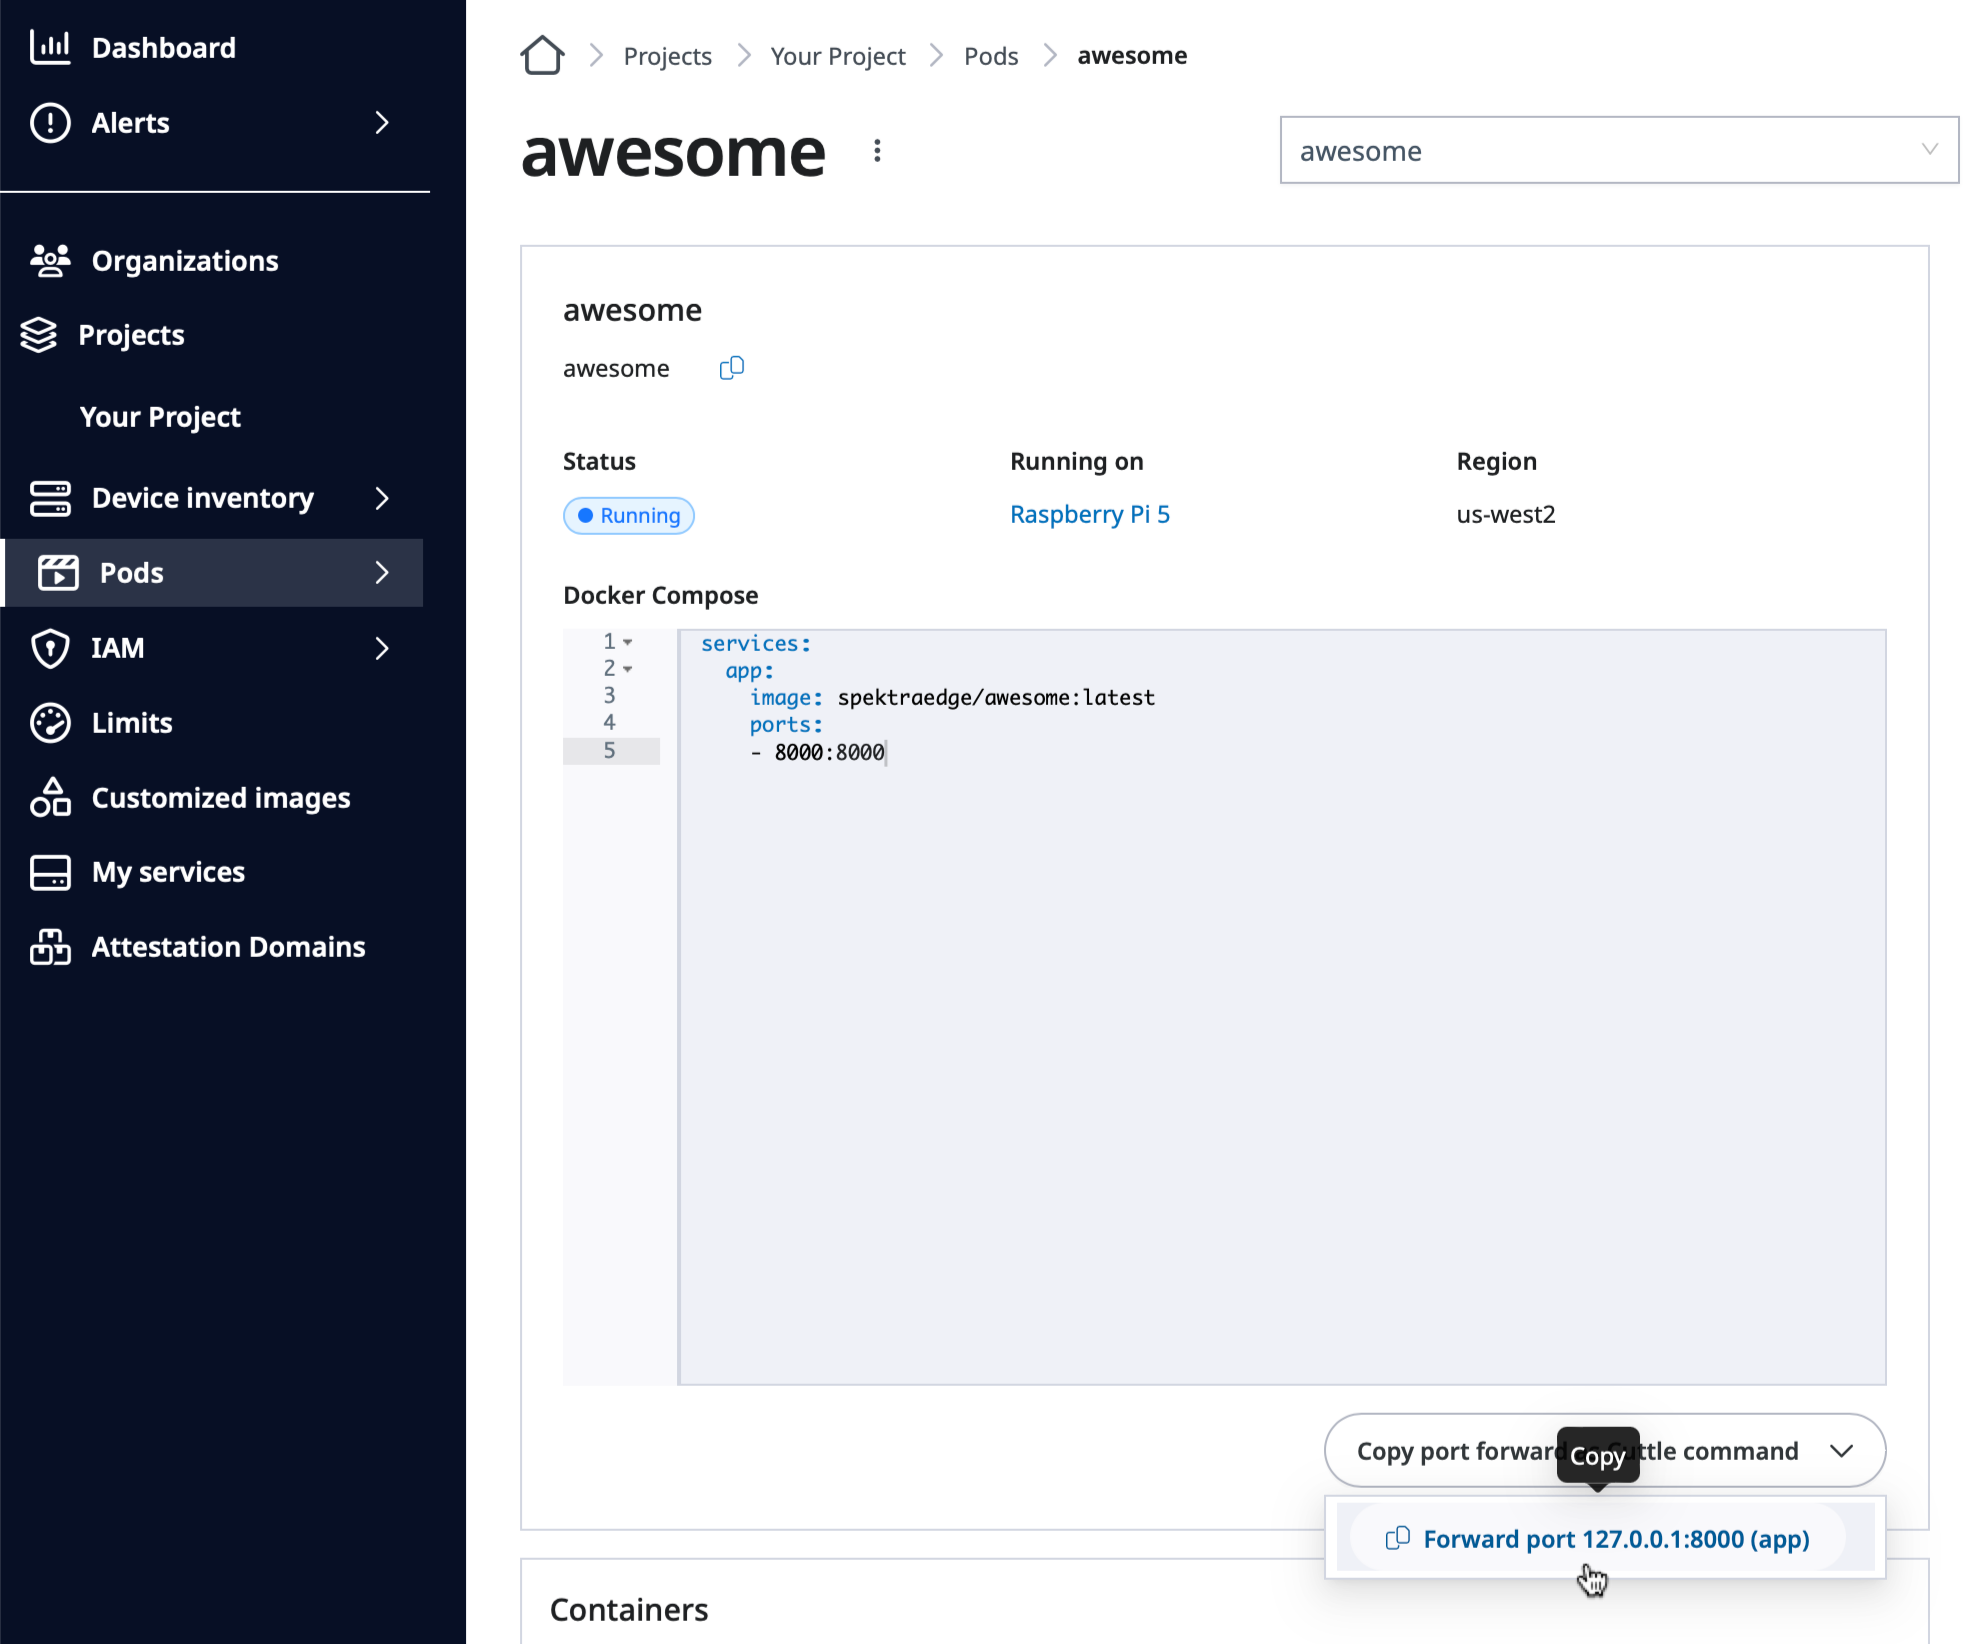
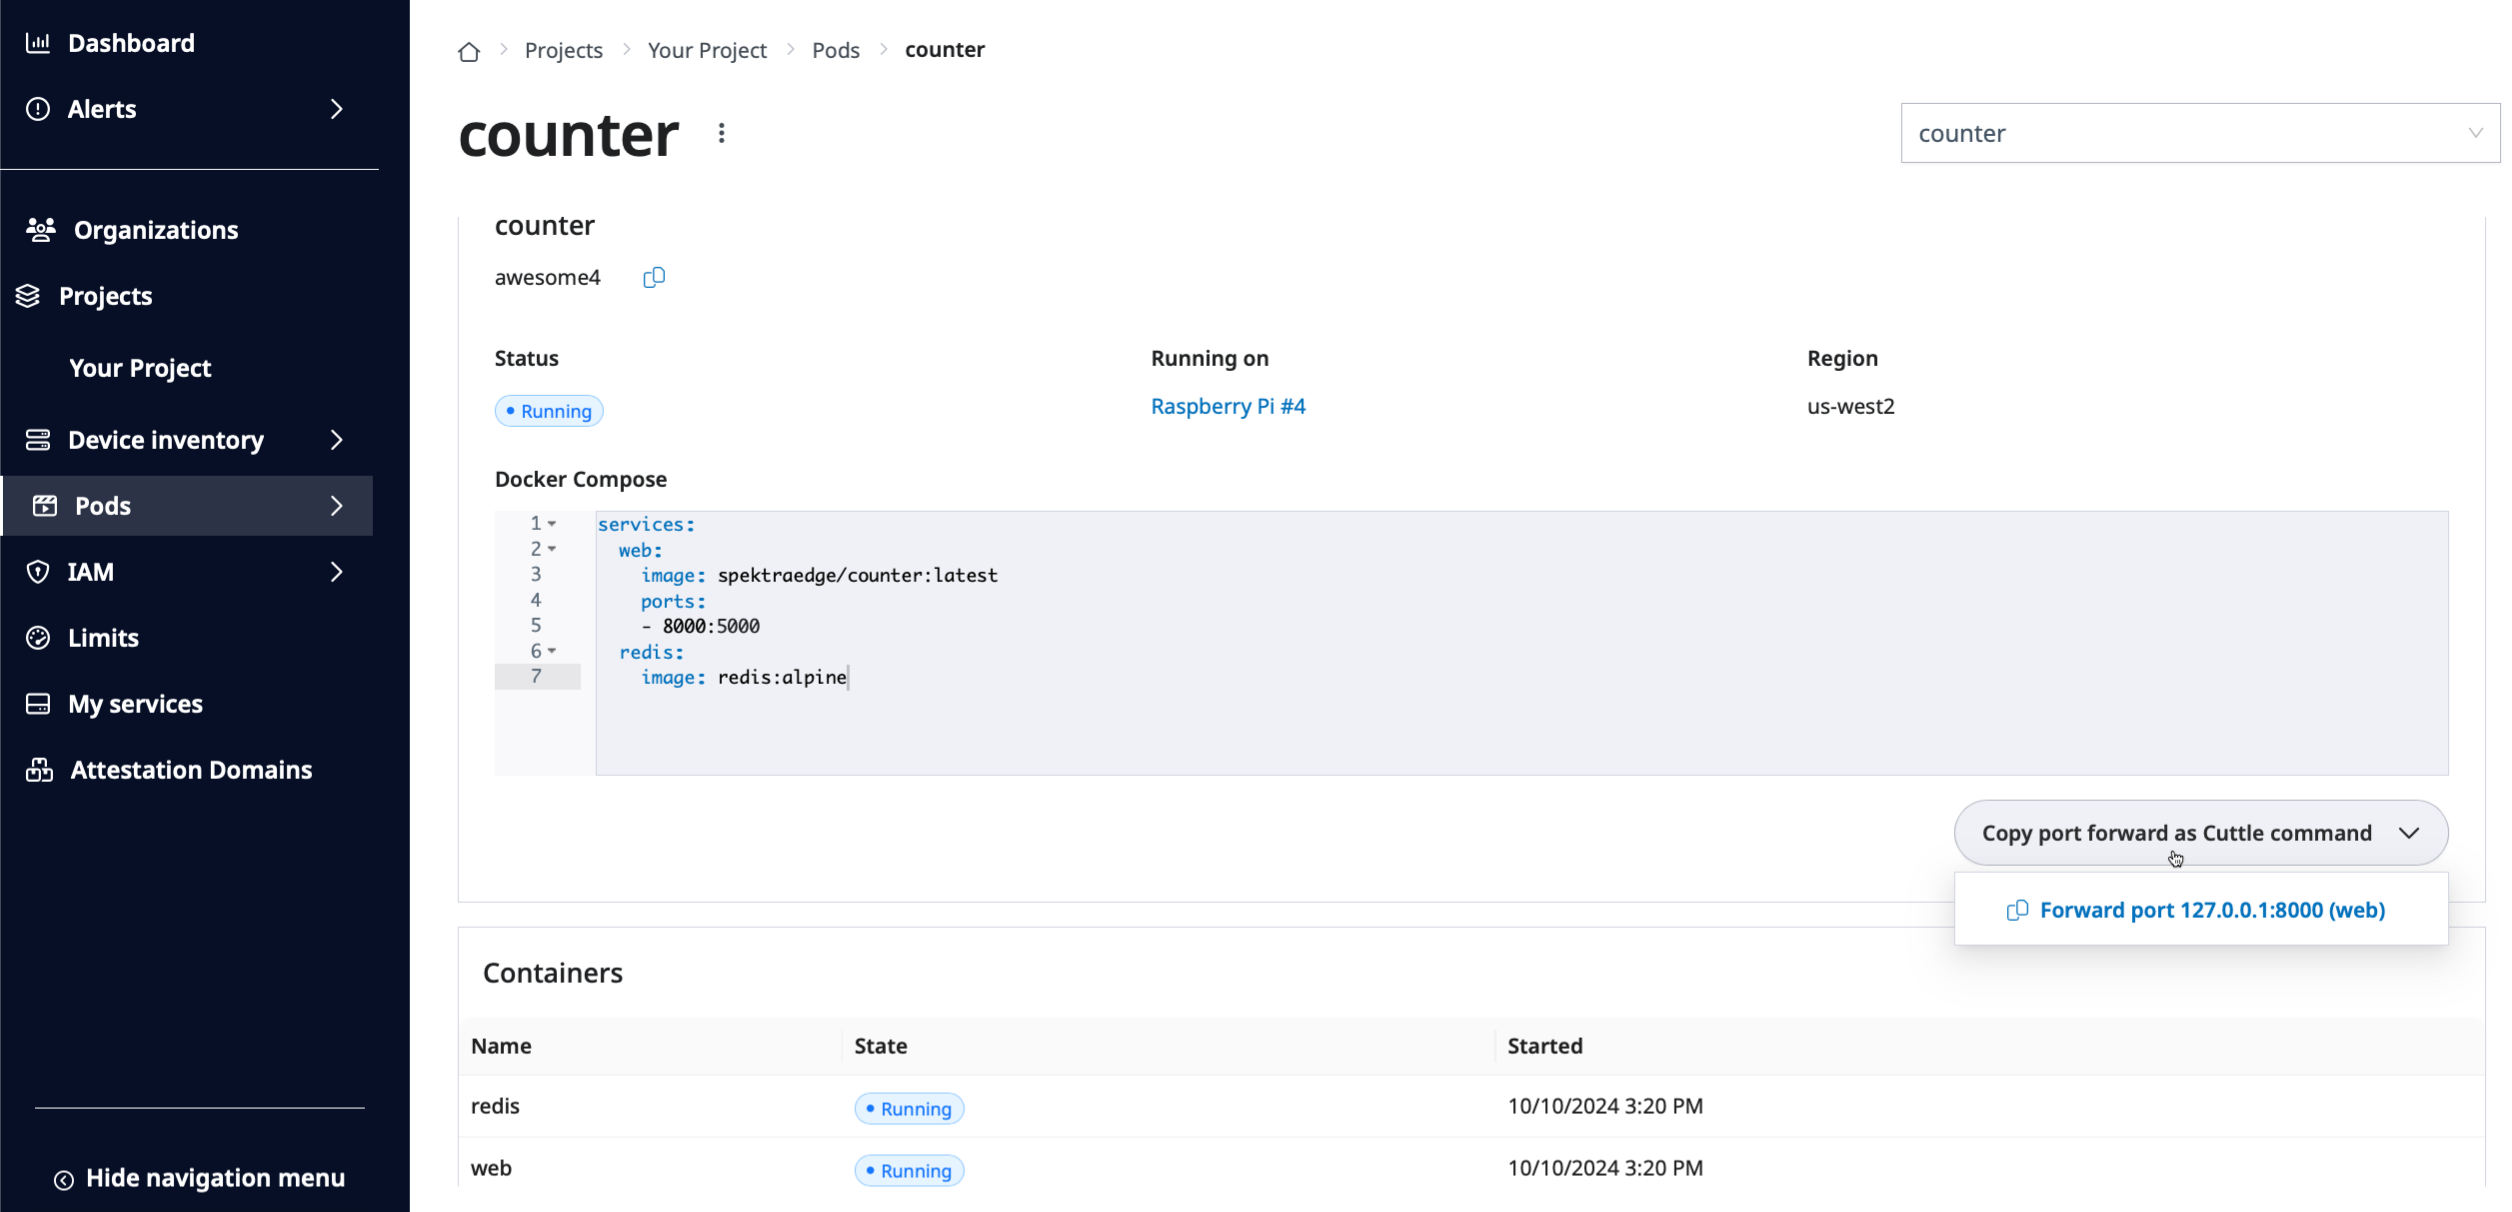
Now, let’s access your application from your local machine by
utilizing the SPEKTRA Edge port-forwarding feature. Simply copy
the cuttle command provided by the dashboard located under
the Docker compose section:
Copy Port forward command option on the Application page.
Open the terminal on your local machine. Paste the command you just copied
onto your terminal and run it to enable the port-fowarding to access your
application from the local machine.
Here is the example port-forward command for your reference. It enables
your application, which is listening on device’s port 8000, reachable
through your local machine’s port 8000.
With the above port-forwarding command running, point your browser to
http://localhost:8000 to access your
application from your local machine.
You will get the same result you got during the local verification.
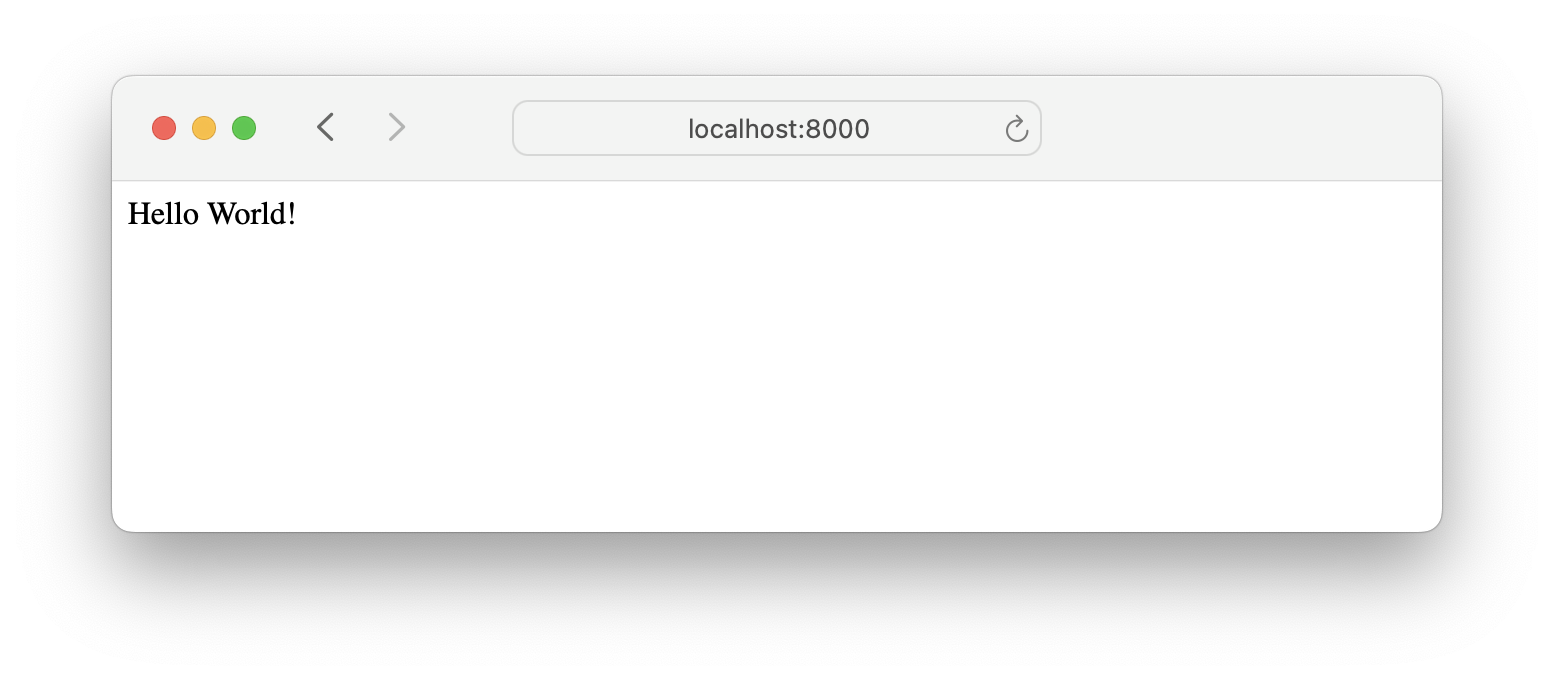
Successfully accessing the application running on your device.
Next step
With the application deployed on your device, let’s learn how to
monitor and control applications on SPEKTRA Edge.
3.1 -
Configure applications via configuration maps
Let’s learn how to configure applications via configuration maps on SPEKTRA Edge.
A configuration map allows you to decouple environment-specific configuration
from your application images, so that your applications are easily portable.
You can map the application configuration to the particular containers under
the application with the following steps:
Create an application with docker compose volumes service attribute
to describe the configuration to be mounted on the container
through the following two in-direction:
Host volume to mount the configuration to the host
environment so that the application can mount the configuration to
the particular container.
We’ll use the Nginx application and source the configuration file through the
configuration map to demonstrate how to use the configuration map on SPEKTRA Edge.
And also, the cuttle CLI command is necessary to complete this tutorial,
which is used to access the Nginx application from the local machine for the
verification purpose. However, it is not required for deploying applications
on SPEKTRA Edge.
Note
The getting started guide will help you to set
those requirements up. Please go through the guide in case if you
miss some of those.
Application files
compose.yaml
It’s a simple Nginx application with mapping the port 8000 with the configuration
directory mounted through the volumes attributes.
We recommend to use the /isodevice/data directory as the host side of the
volume mount entry point. It’s a persistent file system and will keep the mapped
contents even through the power cycle.
nginx.conf
Here is the Nginx configuration file, which will be mapped to the application
through the SPEKTRA Edge configuration map.
It’s a simple configuration file, which make it listen on the port 8000,
instead of port 80. Since we override the default configuration, we also
sets the content root to the default Ngnix content directory with root
directive.
server {
listen8000;
root/usr/share/nginx/html;
}
Nginx beginner's guide
Please take a look at the Nginx beginner’s guide if you are not
familier with the Nginx configuration file format.
Deploy the application
Let’s deploy the application with the configuration map on SPEKTRA Edge.
the host volume to mount the configuration to the host
environment for the load balancer container to mount the configuration
file to.
Let’s do it.
Create a configuration map
Let’s create a configuration map to store the Nginx configuration file
on SPEKTRA Edge.
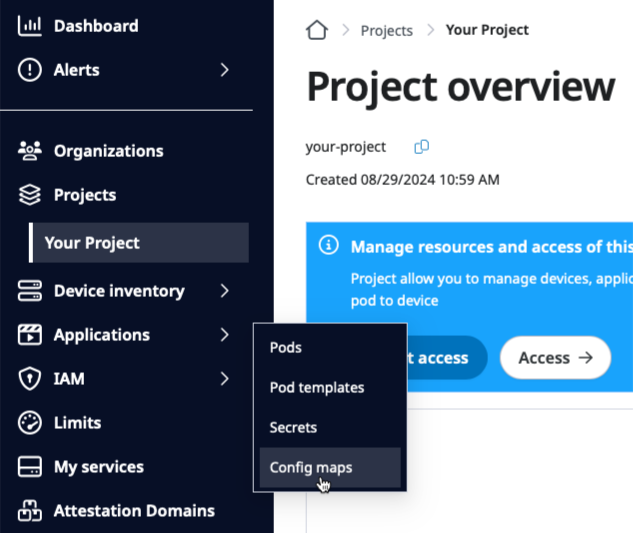
First, select the Config maps option of the Applications pull-down menu.
Select Config maps option from the Applications pull-down menu.
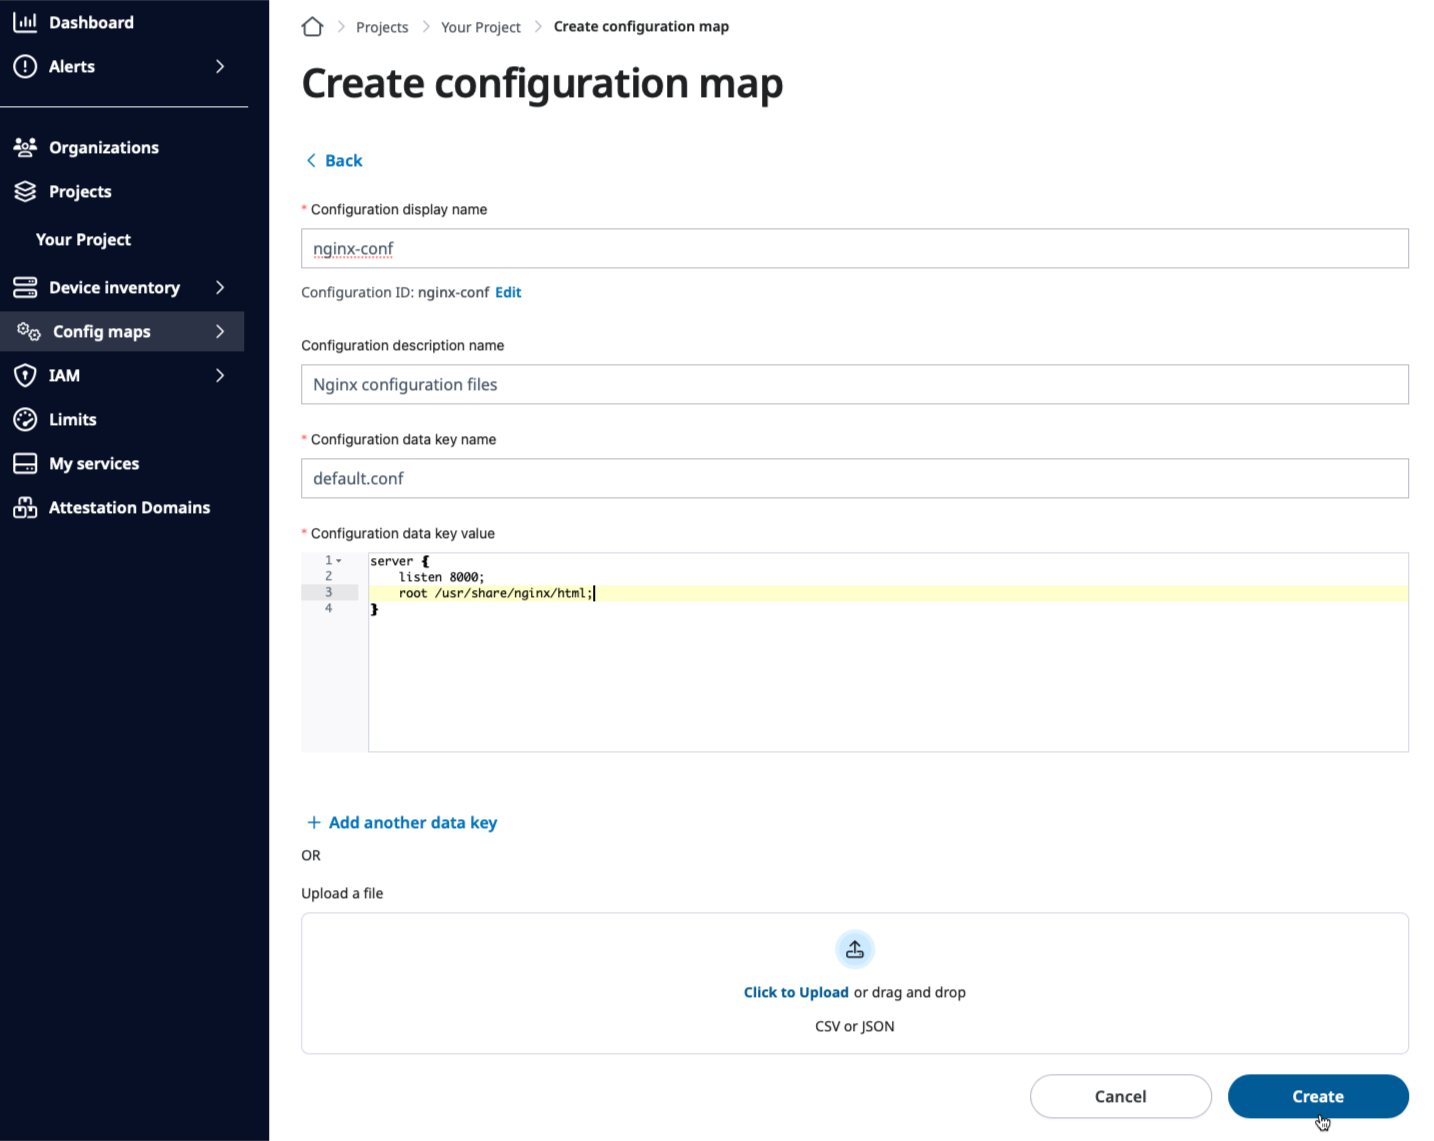
Then, create a configuration map by pasting the nginx.conf file
content in the data key value field with the default.conf as the data key name.
Create configuration map by pasting the nginx.conf content in the data key value field.
Make sure you set:
nginx-conf as the configuration map name
default.conf as the configuration data key name
Those names are important because it’s referenced by the other object in
the later steps.
Create the application
With the Nginx configuration map ready, let’s deploy the application.
Here is what we’ll do:
Paste the docker compose file content to the
Docker Compose field
Create a volume config map for the Nginx configuration file mapping
Create a host volume to mount the above configuration map to the device
We’ll go over those points step-by-step below but first, let’s have
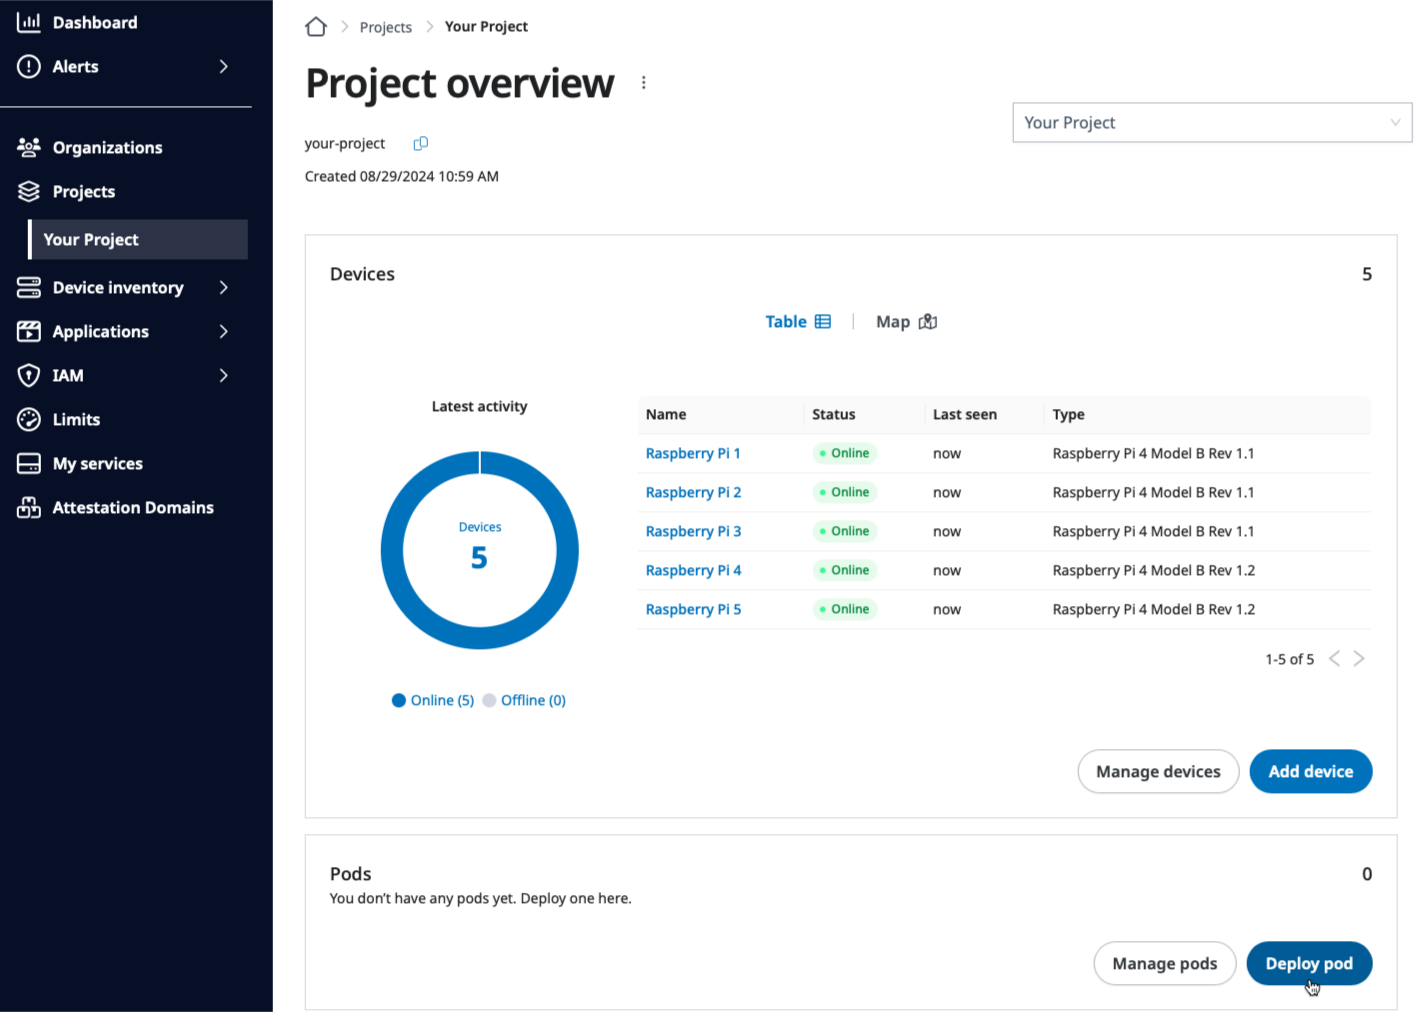
a Deploy pod page ready by clicking the Deploy pod button
on the Project overview page.
Click Deploy pod button on the Project overview page to deploy application.
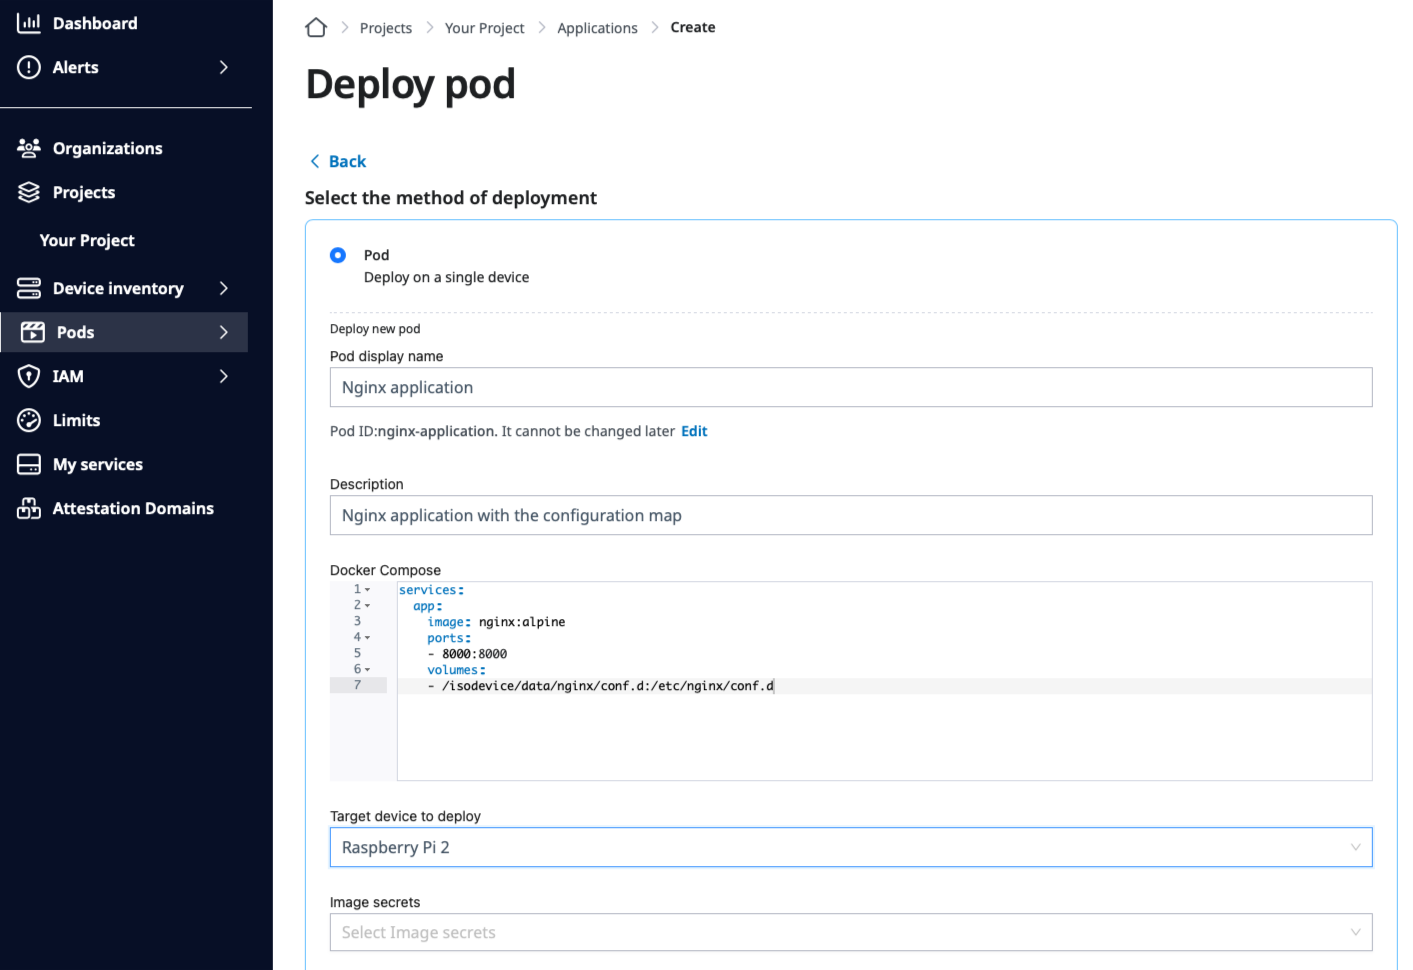
Docker compose file
Let’s paste the docker compose file to the
Docker Compose field of the Deploy pod page.
Docker compose section of the Deploy pod page.
Volume configuration map
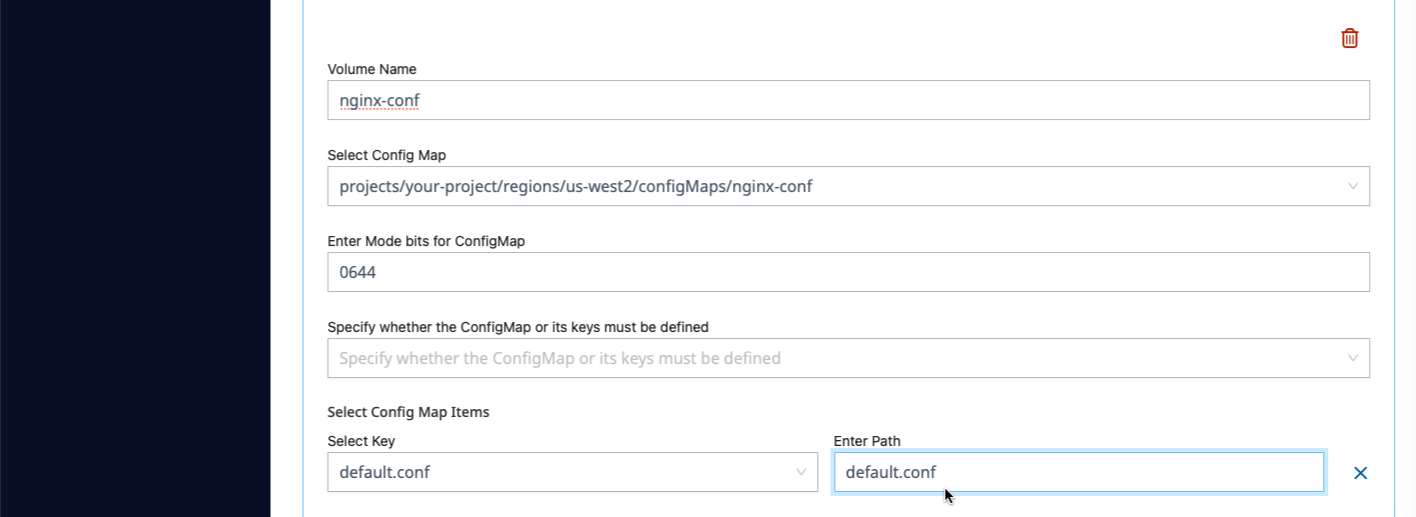
The next is the volume configuration map, which maps the Nginx configuration
file we created before to the application as a volume.
Volume config map section of the Deploy pod page.
Here is the key points to highlight:
Select the correct configuration map
projects/your-project/regions/us-west2/configMaps/nginx-conf for this example
Specify the correct select key of the configuration map item
default.conf in this example, as we specified as the key value name for
the Nginx configuration file when we created the configuration map.
Use default.conf for the path name of the select key
This is the file name which will be shown in the container. Nginx expects
this file name as the default Nginx configuration file.
Host volume
This is the last item to configure on the Deploy pod page.
It mounts the volume configuration map we create above to the host environment
of the device. This file will be mounted to the Nginx load-balancer container
through the docker compose file we explained before.
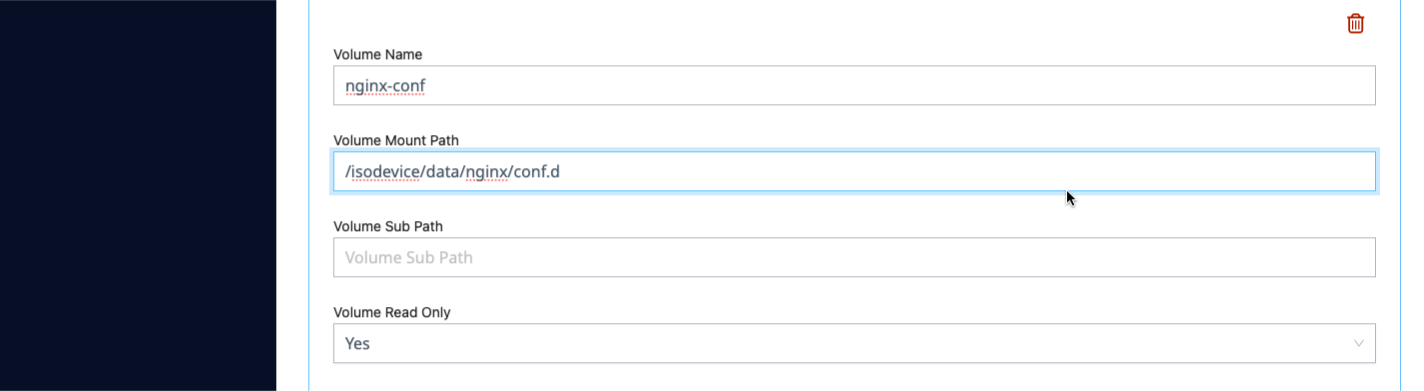
Host volume section of the Deploy pod page.
Again, there are a couple of things to make it right.
the volume name should match the name of the volume configuration map we
created above
nginx-conf in this example
the Volume mount path should be matched to the one specified in the
docker compose
/isodevice/data/nginx/conf.d in this example
Click to deploy
With all those configuration set, click the Deploy button on the Deploy pod
page to deploy the application on your device.
Click Deploy button on Deploy pod page to deploy the application.
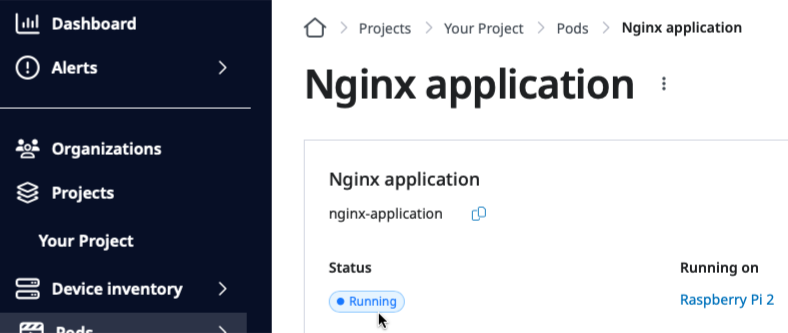
With a minute or so, you should be able to see the application running on your
device, as below.
Running status shown on the application overview page.
Verify the application
Let’s verify the application by accessing it through the port forwarding.
Other ways to access your app
Port forwarding is great for reaching a remote device from your workstation.
If your clients are on the device’s local network, or you want containers to
talk to each other, see Access your deployed application.
Go to the application overview page by clicking the name of the app,
Three tier web app in this example, on the Project overview page.
Click the name of the application on the Project overview page to go to the application overview page.
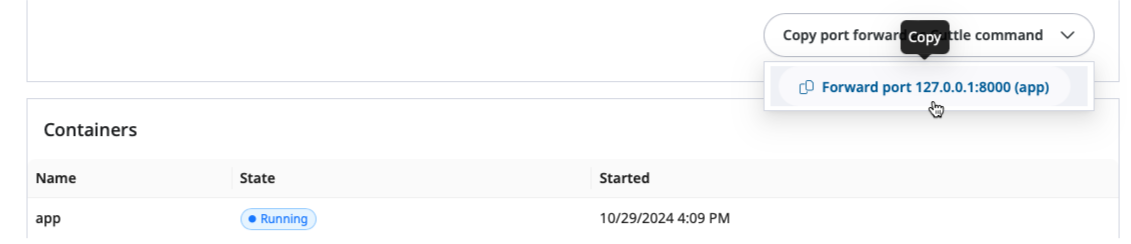
From there, copy the port forward command by clicking the
Copy port forward as Cuttle command button on the application overview page.
Copy the port forward command to access the Nginx service on the application overview page.
Run the command on your local terminal window to make your application accessible
from your browser.
Please note that the device name above will be different for your case.
Device name
The first argument of the port forward command above, which starts with
projects/, is the device name on which the application is running. It
contains both the project and the region name to differenciate from other
devices.
Point your browser to http://localhost:8000 and you should be able
to see the page below.
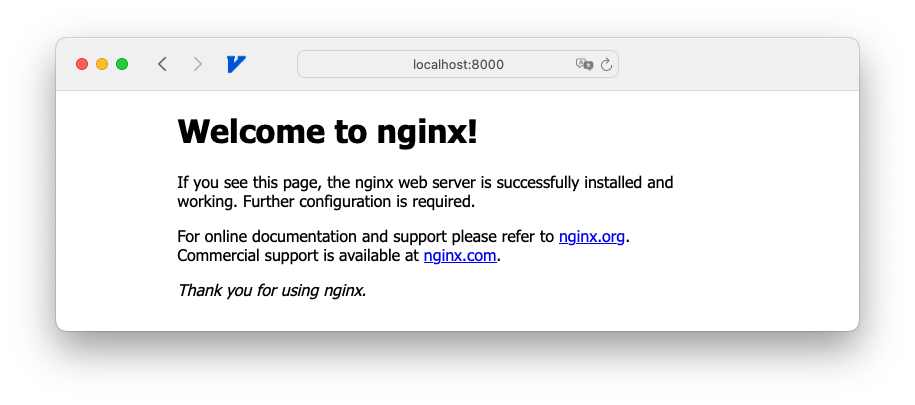
The Nginx application accessed through http://localhost:8000.
Next step
Congratulations on configuring the Nginx application with the configuration
map on SPEKTRA Edge.
Let’s go ahead and understand how to monitor and control applications
as the next step.
3.2 -
Deploy with private container registries
Le’s learn how to deploy applications from the private container registries.
SPEKTRA Edge supports private container registrie, sucn as Amazon Elastic Container
Registry, Azure Container Registry, or Google Artifact Registry, as the application
container registries.
In this document, we’ll learn how to configure the application on SPEKTRA Edge
to run the container image hosted on the Azure container registry, a private
container registry offered by Microsoft Azure.
Under that directory, run the following docker build command to create
the application image tagged with the Azure container registry and repotitory
name for the publication in the following step.
Please replace the registry and the repository name, spektraedge.azurecr.io
and awesome part above, to match your setup.
Refer to the official document for the private registry
creation on Azure.
Publish the image to the Azure container registry with docker push command.
docker push spektraedge.azurecr.io/awesome:latest
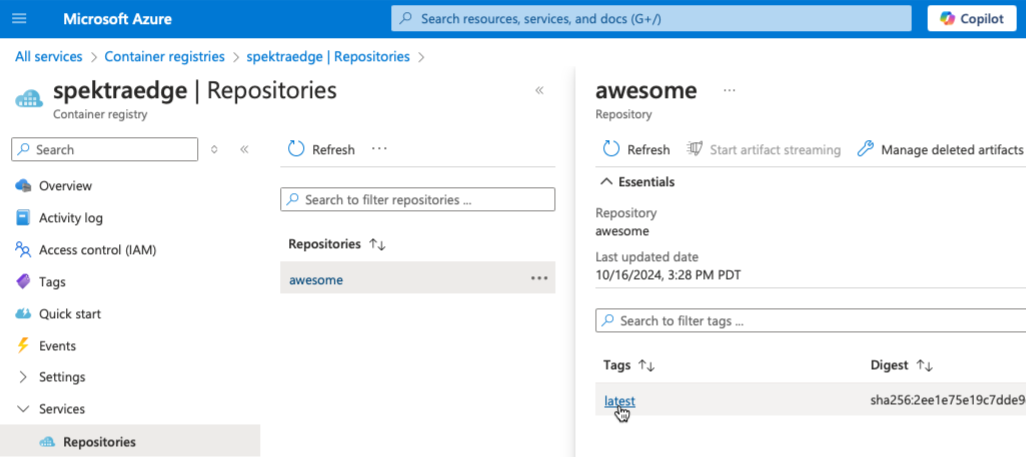
Once it’s pushed, go to the Azure portal and double check if the application
image correctly published on Azure container registry.
The application image on Azure container registry.
Great. You’ve successfully published the application image to the private
container registry.
Now, you’re ready to configure the application to pull the image from the
Azure container registry. But before that, let’s talk about the image
secrets next.
Image secrets
The image secrets is a special secret resource maintained by the SPEKTRA Edge
platform. It’s meant to be used for storing the credentials to access the private
container registries. Hence, we’ll configure the image secrets next before
configuring the applications.
Kubernetes private registry support
The SPEKTRA Edge image secret follows the convention used by the Kubernetes.
Please take a look at thier documentation about how to pull an image
from a private registry for more information.
Let’s create one here.
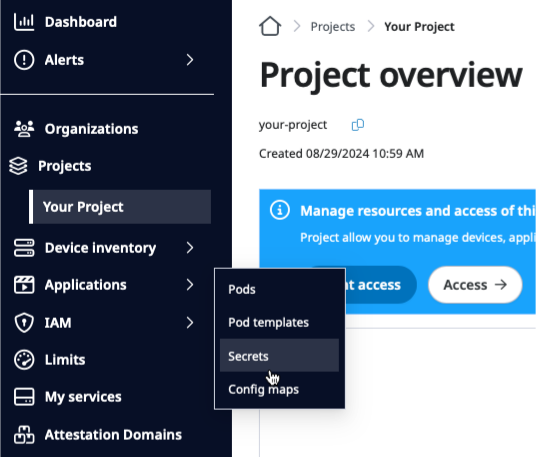
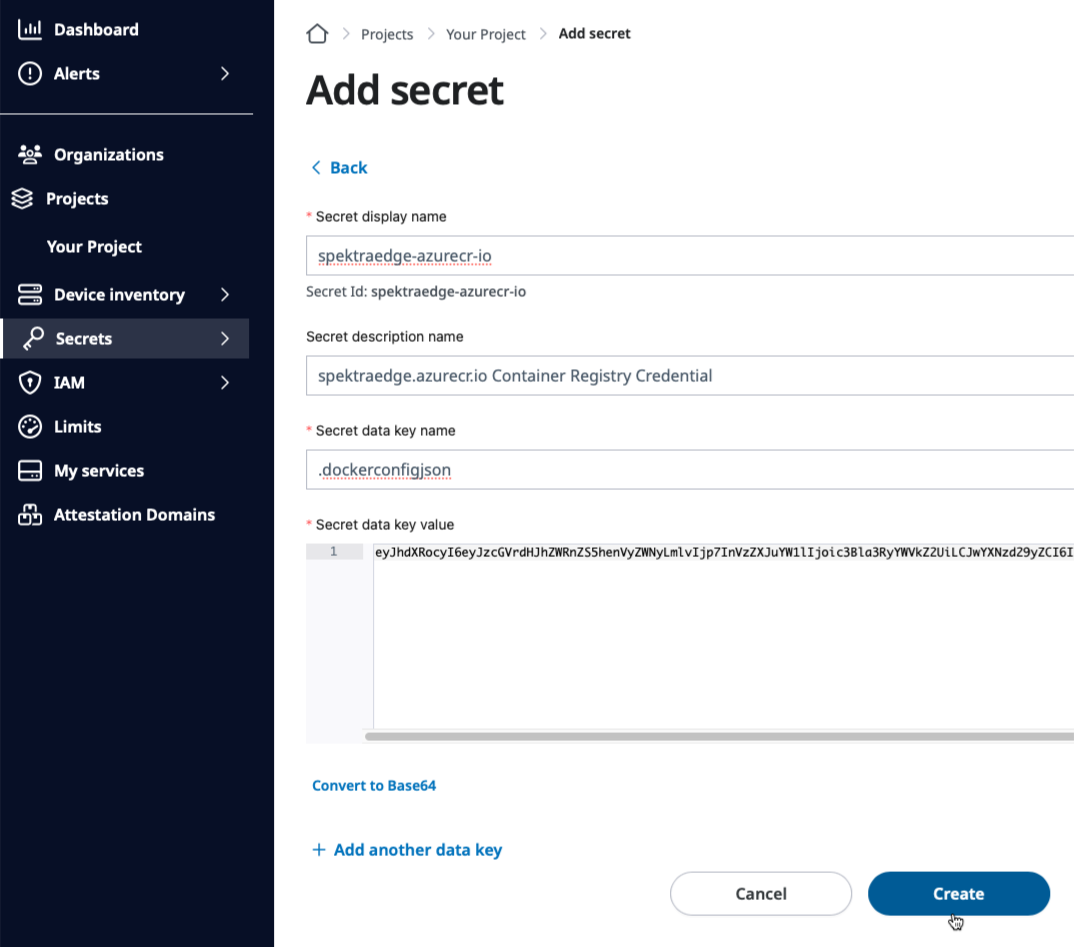
Go to the Secrets page by selecting the Secrets from the Applications
pull-down option from the left navigation menu.
Select Secrets option of Applications pull-down menu.
Click Add Secret button on the Secrets page to create a new secret.
Click Add Secret to create the image secret.
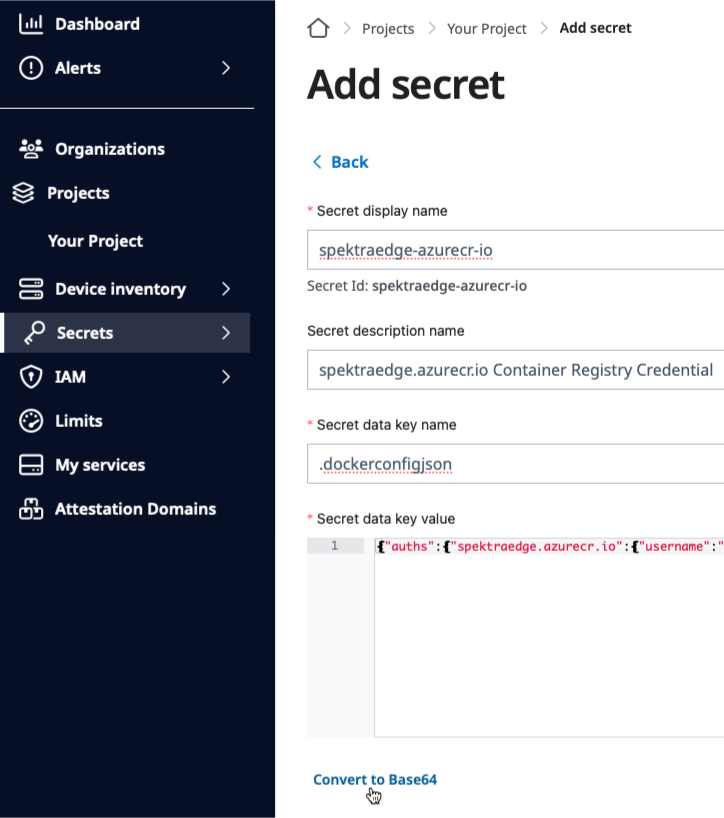
There are three mandately fields to create a secret. We’ll go over those
in detail in the following sections.
This is a case-incensitive alpha-numeric secret name referenced later by
the application configuration. Give it a descriptive name for the better
secret management.
Secret data key name
This field should be .dockerconfigjson. This follows the
Kubernetes convention.
.dockerconfigjson
Please don’t miss the first dot, the period, in the .dockerconfigjson
key name, or it would cause the image download error.
Secret data key value
This fields contains the base64 encoded private registry credential with
the following JSON format.
where you set $REGISTRY_NAME environment variable to your Azure container
registry name, e.g. spektraedge in this example.
Convert to base64
Once you have those three values ready, you paste those in the respective fields
and click Convert to Base64 button of the Add secret page.
Convert Data key value to base64.
Create the image secret
Click Create to create the image secret for the Azure container registry.
Create Image Secret with base64 encoded Data key value.
Please remember the Secret Name (ID), spektraedge-acurecr-io in this example,
for the later reference to deploy your application.
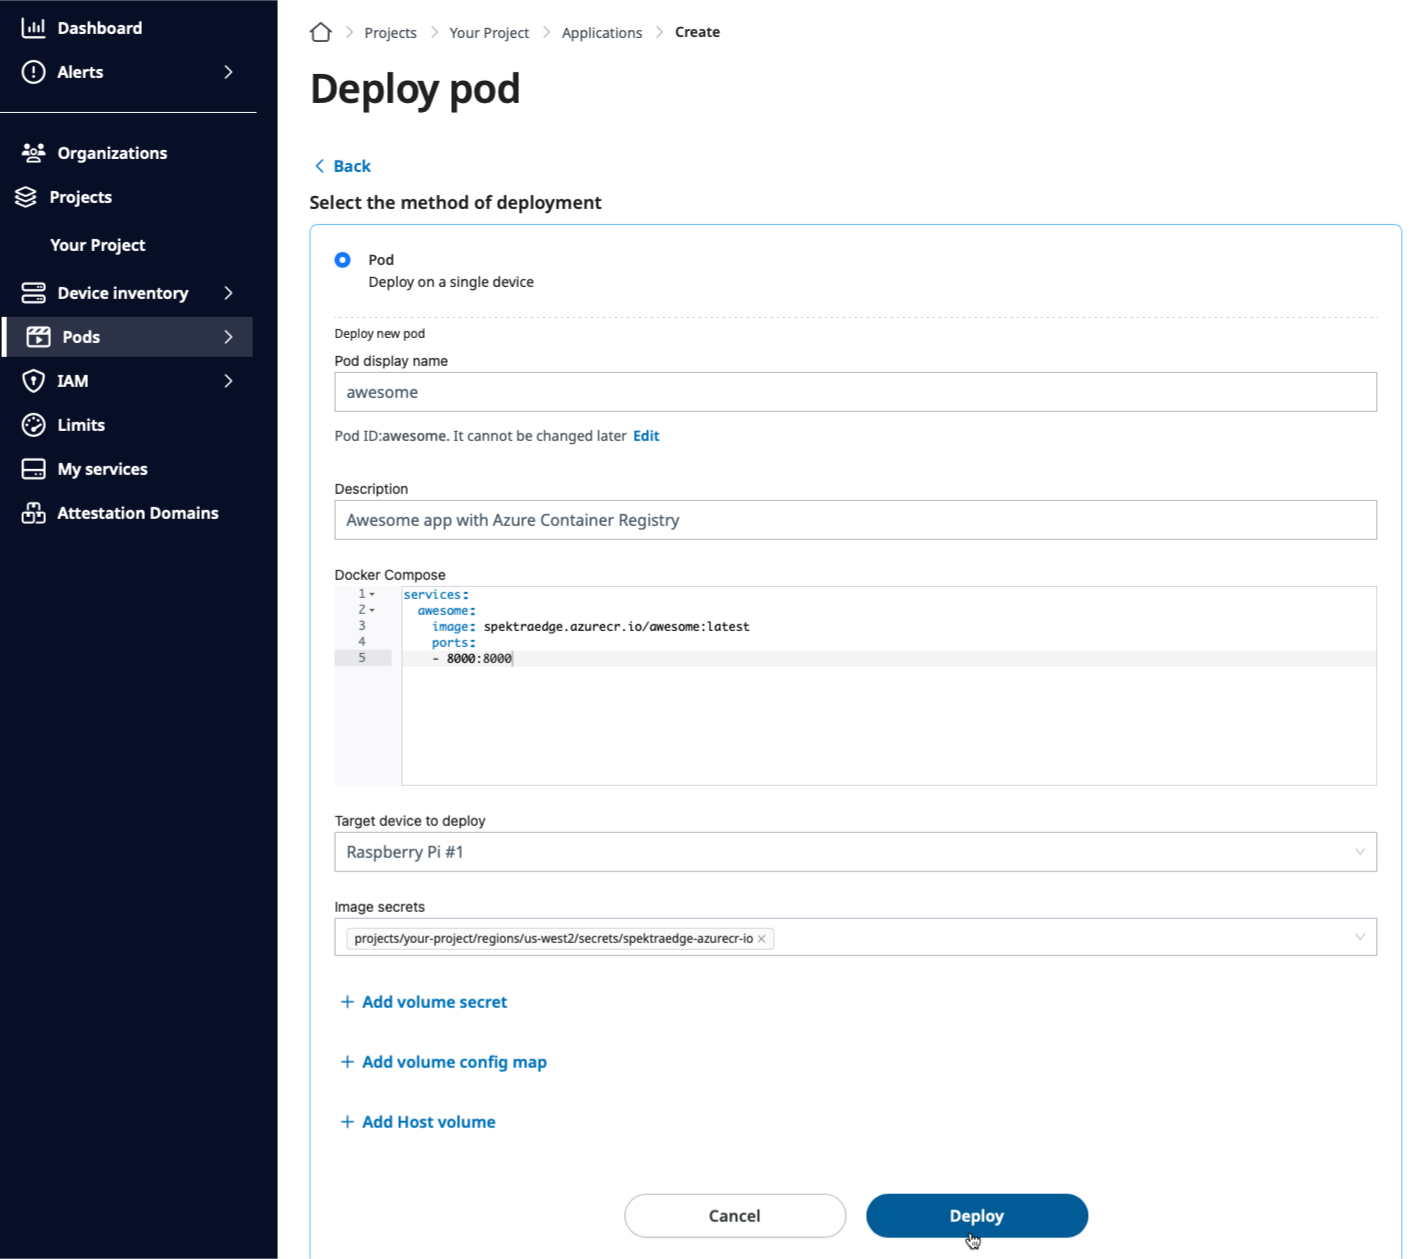
Deploy the application
For the application deployment, we’ll follow the standard application deployment
explained in the previous section except one field, the image secrets.
On the Deploy pod page, select the image secret you created in the previous
step and just click Deploy as usual.
Click Deploy button to deploy the application with the image secrets set.
Next steps
Congratulations on mastering the deployment with the private container registry
on SPEKTRA Edge!
As a next step, let’s learn how to monitor and control
applications on SPEKTRA Edge.
3.3 -
Deploy on multiple devices
Let’s learn how to deploy the application on multiple devices on SPEKTRA Edge.
Please do the same for other devices as well before moving on to the deployment
step next.
Deploy with pod templates
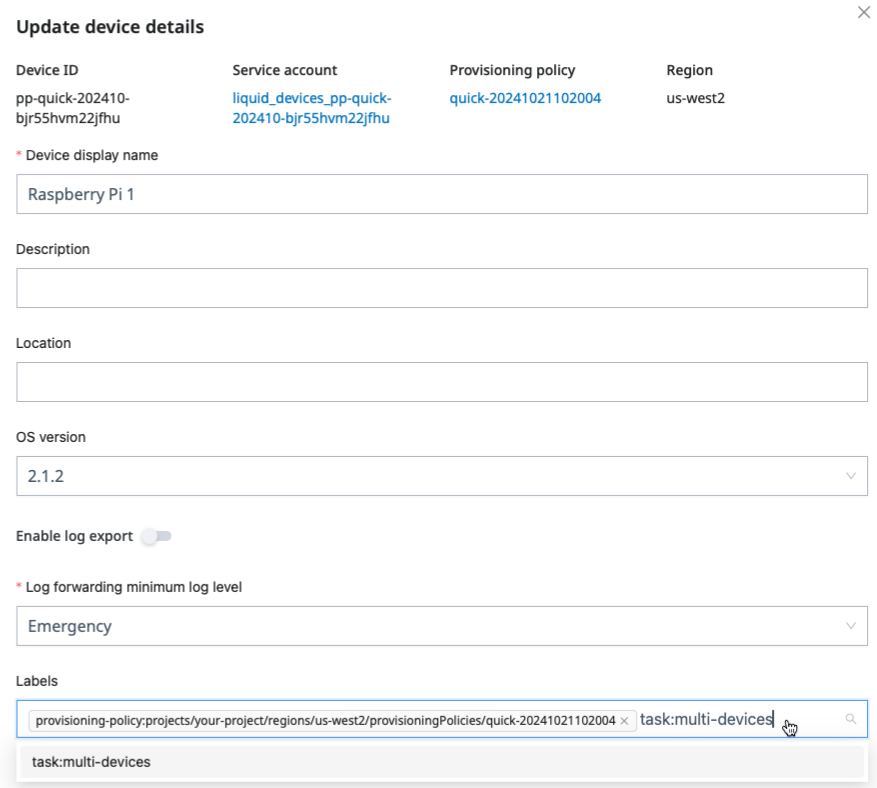
Once you set the device labels on your taget devices, now is the time to deploy
applications on all those devices in one-shot with a pod template.
The pod template is a template to apply application deployment against multiple
devices, similar to the template field of the deployments manifest
in Kubernetes.
Let’s create one to see it in action. We’ll use the same application we used
for the single device deployment to demonstrate how easy and similar
deploying applications on multiple devices.
Go to the Project overview page and click Deploy pod button.
Click Deploy pod button on the Project overview page.
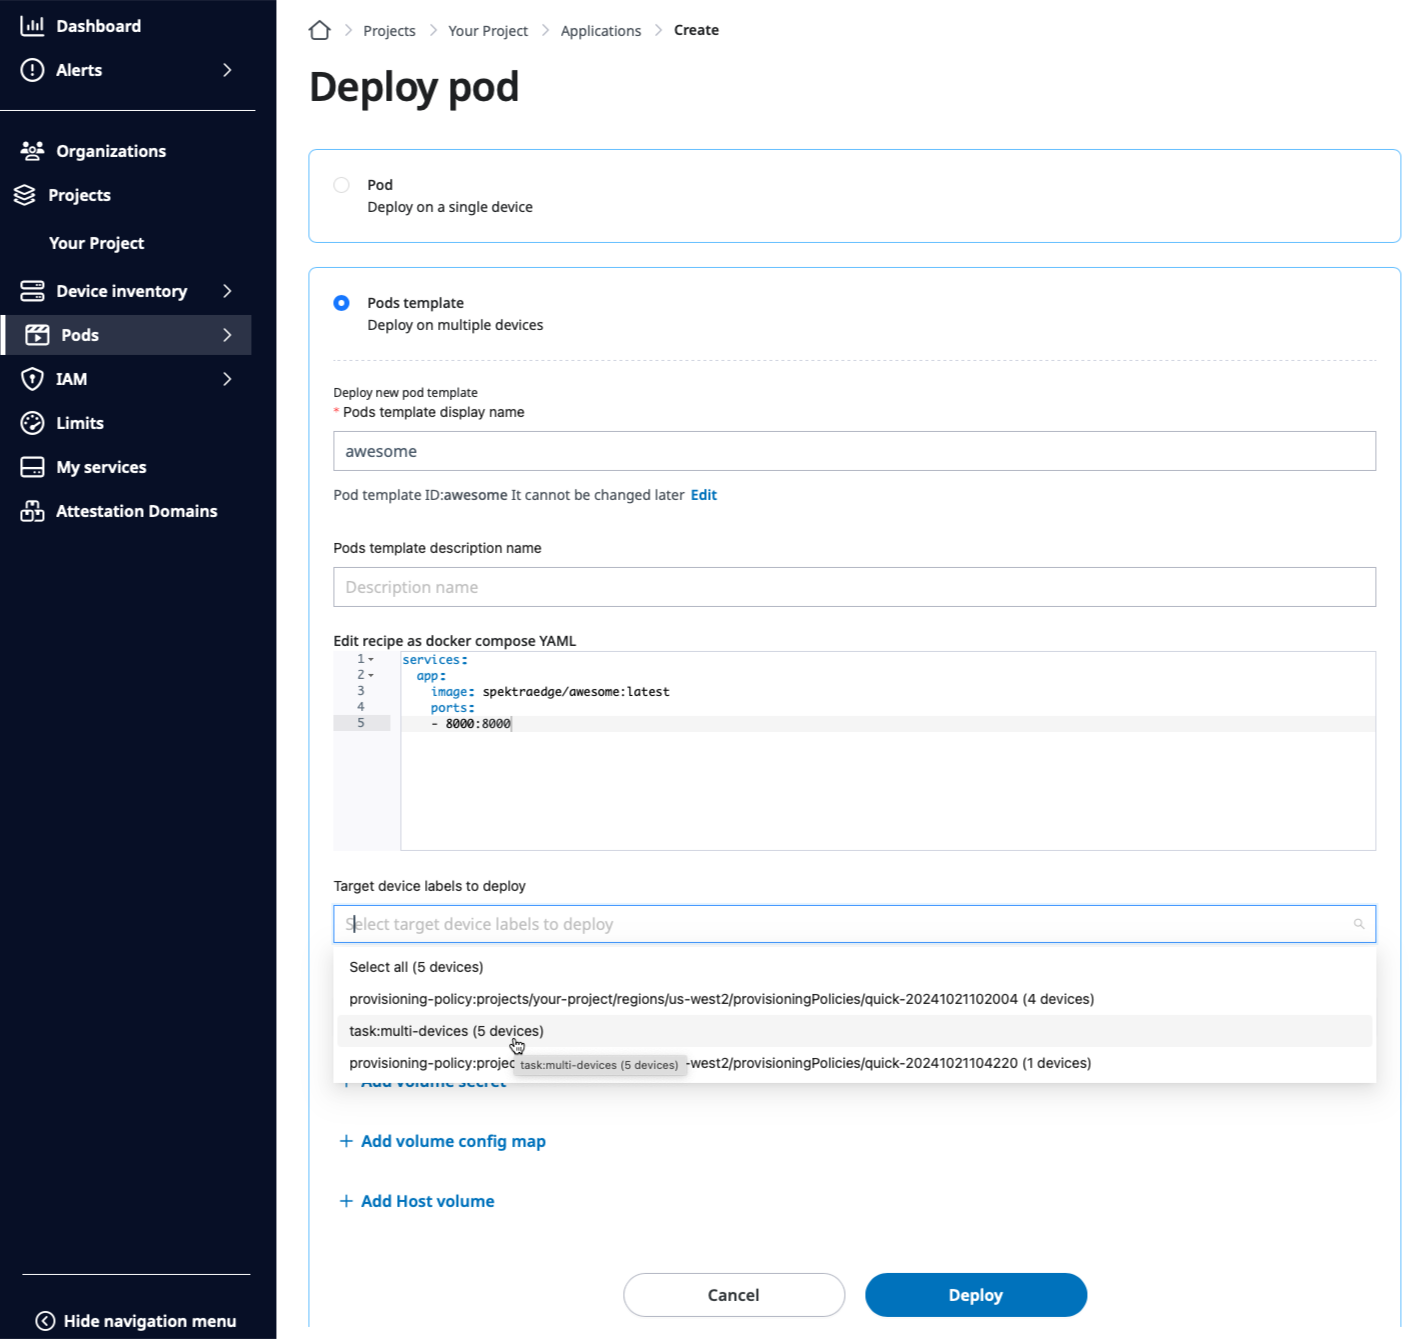
Use the Pod template option in Deploy pod page this time and select
the target devices by providing the device label, task:multi-devices in
this example, in the Target device labels to deploy field, in addition
to the other application information similar to one for the single device
deployment.
Select the target device labels to deploy on Deploy pod page.
Click Deploy to deploy it on multiple devices.
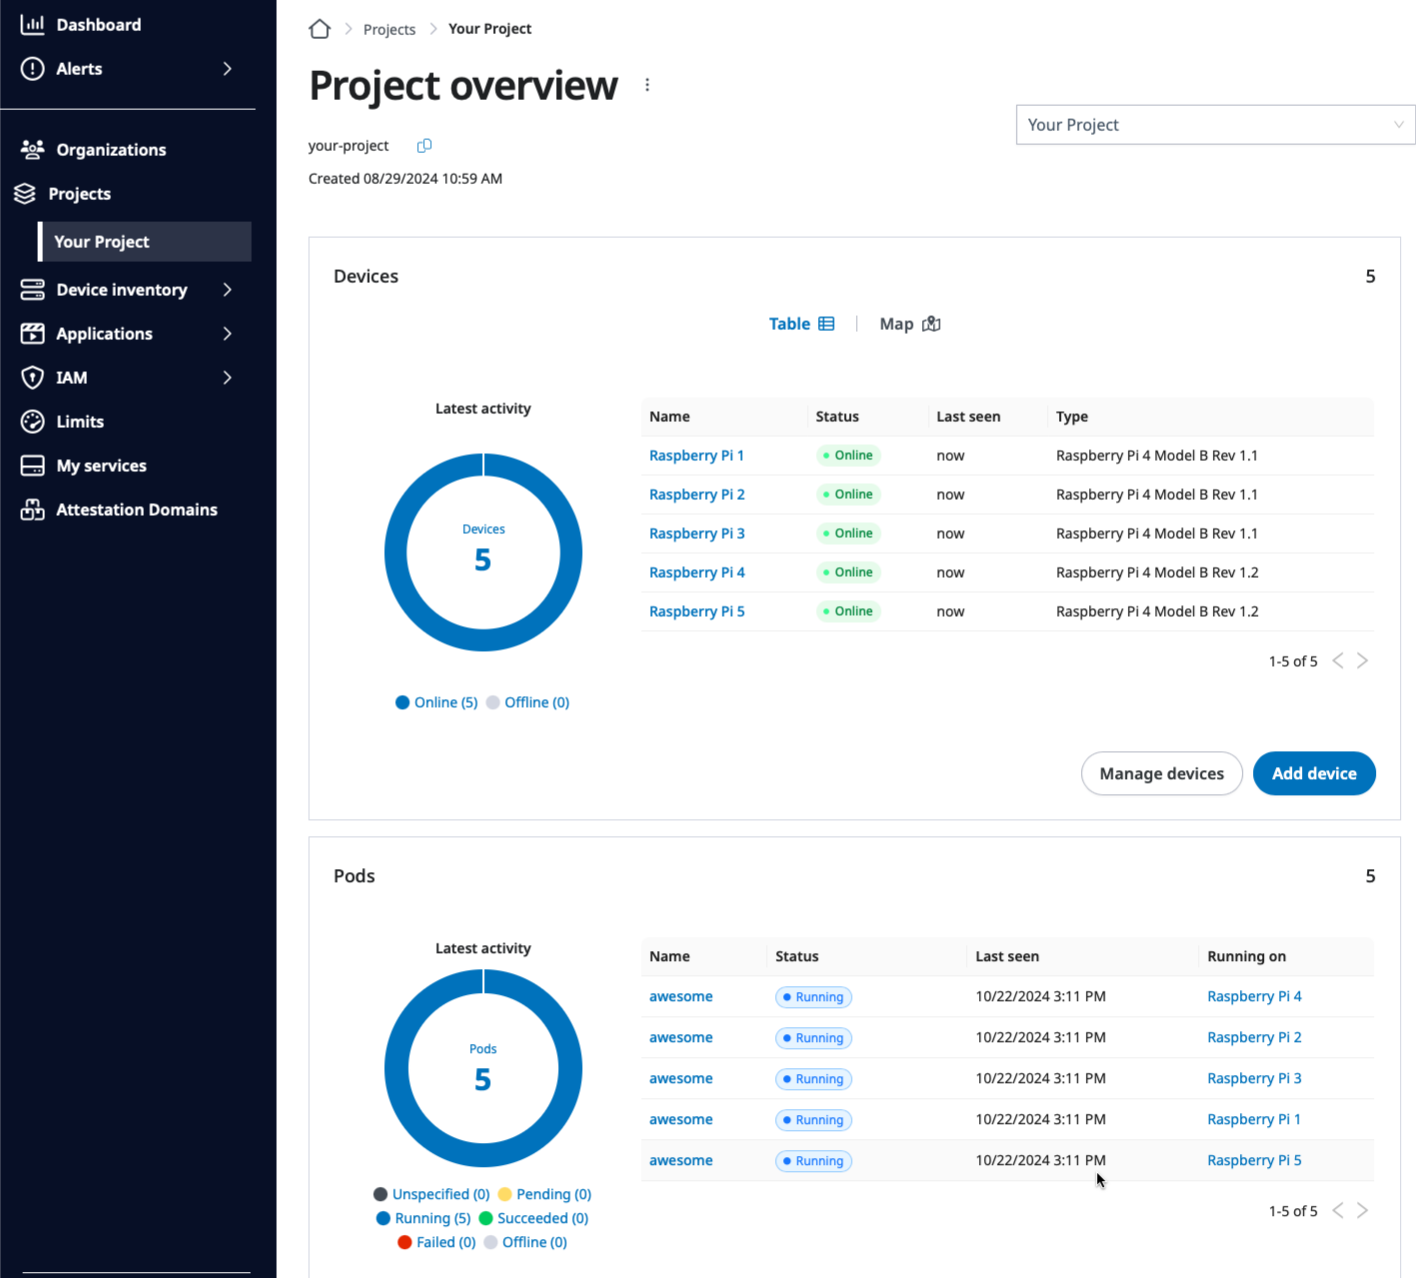
Once it’s done, you should be able to see applications all running
on the target devices, five devices in this example, from the Project overview
page.
awesome application running on all five target devices.
Next step
Congratulations on successfully deploying the application on multiple devices
in a single-shot on SPEKTRA Edge.
Let’s proceed to the monitoring applications section
as the next step to the mastery of SPEKTRA Edge.
3.4 -
Monitor and control applications
Let’s learn how to monitor and control applications on SPEKTRA Edge.
It also offers the cuttle port forward command, which you can
copy and run on your local machine to access your application through
the SPEKTRA Edge port forwarding capability.
Accessing your application
For all the ways to reach a running application — platform port forwarding,
access from the device’s local network, and container-to-container — see
Access your deployed application.
Copy port forward command option in the Application overview page.
Application statuses
Here is the list of application statuses monitored on SPEKTRA Edge.
Status
Description
Pending
The application is accepted by the system and it’s under processing to be launched. It’s the PENDING state of the Pod.Status.Phase enumeration type.
Running
The application is running, which is that its all containers supposed to be running are up and running. It’s the RUNNING state of the Pod.Status.Phase enumeration type.
Succeeded
The application is terminated with the success exit code. It’s the SUCCEEDED state of the Pod.Status.Phase enumeration type.
Failed
The application encountered an issue and some or all of the containers are not running. This phase happens after the containers are initially created successfully. It’s the FAILED state of the Pod.Status.Phase enumeration type.
Offline
The application does not respond anymore. This phase happens after the containers were initially created successfully. It’s the UNKNOWN state of the Pod.Status.Phase enumeration type.
Image download failed
The application failed to download the container image. It’s the IMAGE_DOWNLOAD_FAILED state of the Pod.Status.Phase enumeration type.
Initialization failed
The application failed to initialize or the validation of the application definition had some errors, typically caused by the Docker compose file syntax errors or the system errors on devices such as disk full. It’s the INIT_FAILED state of the Pod.Status.Phase enumeration type.
Pod create failed
The application failed for the creation due to either by the docker runtime error or the keyword errors. It’s the POD_CREATE_FAILED state of the Pod.Status.Phase enumeration type.
Container states
Here is the list of Container’s state, which is the composition of
the application status explained above. The Containers section
of the Application overview page shows the container states.
State
Description
Waiting
The container is waiting to start. It’s the WAITING state of the Pod.Status.Container.State enumeration type.
The container is terminated. It’s the TERMINATED state of the Pod.Status.Container.State enumeration type.
Application metrics
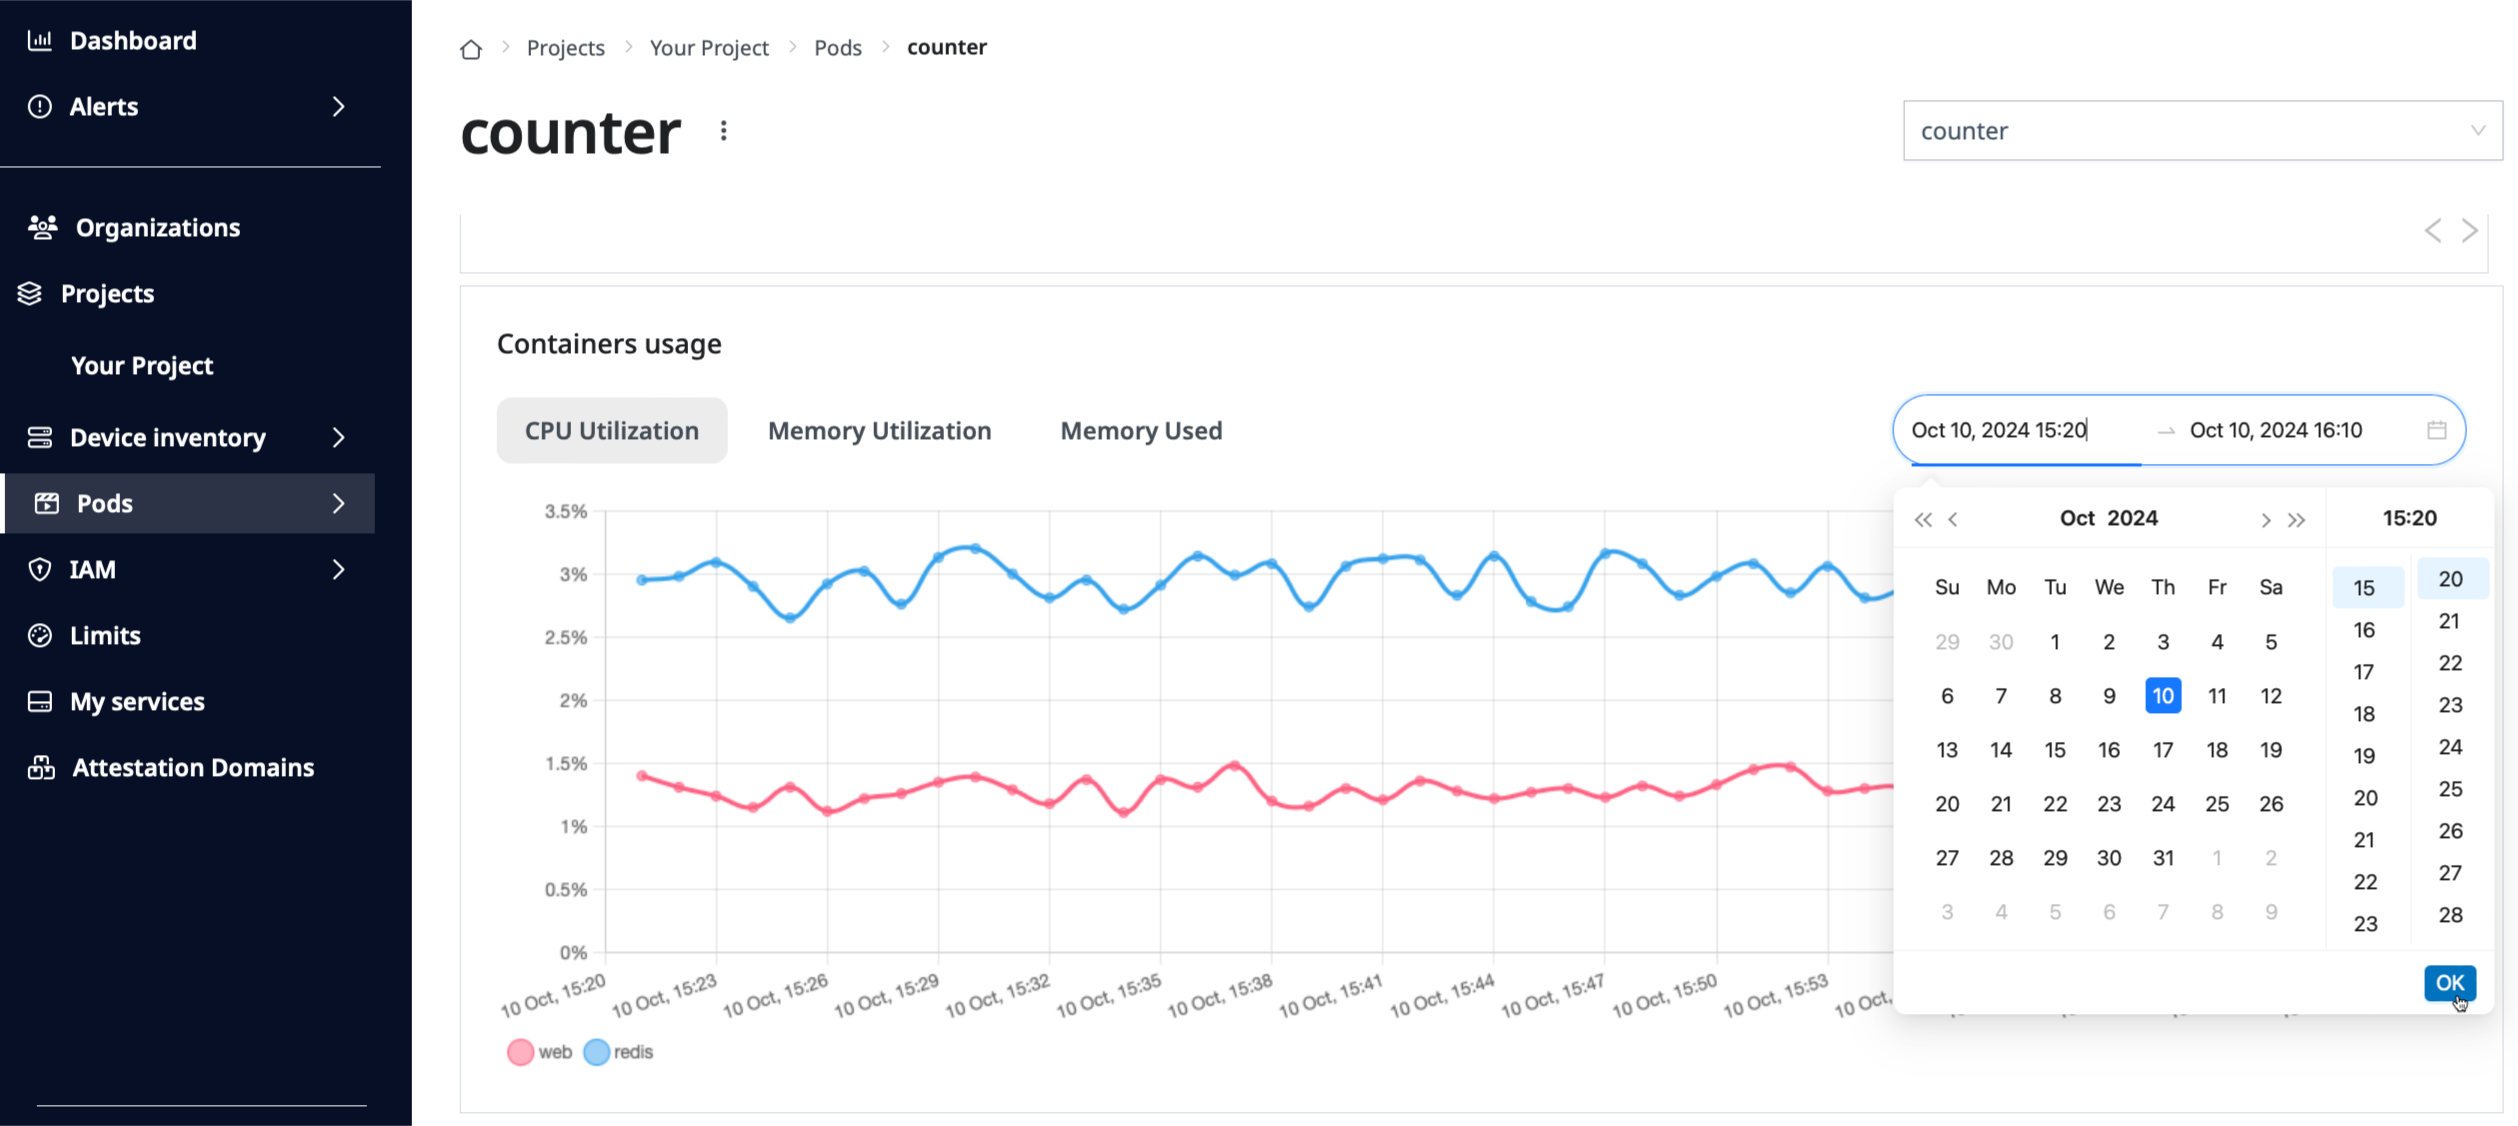
You can monitor the container’s resource usage on the dashboard.
Go to the Containers usage section of the Application overview page
and select the type of resource you want to monitor. Click the right side
of the time range section to specify the duration of the time-series to be
shown on the graph.
Specifying the duration of the time to show the application CPU usage.
Application logs
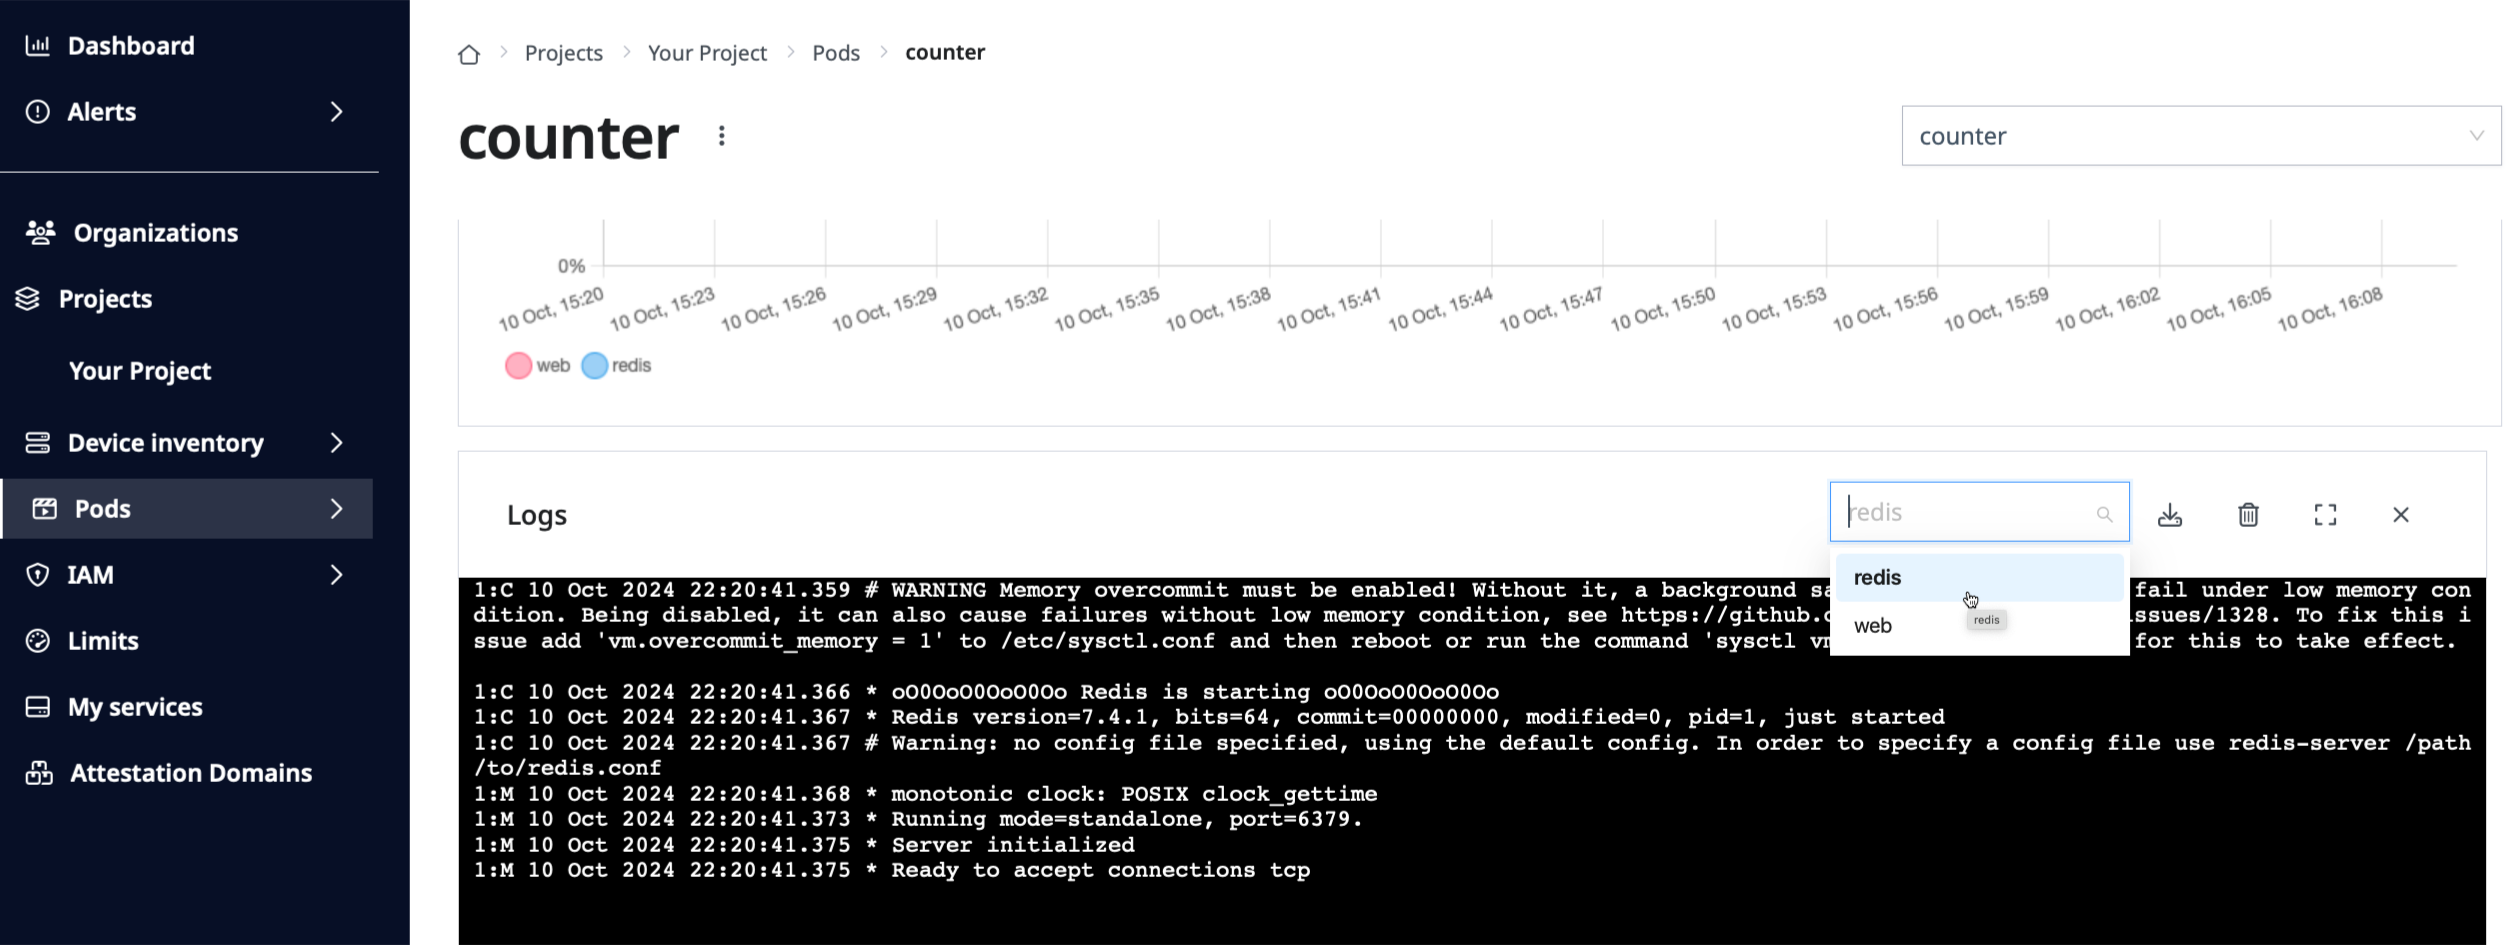
You can retrieve each container’s logs on the dashboard.
Specify the name of the container you want to show the logs by clicking the
pull down menu of the Logs section on the Application overview page.
Click Start to retrieve the live logs of the container.
You can also download the logs by clicking the Download icon on the
Logs menu bar.
Observing the redis container’s logs.
Control applications
You can control applications from the dashboard.
Here is the list of operations you can perform:
delete
restart
Click the the vertical three-dots right next to the application’s name
in the Application overview page to show the pull-down menu and select
the operation you want to perform.
Restarting the application by clicking the Restart option of the pull-down menu on the Application overview page.
Next step
Congratulations!
With the understanding of the application management on SPEKTRA Edge,
we hope you gained the fundamental concept of the application life cycle
happens on the SPEKTRA Edge platform.
Please go ahaed next to the device management section as part
of the SPEKTRA Edge mastery.
3.5 -
Access your deployed application
Let’s learn the ways to reach an application running on your device with
SPEKTRA Edge.
Once you deploy an application, its containers run on the device and
publish ports according to your Docker compose file. How you reach those ports
depends on where you are relative to the device. This page covers the three
common cases:
The left side (8000) is the device host port; the right side (8000) is
the container port.
From your workstation (port forwarding)
This is the recommended way to reach an application on a remote device. It
works from anywhere, over the device’s existing outbound connection to the
platform, so no inbound ports need to be open on the device or its network.
You need the cuttle CLI installed for this method.
Open the application’s Application overview page in the dashboard (see
Monitor & control).
Click Copy port forward as Cuttle command to copy a ready-made command.
This forwards the device’s port 8000 to 127.0.0.1:8000 on your machine.
Point your browser at http://localhost:8000
and you’ll reach the application as if it were running locally.
The first argument is the full device name (it includes the project and region);
the dashboard fills this in for you when you copy the command.
Why use port forwarding?
It works wherever you are, not just on the device’s network.
It is tunneled through the platform’s authenticated connection, so you don’t
expose the application to the public internet or open firewall ports.
It’s ideal for administration, debugging, and one-off access.
From the device’s local network
If your client (a browser, another machine, a PLC, etc.) is on the same local
network as the device, you can reach a published port directly using the
device’s IP address:
http://<device-ip>:<published-port>
For the Nginx example above, that would be http://<device-ip>:8000.
This is the natural choice when the application is meant to serve other equipment
on-site — for example, a local dashboard, an API consumed by nearby machines, or
a gateway service.
A few things to keep in mind:
The port must be published in the compose file (the ports entry). A
container port that isn’t published is only reachable from inside the device.
By default a published port is reachable on all of the device’s network
interfaces. If you only want it on a specific interface, bind it explicitly
in the compose file, for example 127.0.0.1:8000:8000 to keep it on the
device itself.
Make sure the chosen host port doesn’t collide with another application or a
system service on the device.
From another container
Containers within the same application can talk to each other over the
application’s internal network using their service name as the hostname —
they don’t need to publish ports for this. For example, an app service can
reach a redis service at redis:6379.
Only publish a port (with ports) when something outside the application
needs to reach the container. Internal service-to-service traffic should stay
on the internal network.
Persisting data behind your application
If your application stores data (uploads, a database, configuration), mount it
under the device’s persistent data area so it survives restarts and power
cycles:
Device is either not detected, or detected as disconnected, by the platform. It’s the DISCONNECTED state of the Device.Status.ConnectionStatus type.
Device metrics
You can monitor the device’s resource usage on the dashboard, which includes:
CPU
Memory
Storage
Temperature
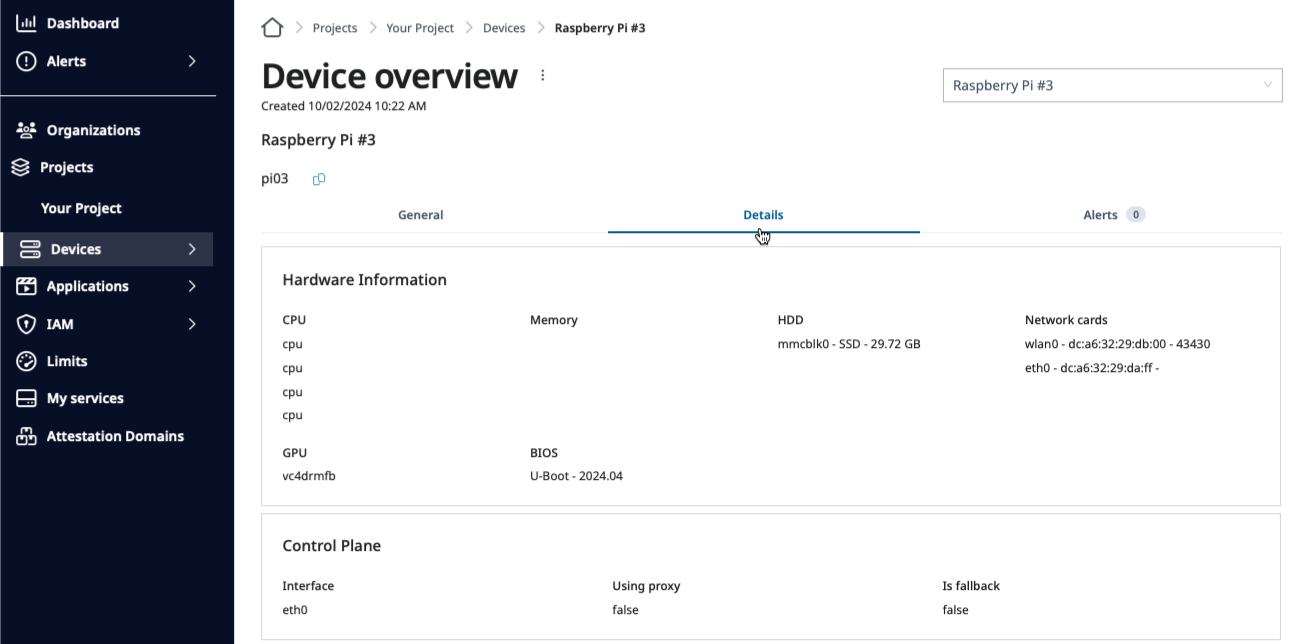
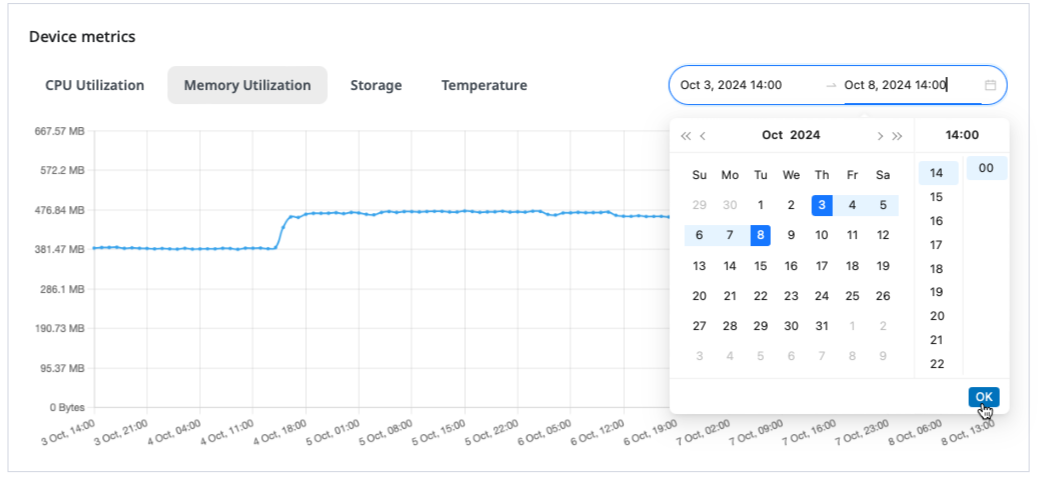
Click the Details tab of the Device overview page and scroll down to
the Device metrics section. Select the metric type and the duration of
time to show the time-seris of the resource usage.
Specifying the duration of time to show the device memory time-series.
Device logs
You can retrieve the device logs from the dashboard.
Device log levels
Please follow the device log forwarding page for the verious logging levels
supported on SPEKTRA Edge.
Go down to the Logs section of the Device overview page and click
the Start button to retrieve the device logs. By default, you are
observing the active logs and are kept updated whenever the new log come
on the device.
Start button of the Device Logs window of the Device overview page.
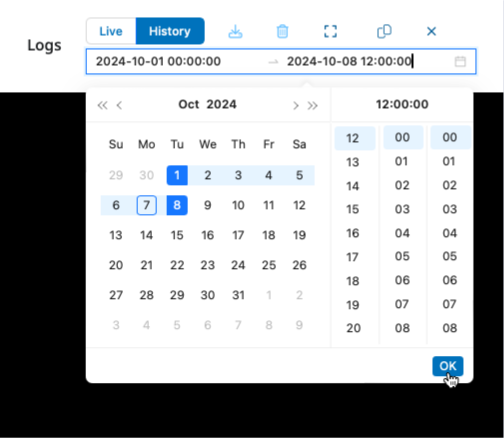
To see the logs during the particular period, select the History option
from the Device Logs menu and give the time range you’re interested in,
then hit OK.
Select time range of the device logs.
You can also download the logs for the further investigation by clicking
the download icon on the Device Logs menu.
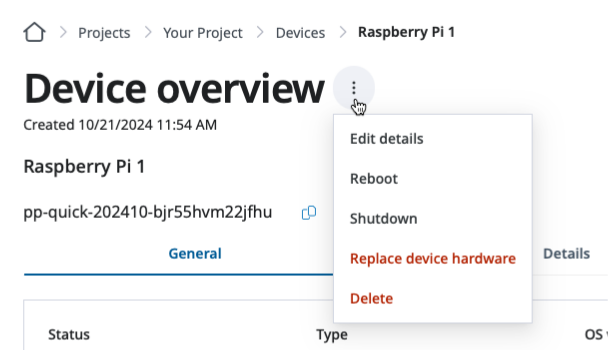
Control devices
You can reboot and shutdown the device from the dashboard.
Click the vertical tripple dots right next to the Device overview
title to show the pull down menu for the control options.
Device control options shown on the Device overview page.
Select Reboot or Shutdown to take the actual action.
Access devices
You can access the device console over SSH from the dashboard or
the local terminal with cuttle command.
Access devices from dashboard
Go to the Terminal window of the Device overview page and click
Connect button to access to the device console.
Connect button on the Terminal window of the Device overview page to access the device.
Access devices from your machine
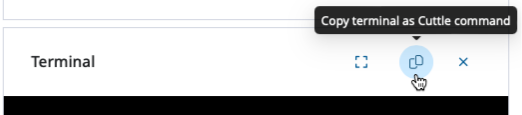
You can access the device console from your local machine.
Click the Copy terminal as Cuttle command button in the Terminal window
menu and paste it to the terminal of your local machine.
Copy cuttle command for the device terminal access.
SPEKTRA Edge supports the Syslog sevierity levels outlined in RFC5424 Section 6.2.1.
Here is the brief description of those log levels for your reference.
Log level
Description
Emergency
Logs for the unstable system situation.
Alert
Logs for the immediate action required, or the above.
Critical
Logs for the critical conditions, or the above.
Error
Logs for the error conditions, or the abvoe.
Warning
Logs for the warning conditions, or the above.
Notice
Logs for the normal but significant conditions, or the above.
Informational
Logs for the informational messages, or the above.
Debug
Logs for the debug-level messages, or the above.
Setting the lower device log level means the device uploads the logs at that level and all
the higher level logs.
Set it to the higher log level, e.g. Error, in case if you want to reduce the logs
forwarded by the particular devices.
Change device log levels
It’s super simple to change the device log forwarding levels.
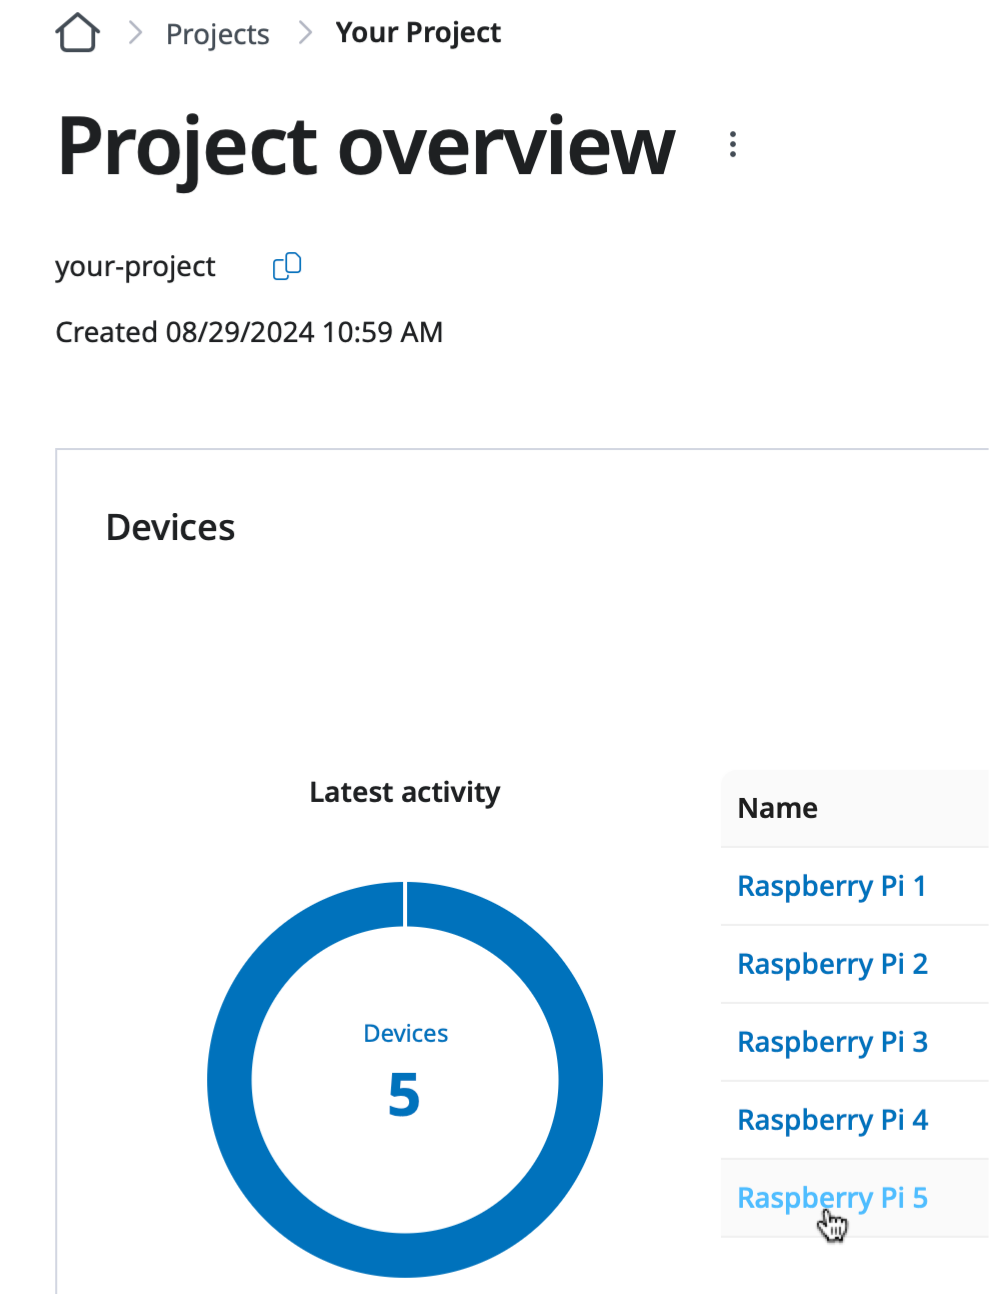
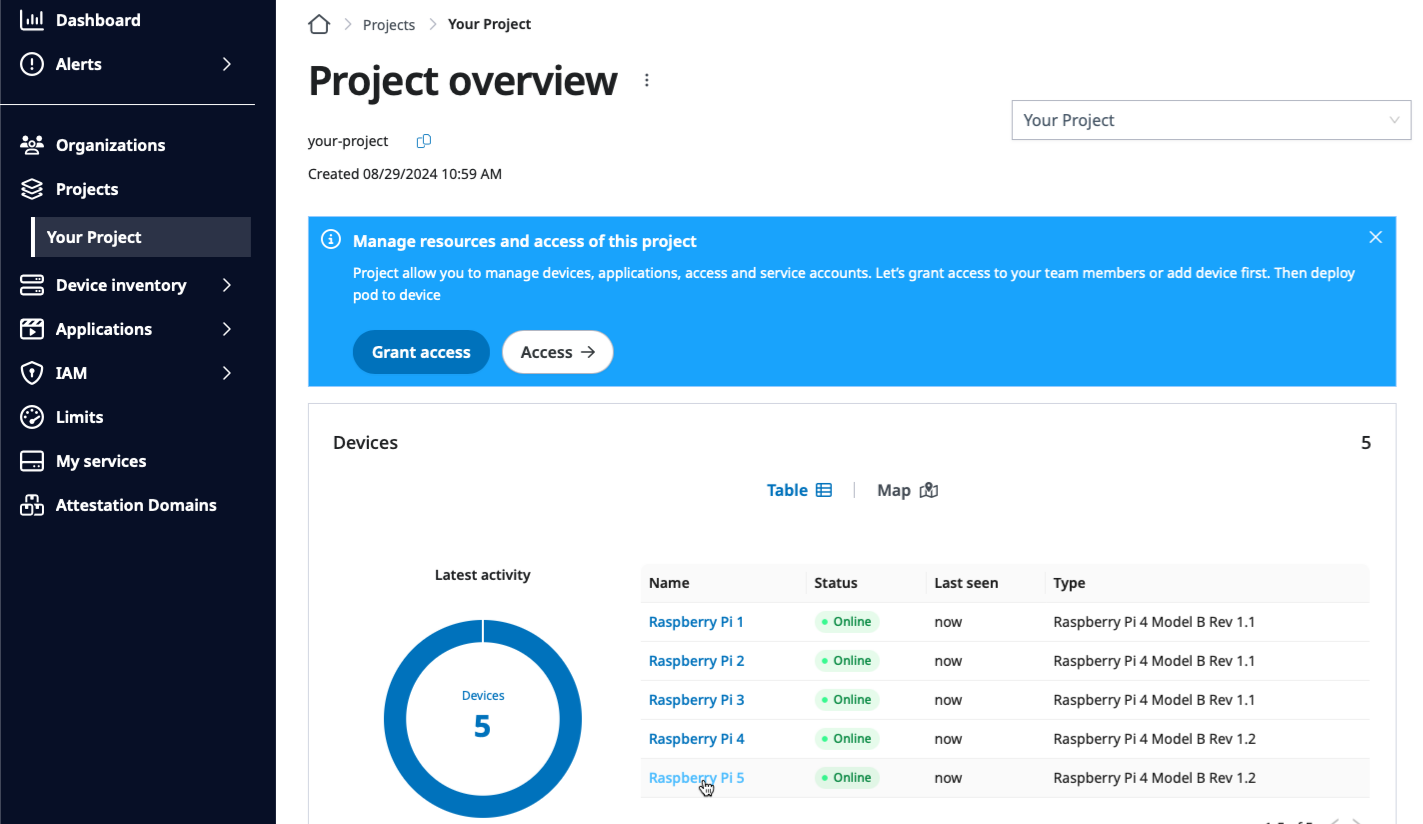
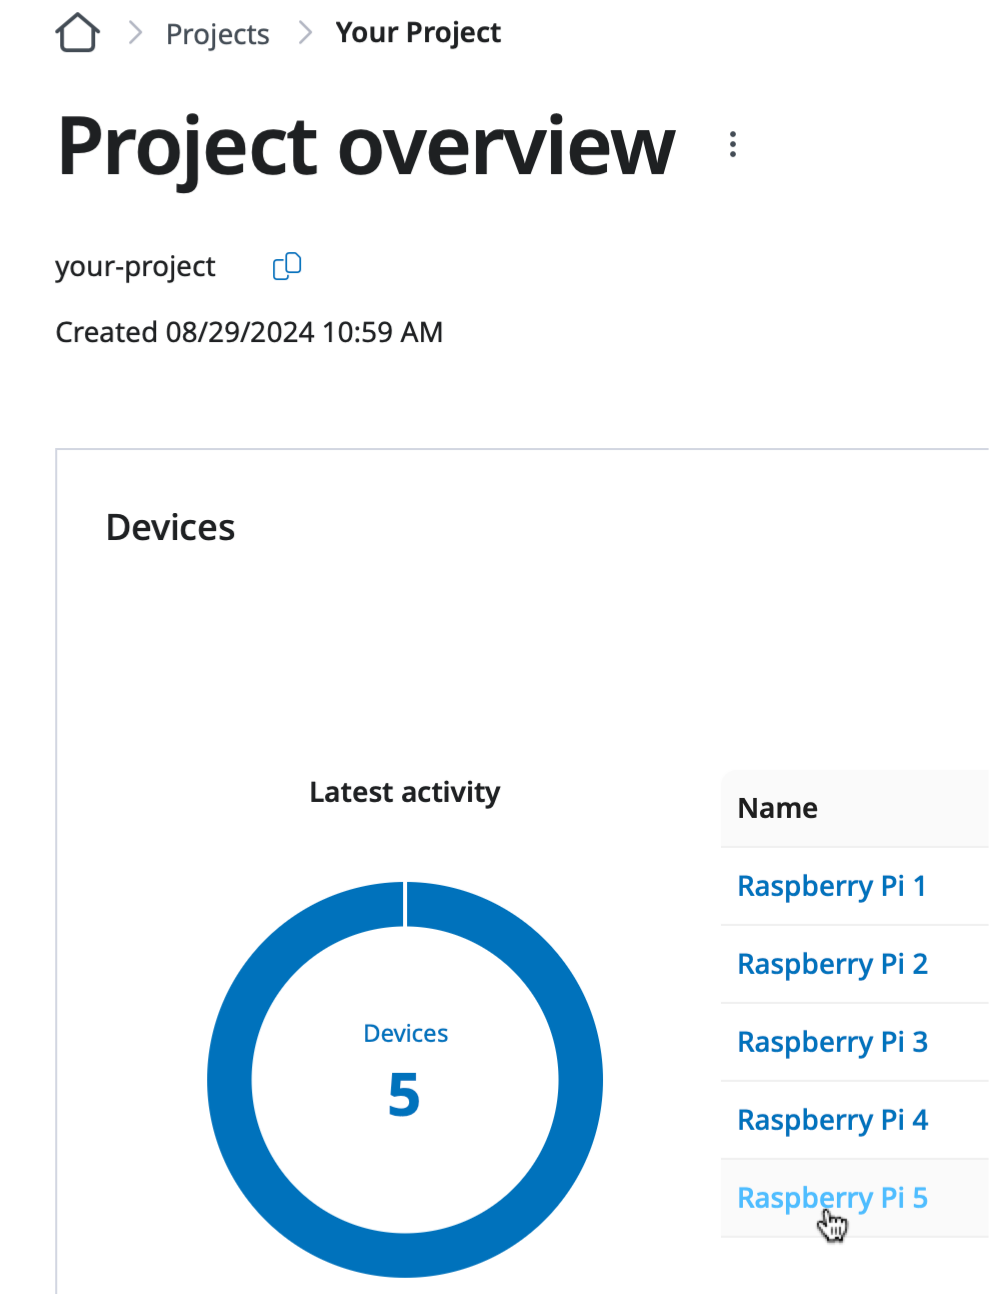
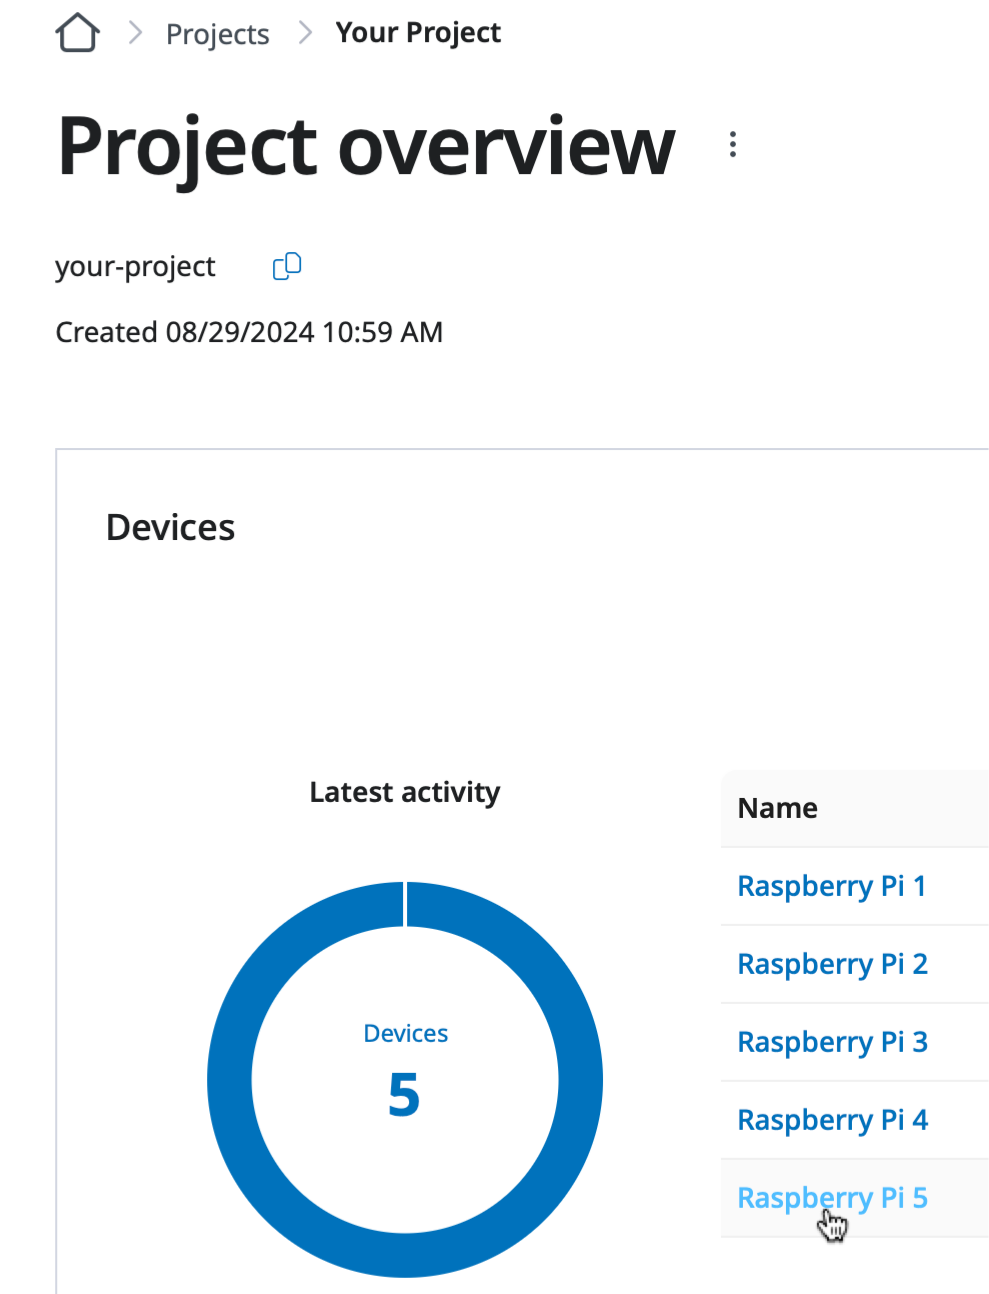
Go to the Device overview page by clicking the device name on the Project overview page.
Clicking the device name, Rapberry Pi 5, on the Project overview page.
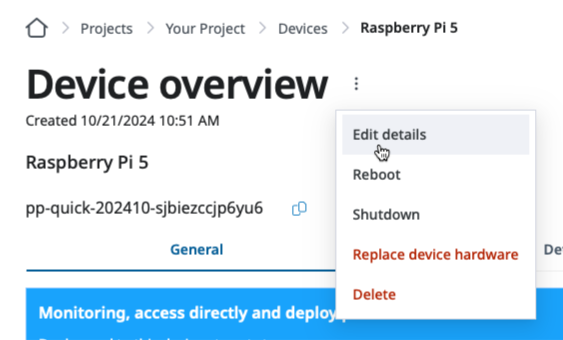
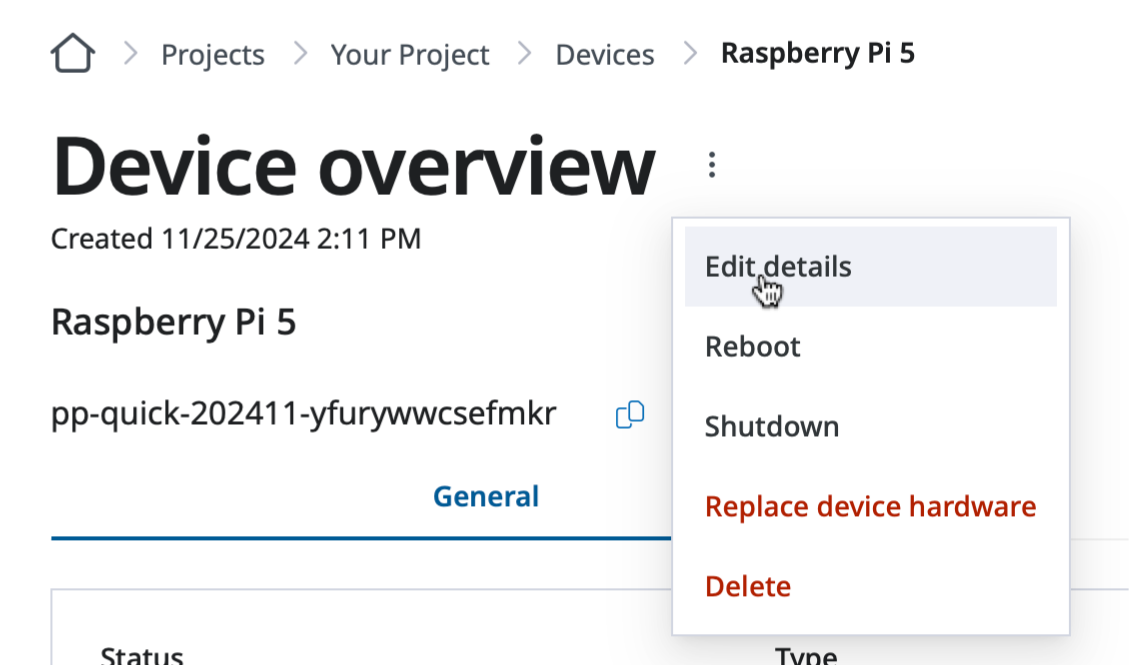
Open the Update device details page by clicking the Edit detail option of the
device menu option.
Click the Edit detail option of the device menu option.
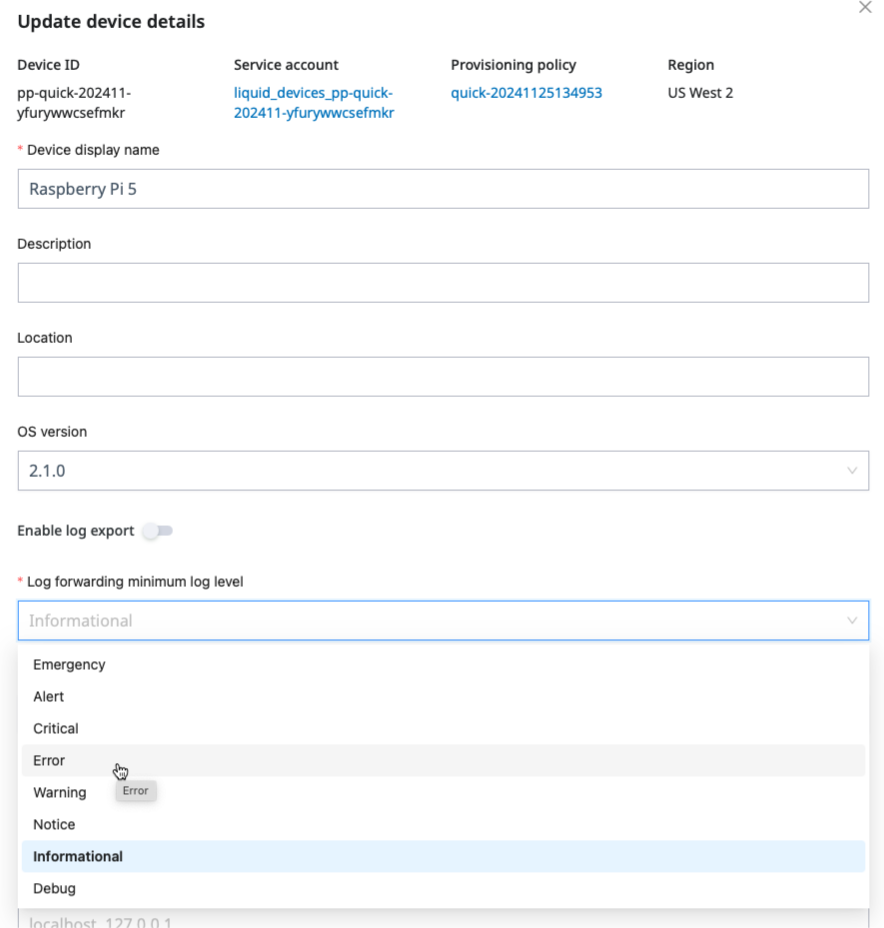
Set the appropriate device log fowarding levels, e.g. Error, by selecting it in the
Log forwarding minimum log level field.
Changing the device forwarding minimum log level to Error from Informational.
That’s it!
Next step
Congratulations for understanding various device logging levels supported on SPEKTRA Edge
and how to change those.
Let’s move on to the next learning material, device networking on SPEKTRA Edge.
Onwards.
4.2 -
Manage device networking
Let’s learn how to manage device networking on SPEKTRA Edge.
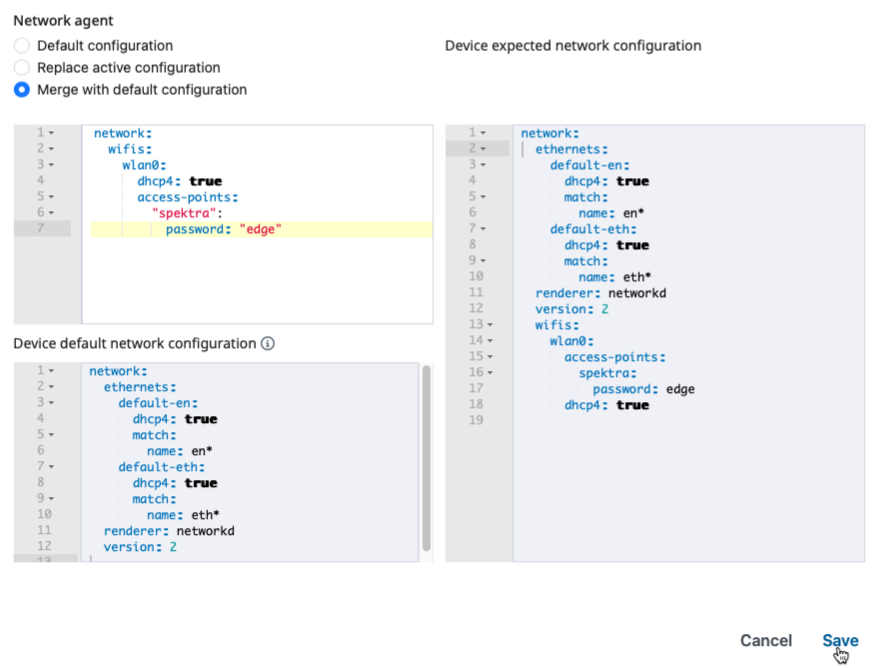
We utilize the Canonical Netplan to manage device networking on SPEKTRA Edge.
It provides the clean and intuitive YAML based configuration and support wide range of
Linux networking managers.
In this guide, we’ll learn how to configure the wireless interface on Raspberry Pi as the
secondary interface to get familier with the Netplan YAML configuration.
Netplan how-to guides
Please take a look at the official Netplan how-to guides for additional examples
how to configure device networking.
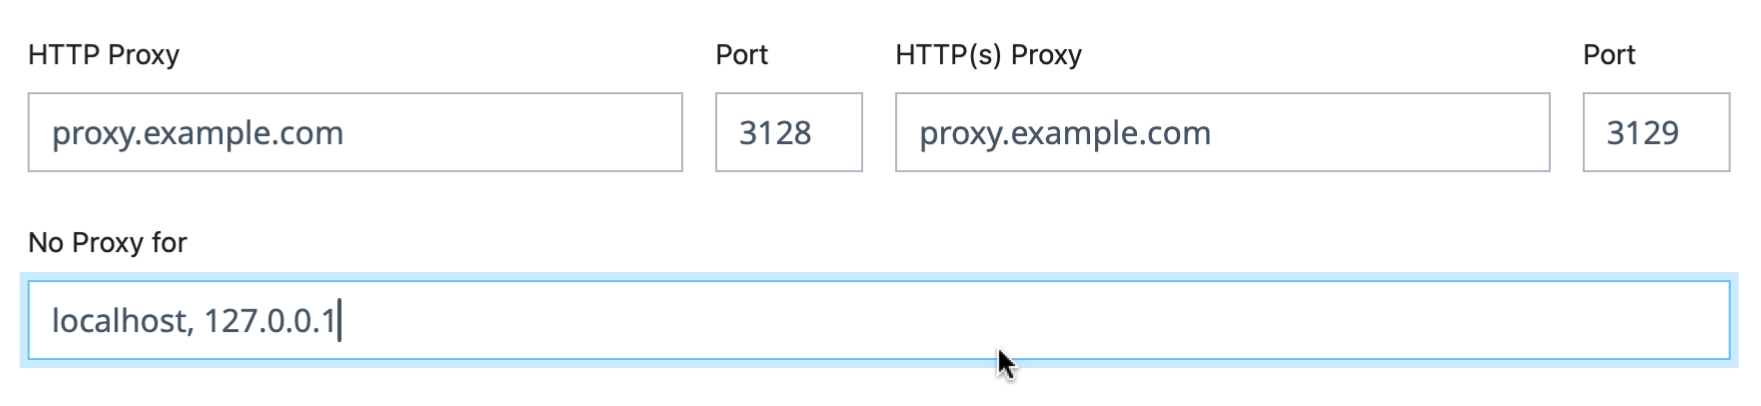
If your edge device network is configured to use the proxy servers to access the
internet, especially accessing the container registries, you need to configure
the proxy servers on your device.
Configuring the network proxy servers on SPEKTRA Edge is easy and straight forward.
You can easily upgrade the SPEKTRA Edge OS to the newer releases.
Go to the Device overview page of the target device under your project by clicking the
name of the device on the Project overview page.
Open the Update device details page by clicking the Edit detail option of the
device menu option.
Click the Edit detail option of the device menu option.
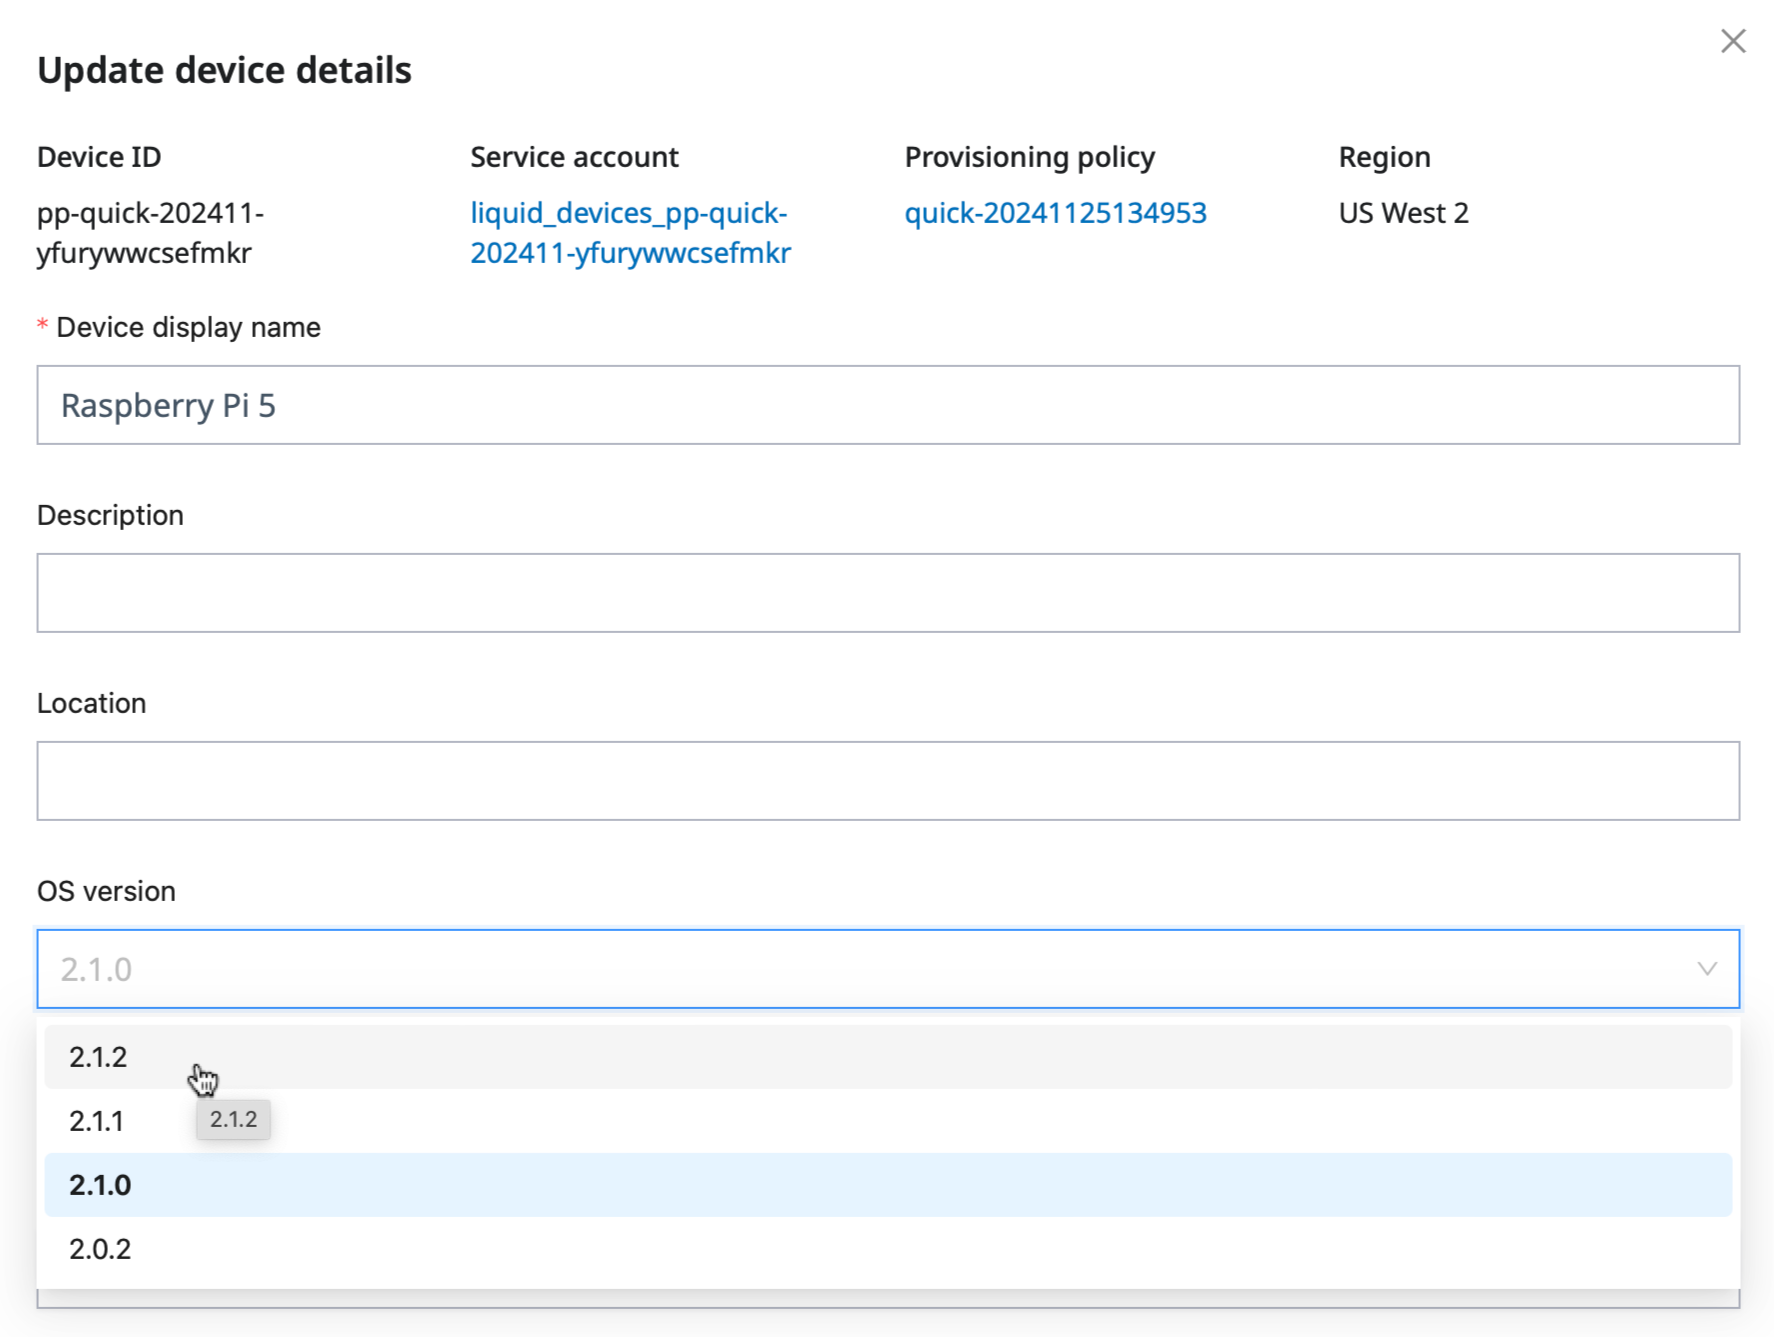
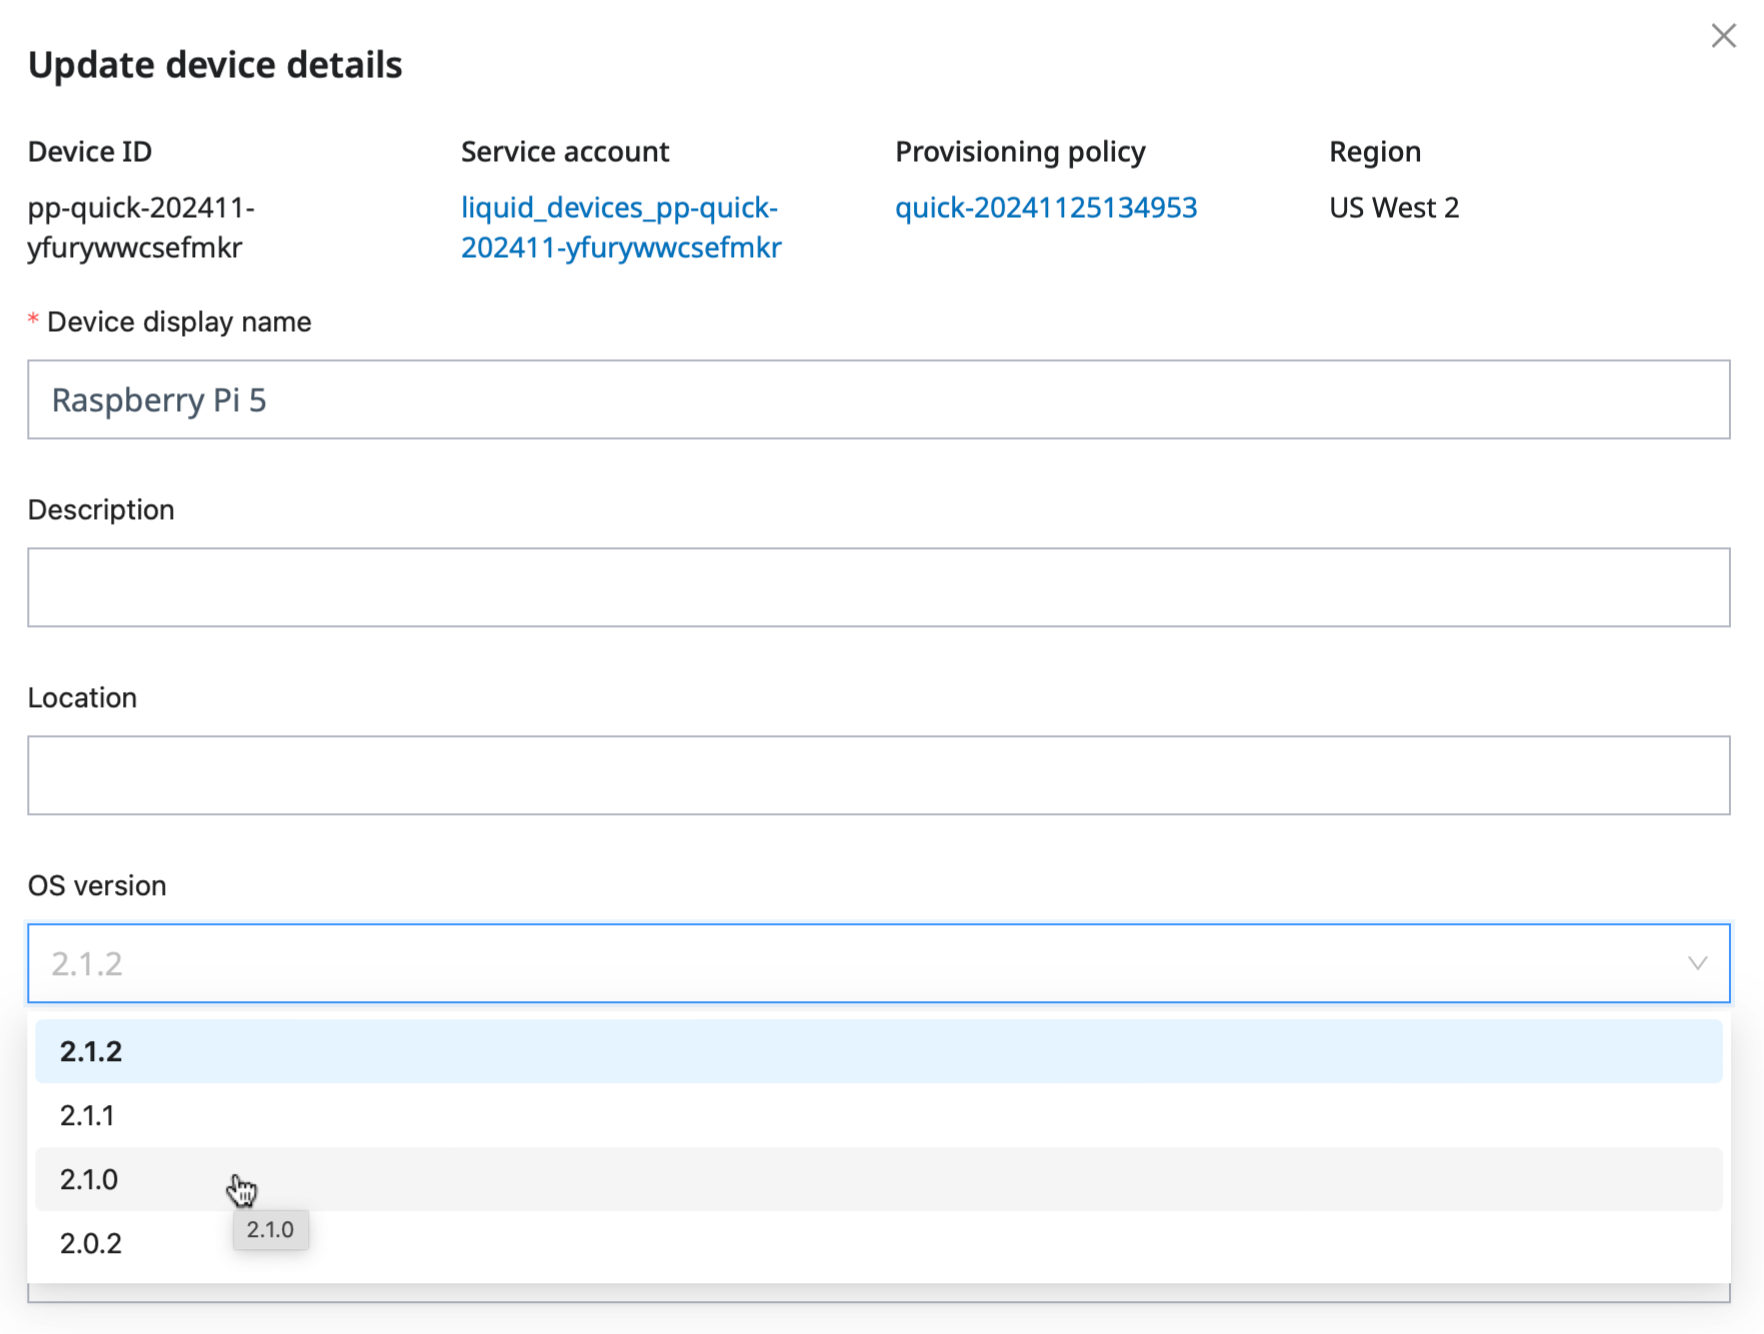
Select the OS version, 2.1.2 in this example, and click Save to trigger the OS upgrade
process.
Specify the desired OS version on the Update device detail page and click Save.
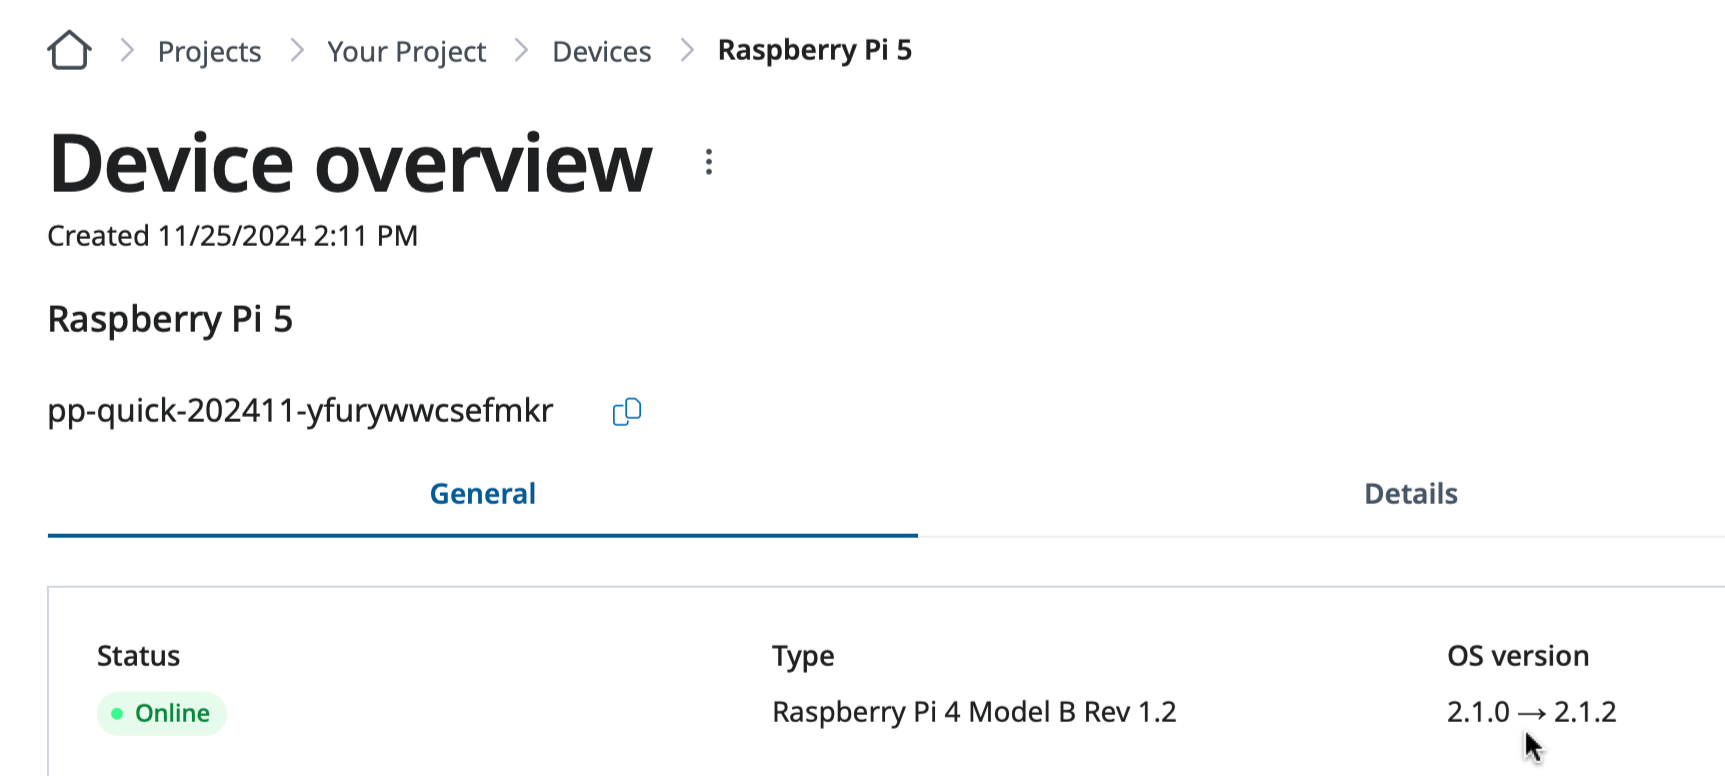
The upgrade operation will start automatically and you will see the OS version transition information
on the Device overview page.
There is a OS version transition information on the Device overview page.
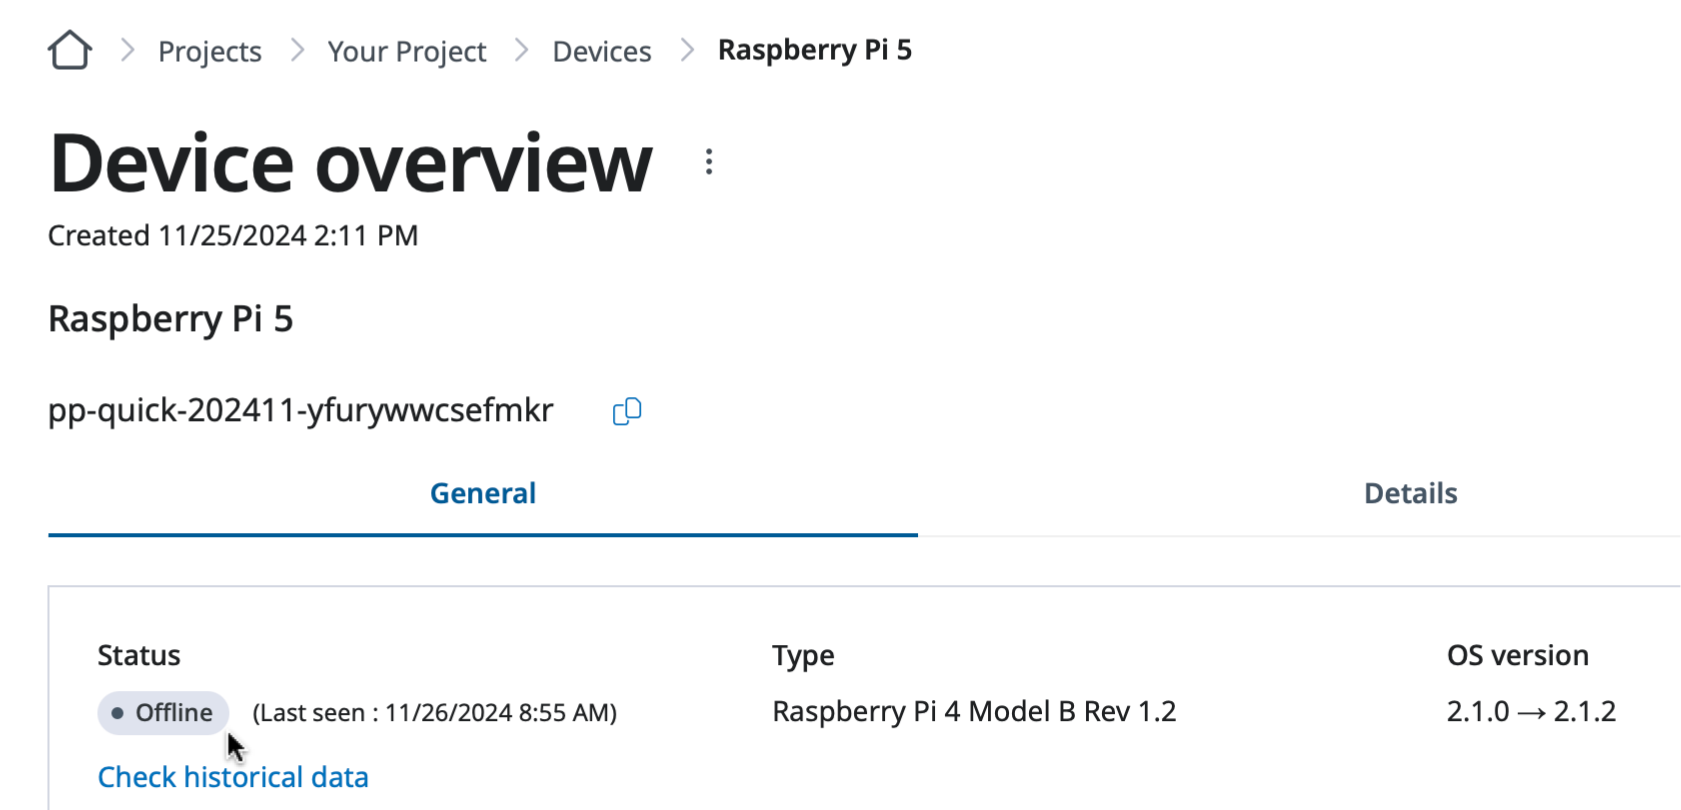
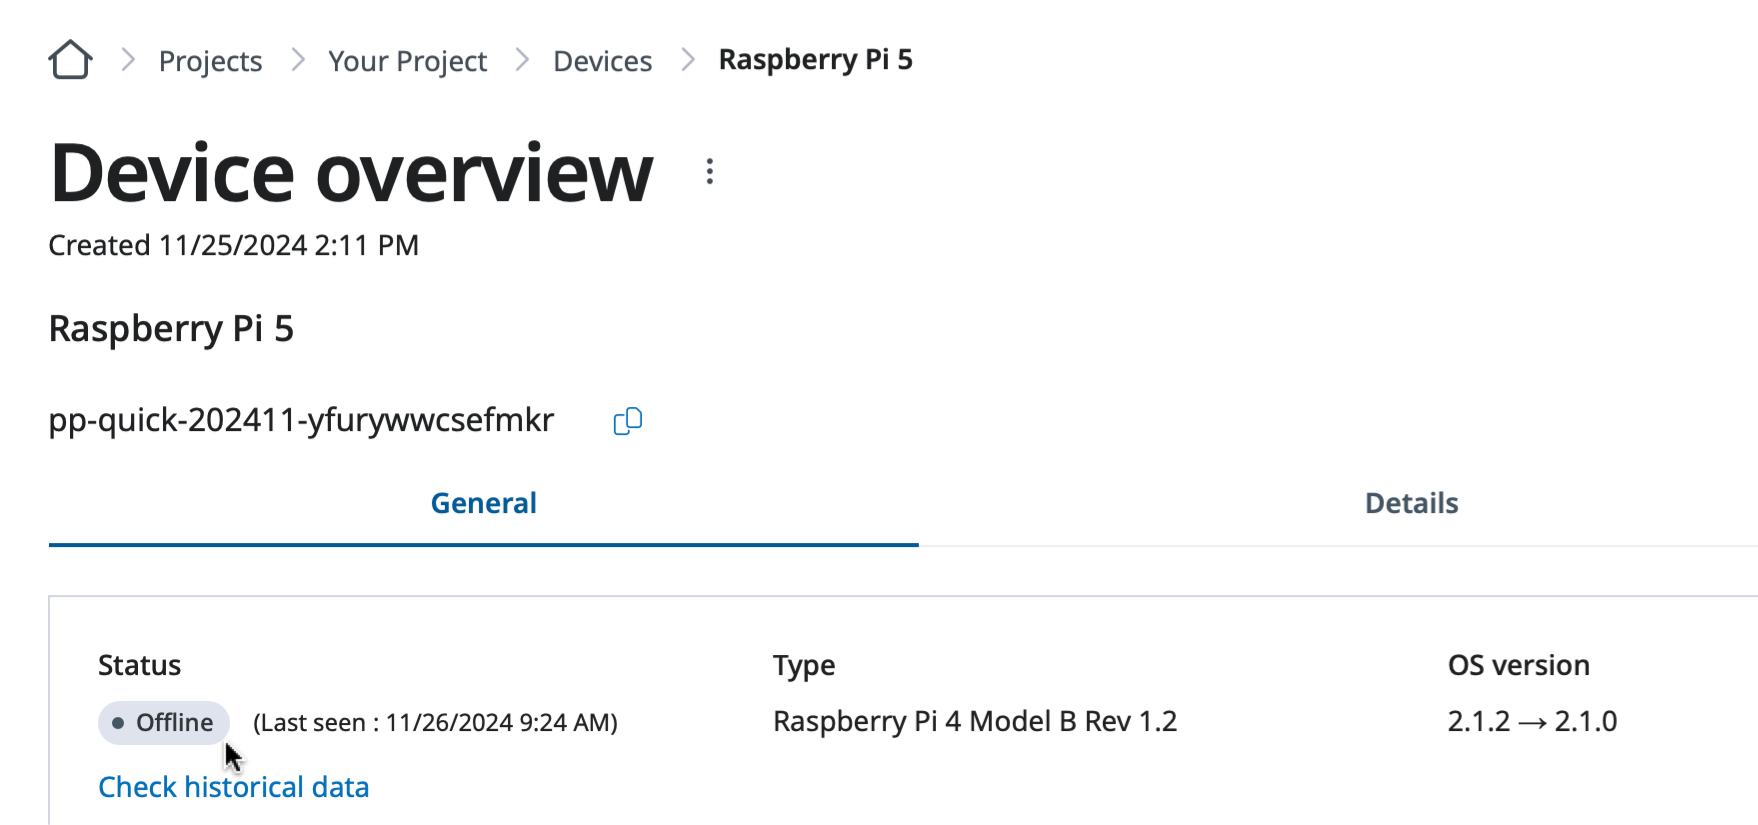
After some time, you will see the device Offline, which indicate the device is restarting
with the new OS version.
The device is shown as Offline to finalize the upgrade process by restarting the device.
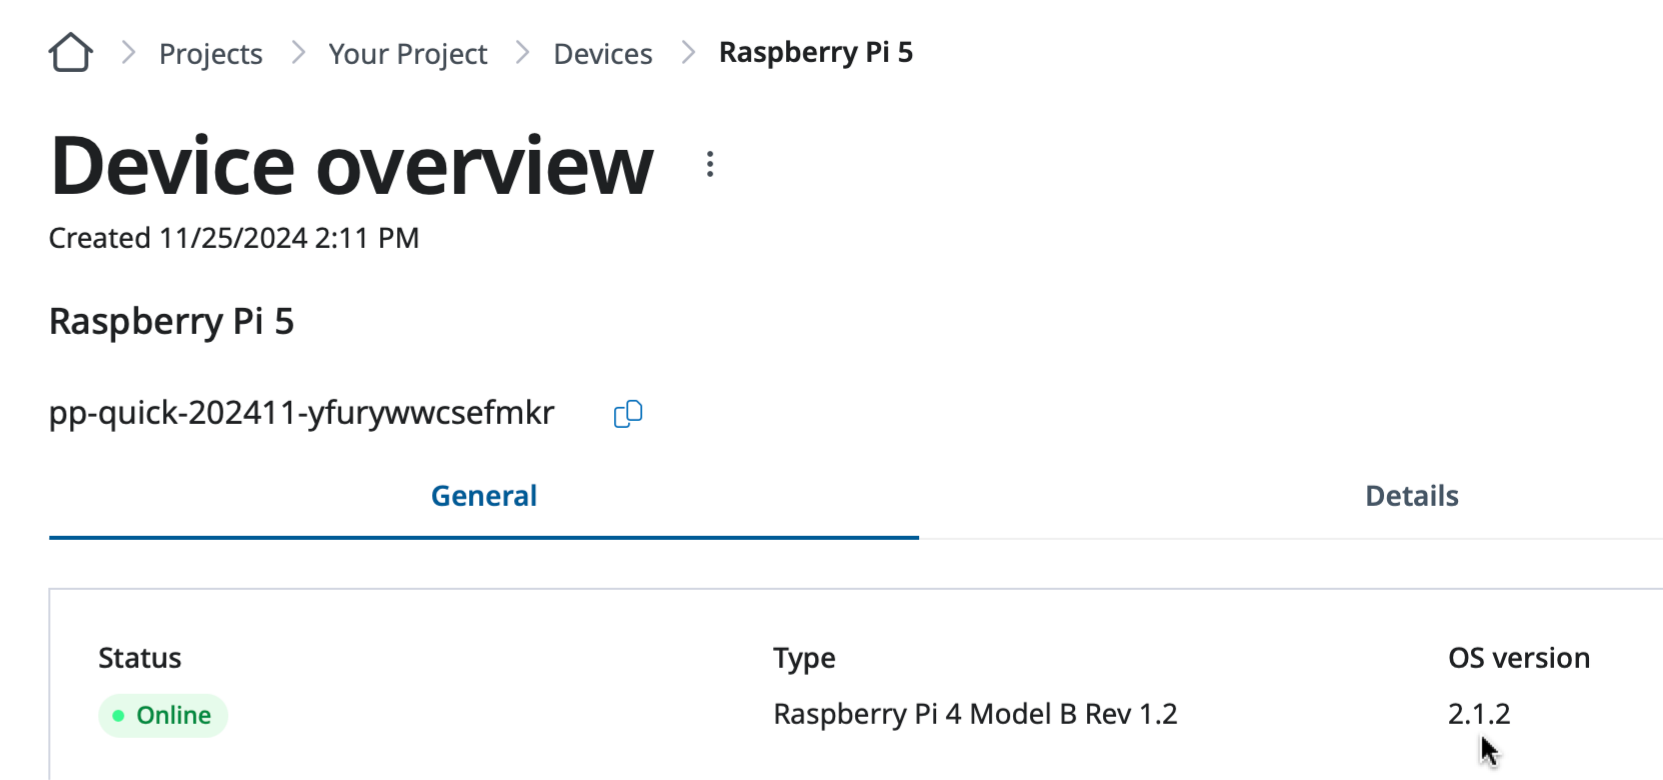
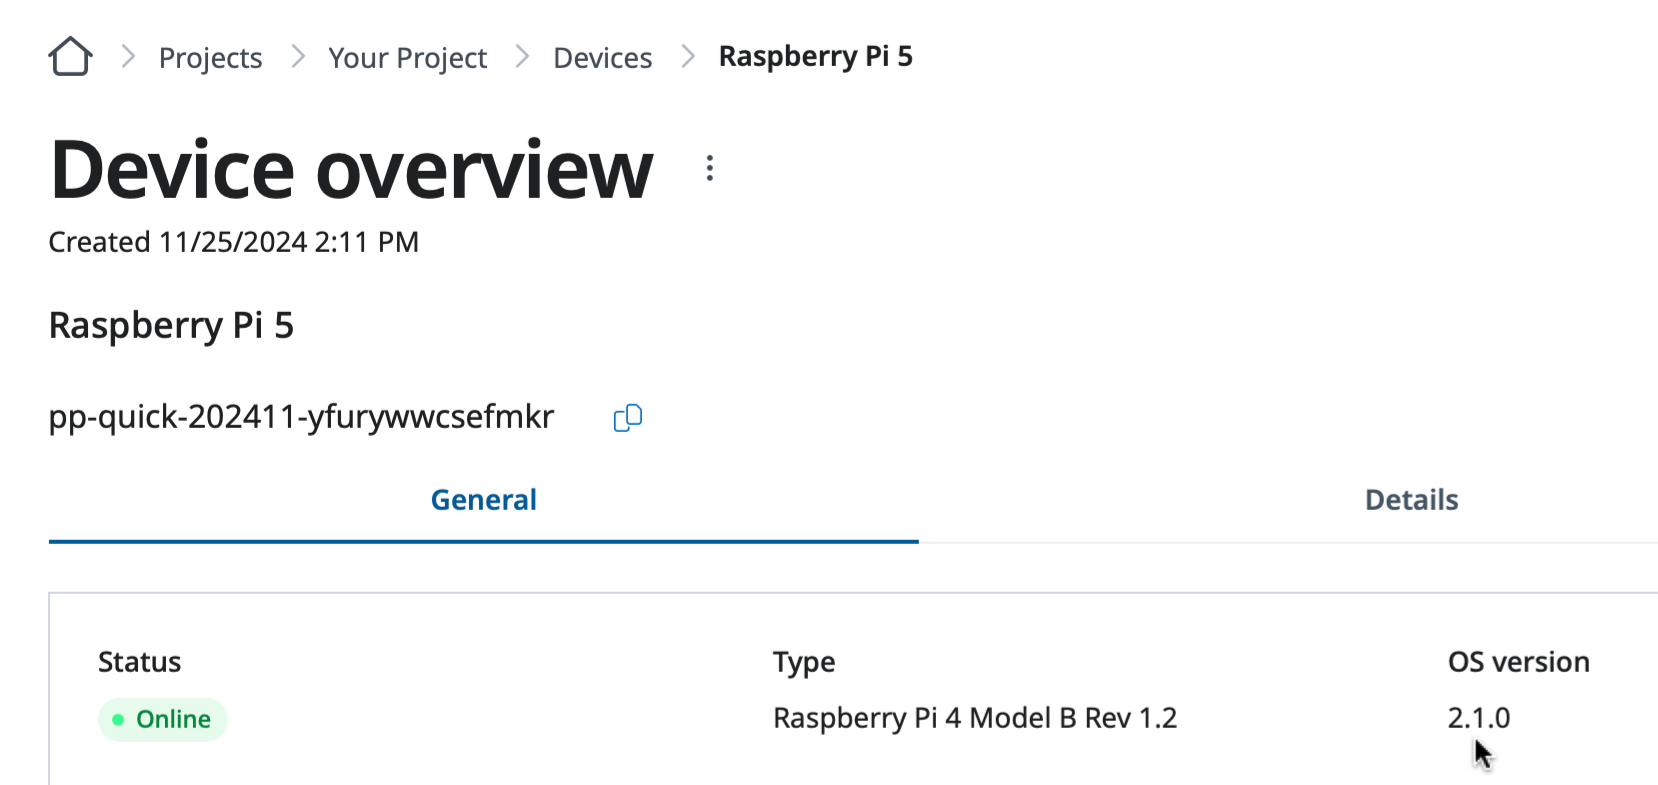
You will see the device up and running with the new OS version on the Device overview page
once it boots up.
The device is up and running with the new OS version.
Downgrade SPEKTRA Edge OS
You can do the same for the downgrade OS release versions as well.
Caution on OS downgrading
Some OS version downgrade could cause some issue, e.g. some features don’t work, unreachable devices,
etc. Please consult the SPEKTRA Edge customer support before conducting the OS downgrade process.
Go to the Device overview page of the target device under your project by clicking the
name of the device on the Project overview page.
Open the Update device details page by clicking the Edit detail option of the
device menu option.
Click the Edit detail option of the device menu option.
Select the downgrade OS version, 2.1.0 in this example, and click Save to trigger
the OS downgrade process.
Specify the desired OS version on the Update device detail page and click Save.
The OS downgrade process automatically starts once you click the Save button of the
Update device details page.
After a minutes or so, you will see the device status Offline with the OS version transition
information on the Device overview page.
There is a OS version transition information on the Device overview page.
You will see the device up and running with the new OS version once it boots up.
The device is up and running with the new OS version.
Next step
Congratulations for mastering how to manage SPEKTRA Edge OS release versions.
Let’s move on to the next learning material, managing alerts on SPEKTRA Edge.
Onwards.
4.4 -
Manage alerts
Let’s learn how to manage alerts on SPEKTRA Edge.
SPEKTRA Edge offers powerful alerting system built-in to monitor majority part
of the system managed by the platform, includes devices and applications. The
platform even allow you to extend the standard alert system by defining brand new
alerts to meet your needs.
In this page, we will learn how to create standard alerts, the device connection
status alert and the CPU utilization alert, to get familier with the SPEKTRA Edge
alerting system.
See also
Alert metrics: a catalog of everything you can alert on
(CPU, memory, disk, temperature, network, cellular signal, health checks, and
application metrics) with practical use cases.
AI Alerting: anomaly detection, adaptive thresholds, and an AI
agent that investigates and remediates fired alerts for you.
What you need
You need the followings to setup the alerts on SPEKTRA Edge.
The alerting policy is the top component to organize both the alerting conditions
and the notification channels. It also contains the triggered alerts so that you
can observe the historic alerts for the particular policy.
The alerting condition let you express the condition in which the alert happens,
for example, the device loses the connection or the CPU utilization passes a
certain threshold.
The notification channel expresses how and where the alert is sent, either through
email or slack.
Please take a look at the following diagram to understand the relationship of those
three components.
---
markmap:
  zoom: false
  pan: false
---

# Alerting poilicy

## Alerting conditions

- CPU utilization condition
- Memory utilization condition
- Disk utilization condition
- Device hardware temperature condition

## Notification channels

- Slack notificaiton
- Email notification

## Triggered alerts

- CPU utilization alert fired at 11/10/2024 11:45 on device 5
- Memory utilization alert fired at 11/09/2024 09:45
  and resolved in 2 hours on device 2
- etc.
Multiple alerting conditions and notification channels
Multiple conditions and channels is allowed under the alerting policy, as shown
in the diagram above, though, it’s not a necessity.
You can create the alerting policy with one alerting condition and one notification
channel. You can create a policy even without a notification channel.
Let’s take a look at those more detail with the actual example.
Alerting policies
A alerting policy is the top level component to organize both the alerting
conditions, notification channels, and the actual triggered alerts.
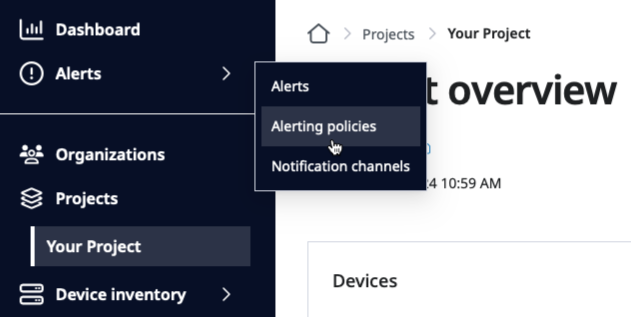
Select the Alerting policies option of the Alerts pull down-menu to go
to the Alerting overview page.
Selecting the Alerting policies option from the Alerts pull down menu.
Once you’re on the Alerting overview page, click the Create alerting policy
button located at the top right corner.
Click the Create alerting policy on the Alerting overview page.
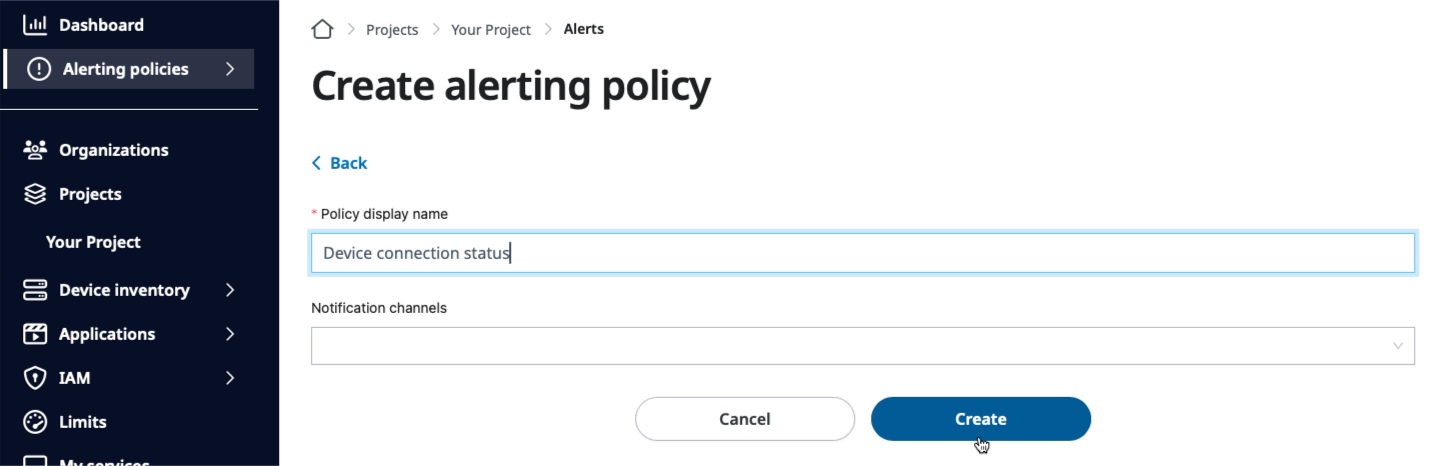
Fill in the alerting policy name and click Create. We’ll fill in
the notification channels in the later stage.
Create the alerting policy by clicking the Create button on the Create alerting policy page.
That’s it. Let’s move on to the alerting condition next.
Alerting conditions
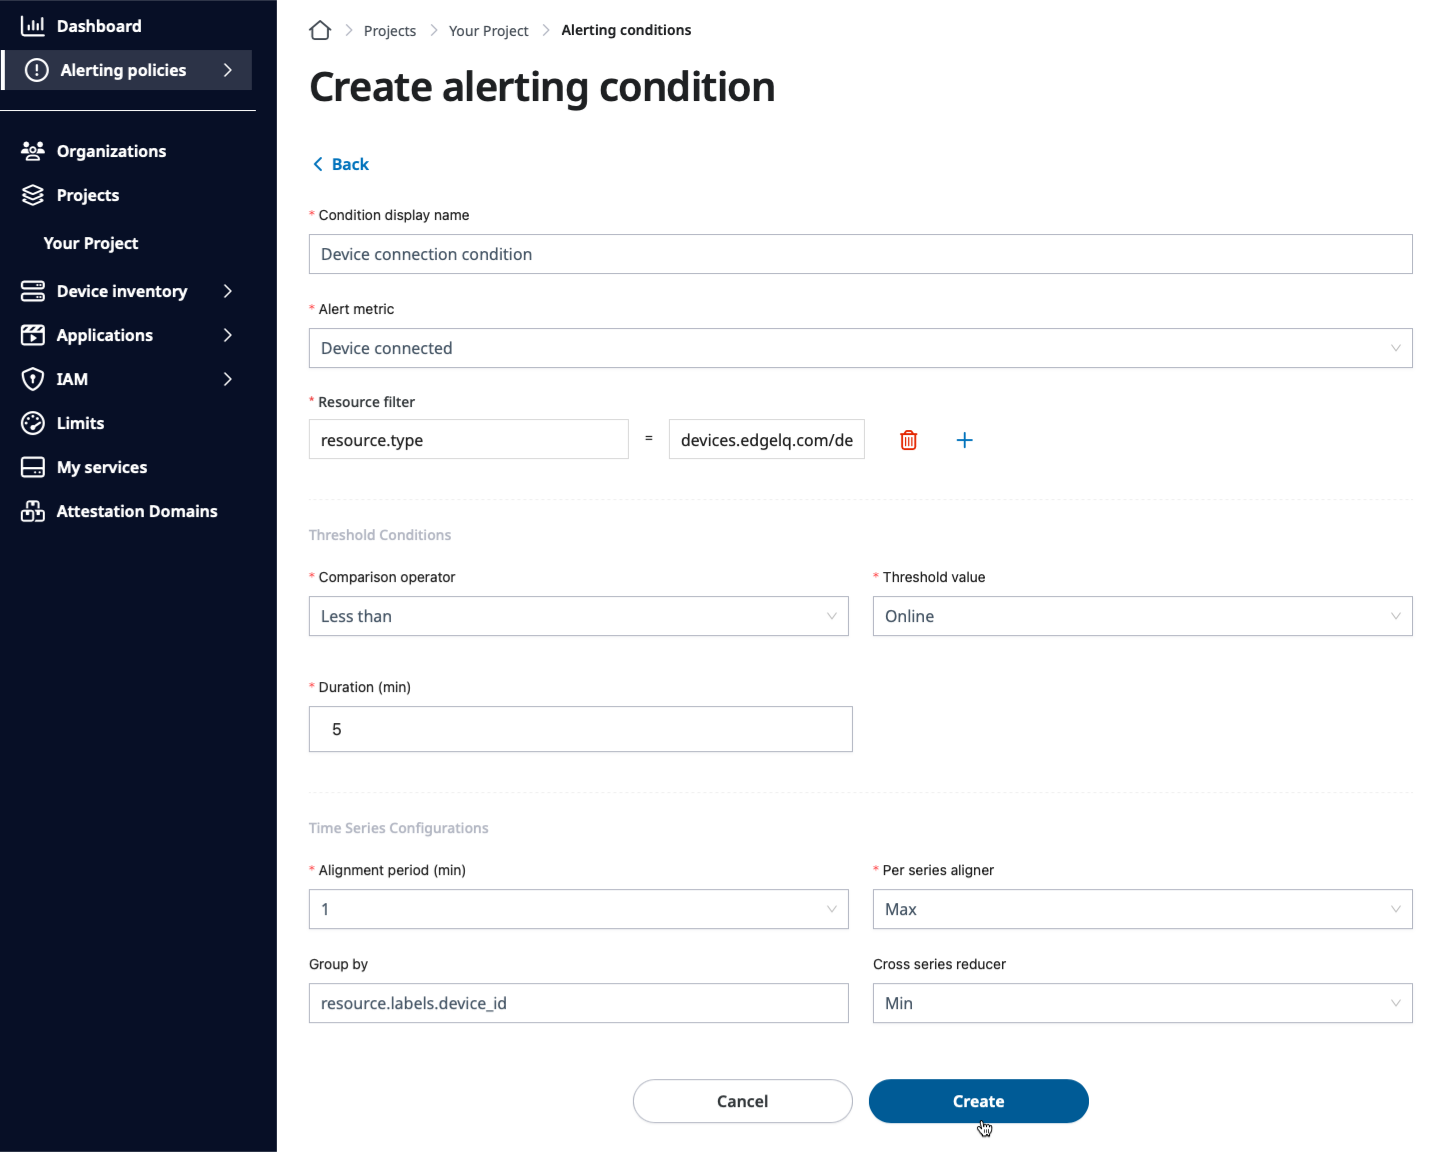
Let’s create the alerting condition to detect the device connection status.
A alerting condition, as the name suggests, defines the condition to trigger
alerts. It’s grouped in three different sections and we’ll go over those
one-by-one in the following sections.
But first, let’s open the Create alerting condition page by clicking the
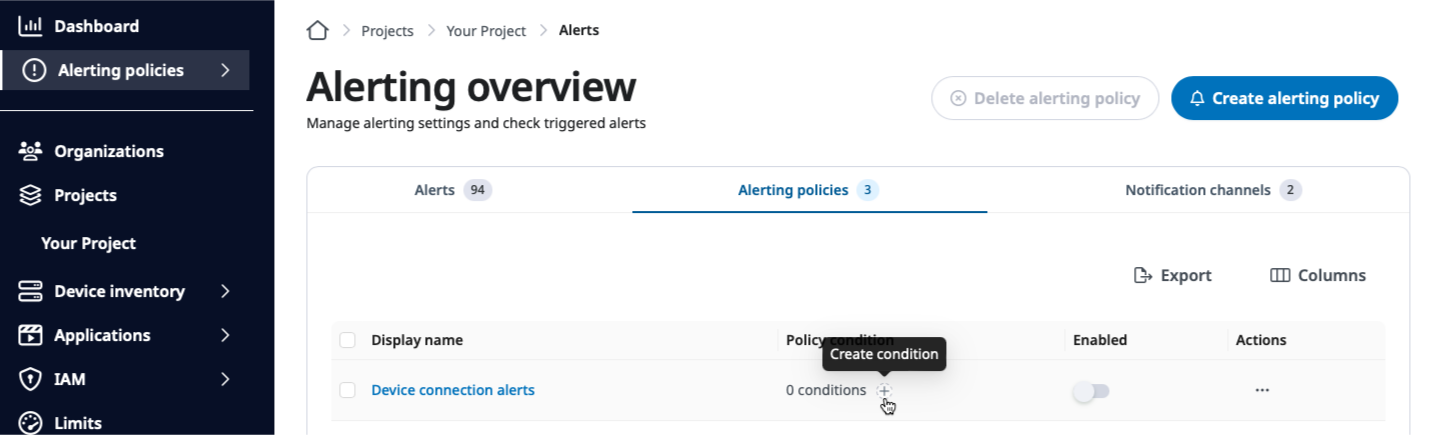
policy condition plus sign on the Alerting overview page.
Create the alerting condition by clicking the plus sign on the Alerting overview page.
Alert metrics
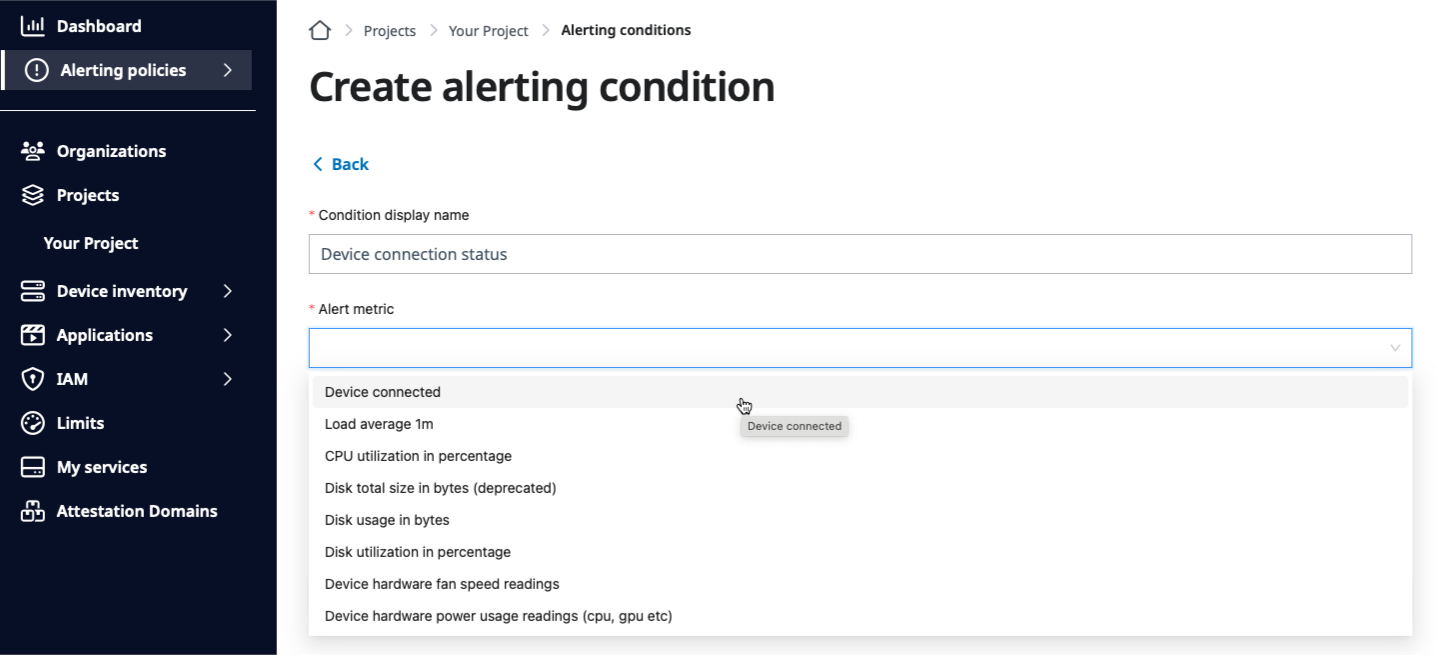
The alert metric section is the first thing to set on the Create alerting condition
page. It gives you all the alerting options supported by the system. You could
browse those to understand what are covered by the SPEKTRA Edge alerting
system.
Let’s select the Device connected alert metric type for the device connection
status alerting condition.
Select the Device connected alert metric option as the Alert metric value.
You don’t need to touch the resource filter section, which is automatically set
by the system, unless you need the additional filtering.
Threshold conditions
The threshold conditions section is where to configure the alerting condition.
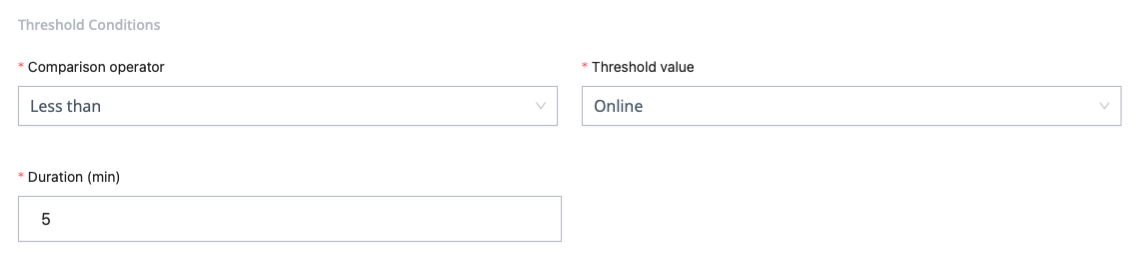
Here is the threshold condition for the device connection status alerting condition
for firing alerts when the device is offline for more than five minutes.
The threshold condition for the device is offline more than five minutes.
Since the Online status is treated as number one and Offline as number zero,
we use the Less than operator against the Online status to detect the
device offline event. You set the duration time to five minutes to express
the system to trigger alerts when the device is offline more than five minutes.
Time series configurations
The time series configuration section expresses how to aggregate data points for
the targetted time series data. There are two time series aggregation functionalities
here.
the alignment period with the per series aligner
the time-series grouping with the cross series reducer
Let’s take a look at the actual example to understand those two functionalities.
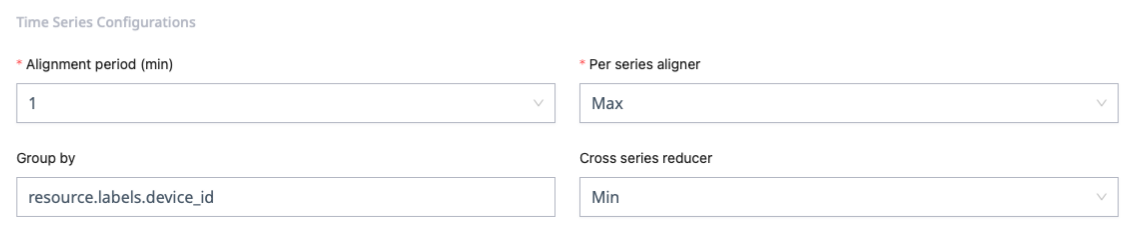
The time series configuration to aggregate time series data points.
Here is the detailed description.
the alignment period to one minutes with the Maxper series aligner
resource.labels.device_id based grouping with the Mincross series reducer
The first aggregation is for the noise reduction. It treats the device
is offline only when it’s offline for the entire one minutes.
The second aggregation is to treat each devices under the project separately, which
is the the grouping part. Since there is only one state for the device connection,
the reducer doesn’t mean anything. We’ll take a look at the
other example and explain the usage of the reducer there.
Let’s click Save as you completed the device connection status alerting
condition.
Click Save to finish the device connection status alerting condition.
Here is the brief description of the typical aligners and reducers for your reference.
Aligner name
The aligned data point
None
No alignment made and keeps all the time-series data points.
Mean
The average or arithmetic mean of the data points in the alignment period.
Min
The minumum value of the data points in the alignment period.
Max
The maximum value of the data points in the alignment period.
Count
The count of the data points in the alignment period.
Sum
The sum of the data points in the alignment period.
Stddev
The standard deviation of the data points in the alignment period.
Percentile 99
The 99th percentile of the data points in the alignment period.
Percentile 95
The 95th percentile of the data points in the alignment period.
Percentile 50
The 50th percentile of the data points in the alignment period.
Percentile 5
The fifth percentile of the data points in the alignment period.
Reducer name
The reduced data point
None
No cross time-series reduction.
Mean
The mean across the aligned data points of the multiple time series.
Min
The minium of the aligned data points of the multiple time series.
Max
The maximum of the aligned data points of the multiple time series.
Sum
The sum of the aligned data points of the multiple time series.
Stddev
The standard deviation of the aligned data points of the multiple time series.
Count
The count of the aligned data points of the the multiple time series.
Percentile 99
The 99th percentile of the aligned data points of the multiple time series.
Percentile 95
The 95th percentile of the aligned data points of the multiple time series.
Percentile 50
The 50th percentile of the aligned data points of the multiple time series.
Percentile 5
The fifth percentile of the aligned data points of the multiple time series.
Monitoring API document
Please take a look at the monitoring service API document for the technical
details for the aligners and the reducers.
A notification channel allows you to configure how to notify alerts over
multiple channels.
There are three types of notification channels supported by the SPEKTRA Edge.
Email
Slack
Webhook
Each channel will be created separately and be tied to the alerting policy to
be operational. A single channel can be shared by multiple alerting policies
We will go over how to create all three channels below and link those to the
alerting policy we’ve created in the previous step.
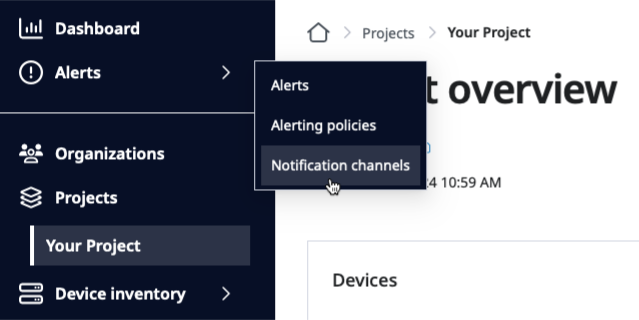
Select the Notification channels option of the Alerts pull-down menu to
open the Alerting overview page.
Select the Notification channels option from the Alerts pull-down menu.
Click the Create notification channel button to create a notification channel.
Click the Create notification channel button on the Alerting overview page
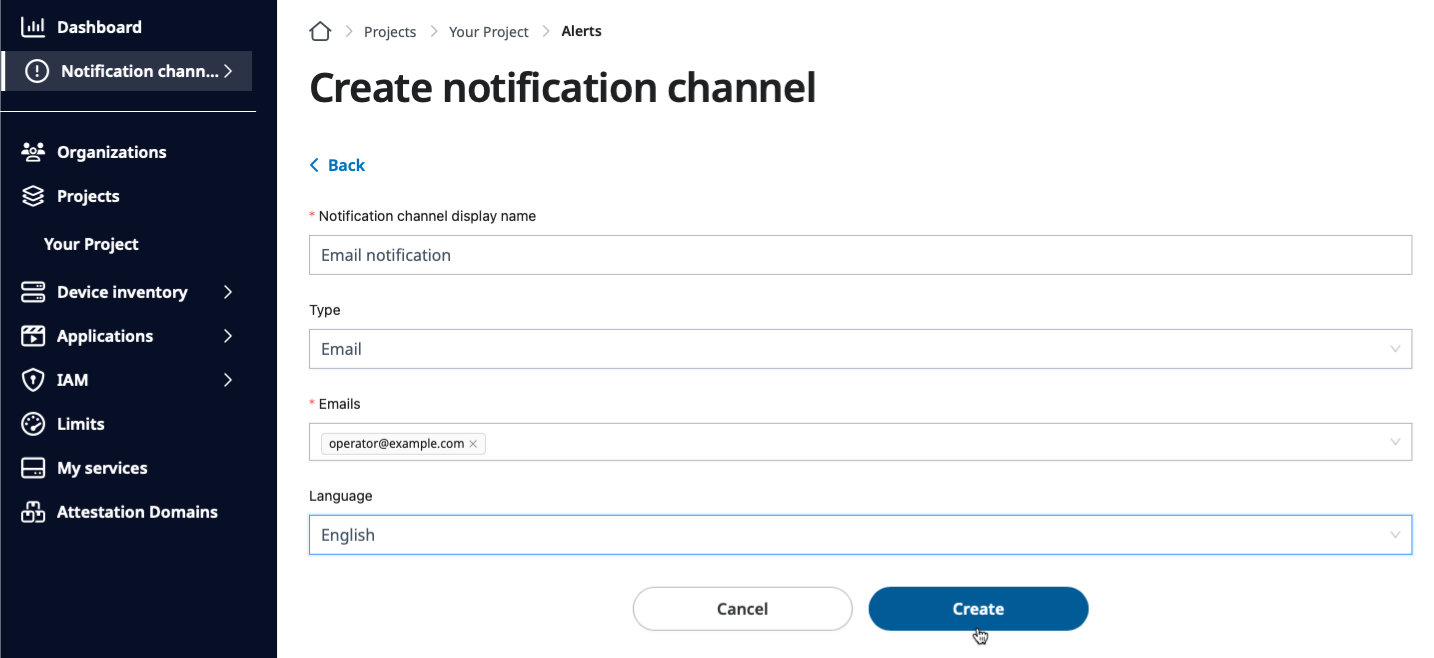
To create the email notification channel, you need to
select Email in the type field
fill in the email address(es) in the Emails field
and click the Create button.
Fill in the email address(es) and click the Create button.
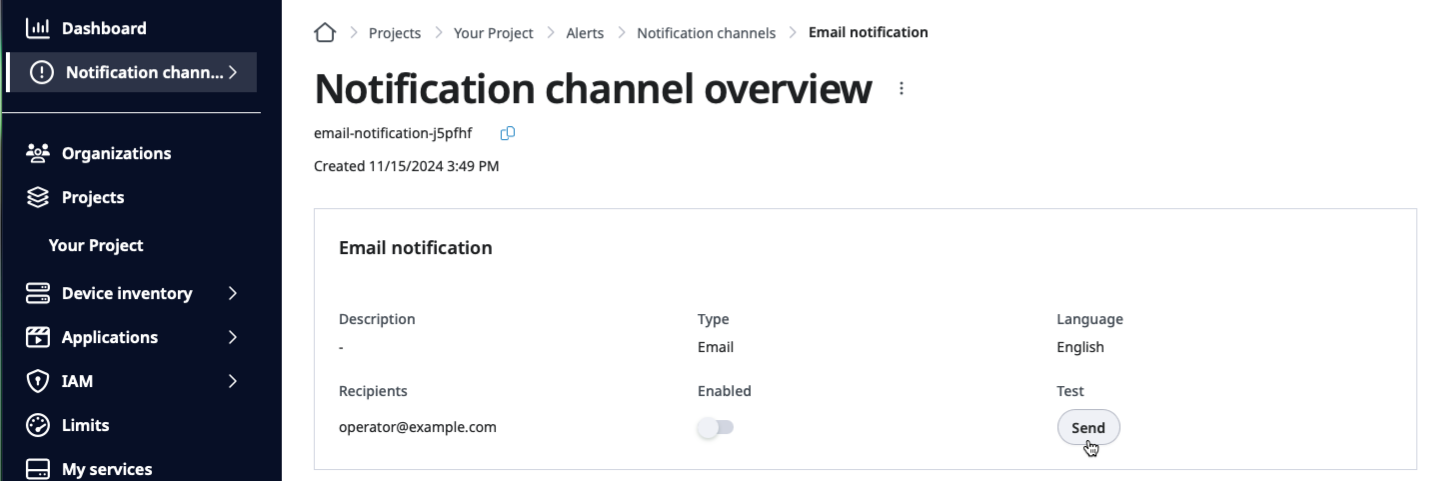
Click the Send button to send the test email notification to verify the
configuration.
Clicking the Send button to send the test email notification.
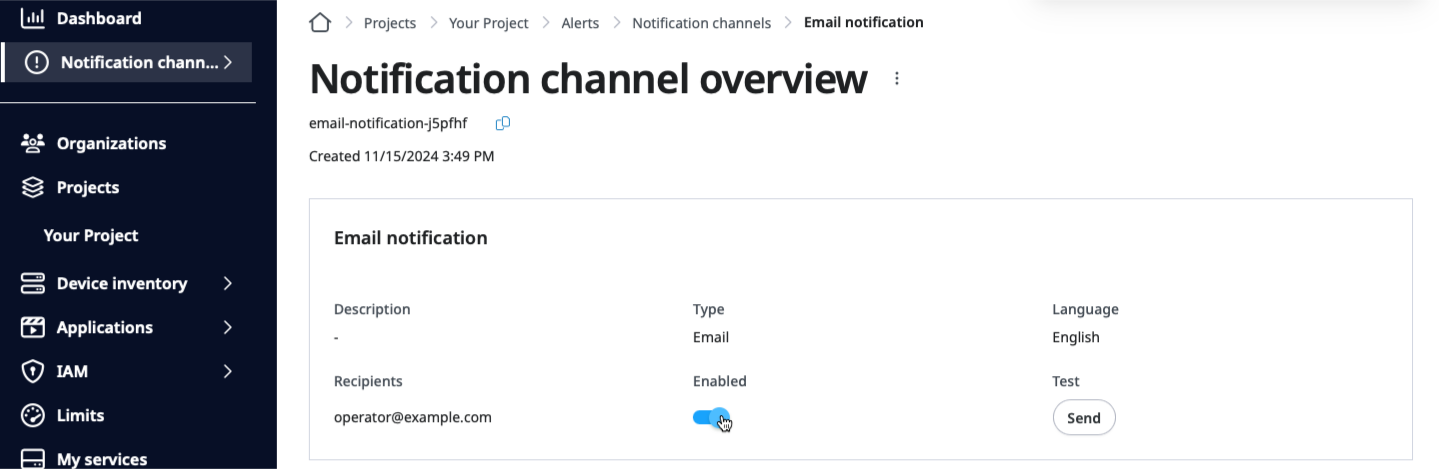
Enable the notification channel by clicking the Enabled switch once
you verify receiving the test email notification from SPEKTRA Edge.
Enabling the email notification channel.
You need a webhook endpoint to configure the Slack notification channel on
SPEKTRA Edge.
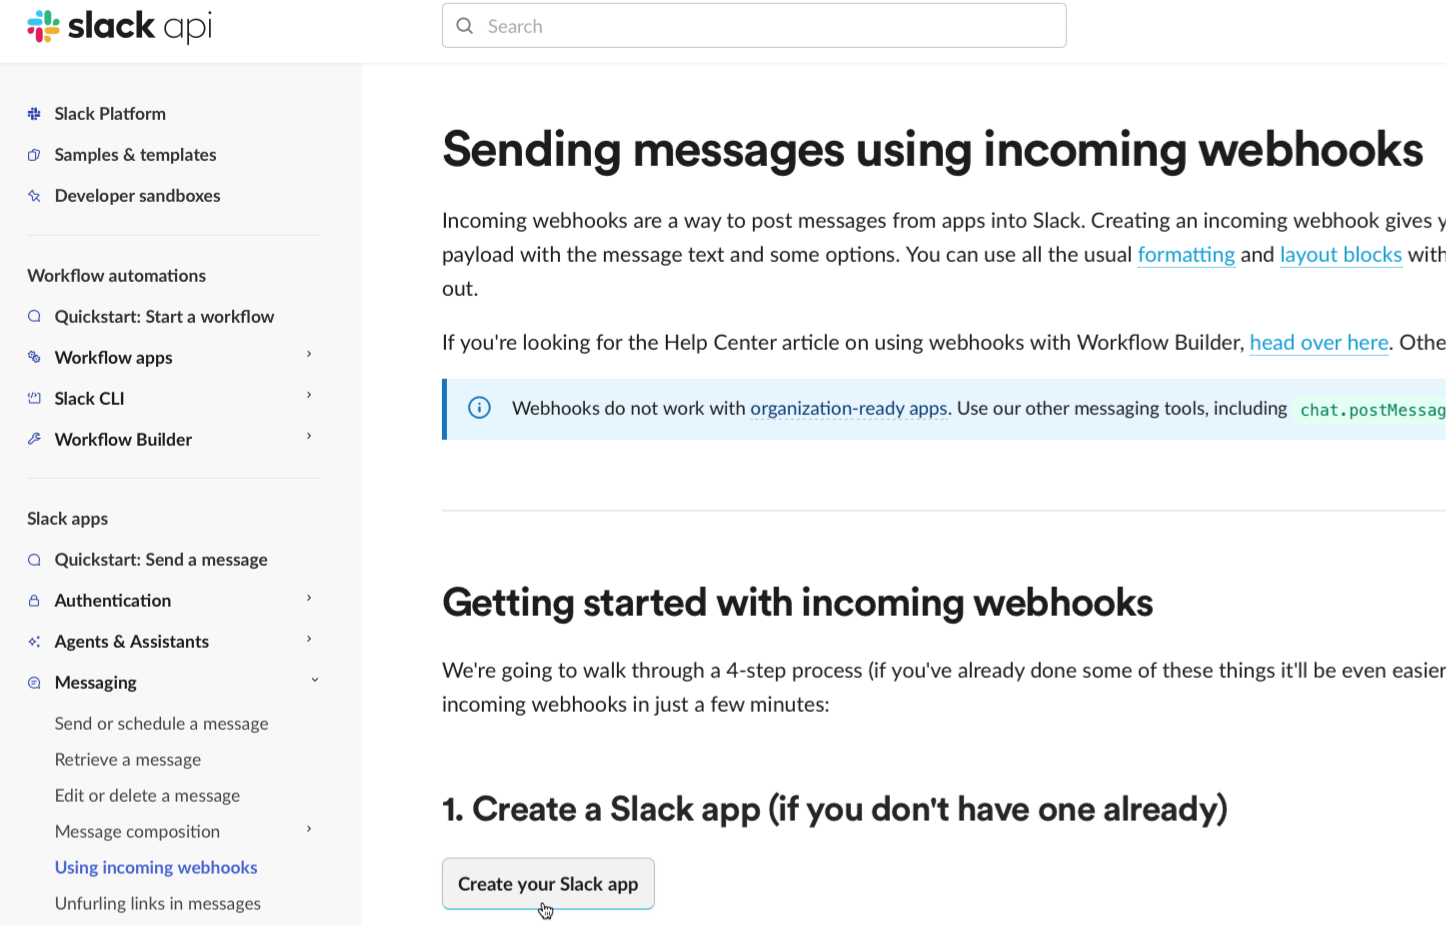
Go to the official slack api page and create your Slack app,
if you haven’t have one yet, by clicking the Create your Slack app button.
Clicking the Create your Slack app button on the Slack api page.
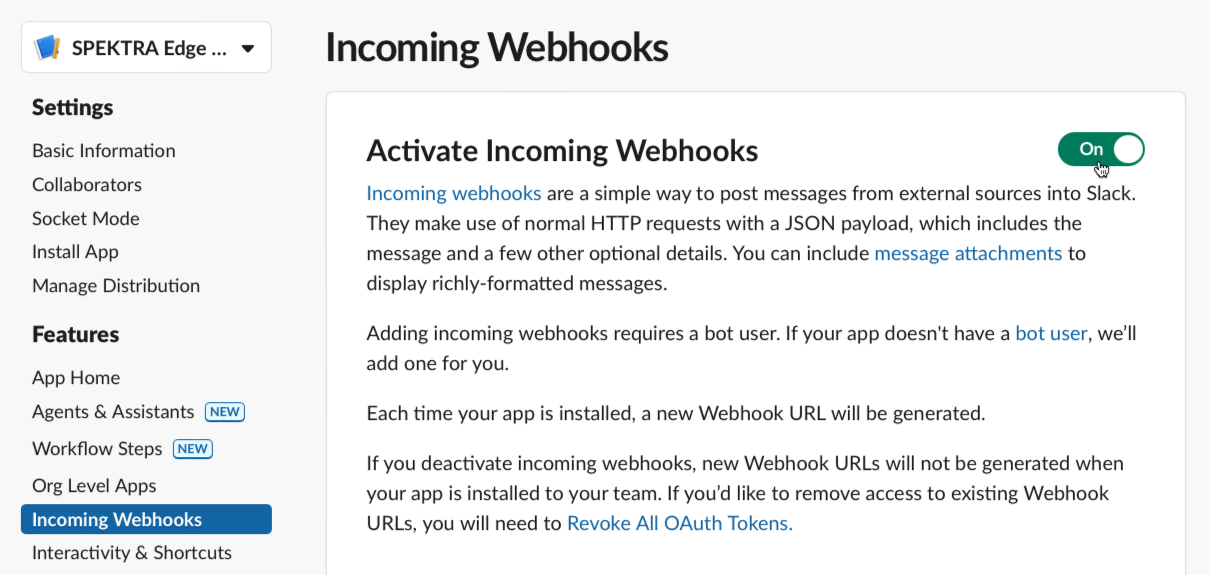
Once you have your Slack app, go to the Incoming webhooks section and activate
the incoming webhooks by toggling the Incoming Webhooks switch On.
Activating the incoming webhooks by making the switch On.
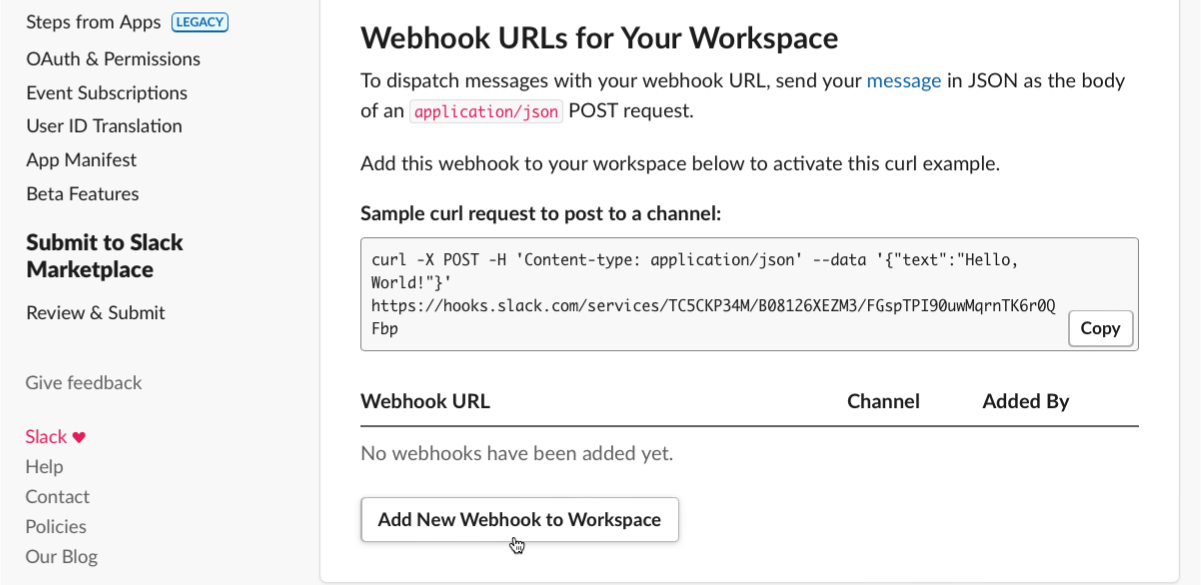
Create a new webhook endpoint by adding the new webhook to your Slack
workspace.
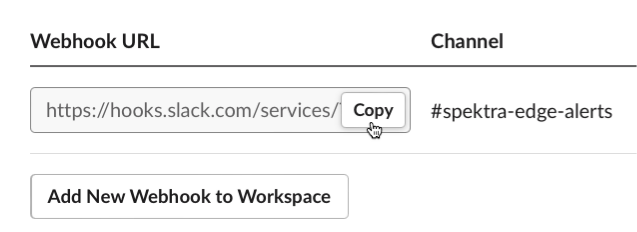
Getting the new webhook by clicking the Add New Webhook to Workspace button.
Copy the webhook URL by clicking the Copy button of the newly created
webhook URL.
Copying the webhook URL for the newly created webhook URL.
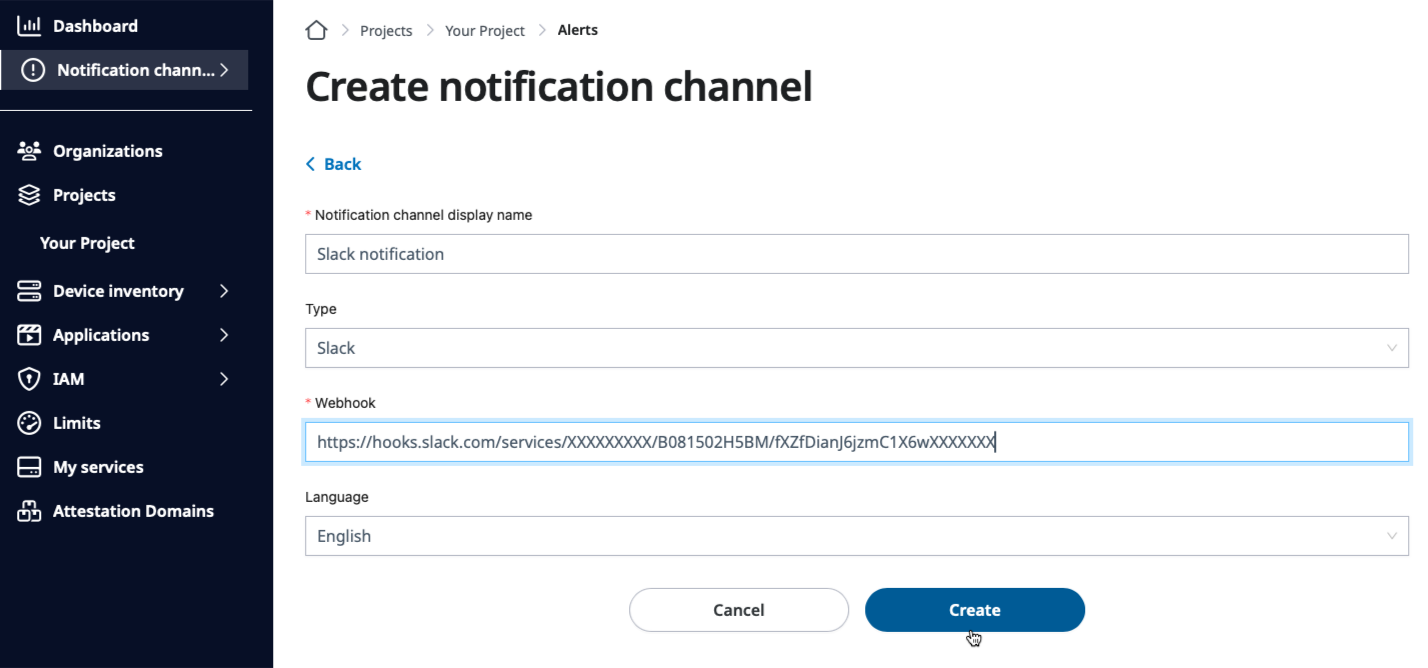
Now, go back to the SPEKTRA Edge dashboard and set the webhook URL you just copied
on the Create notification channel page after selecting the notification type to
Slack.
Paste the webhook URL you copied above and click Create on the Create notification channel page.
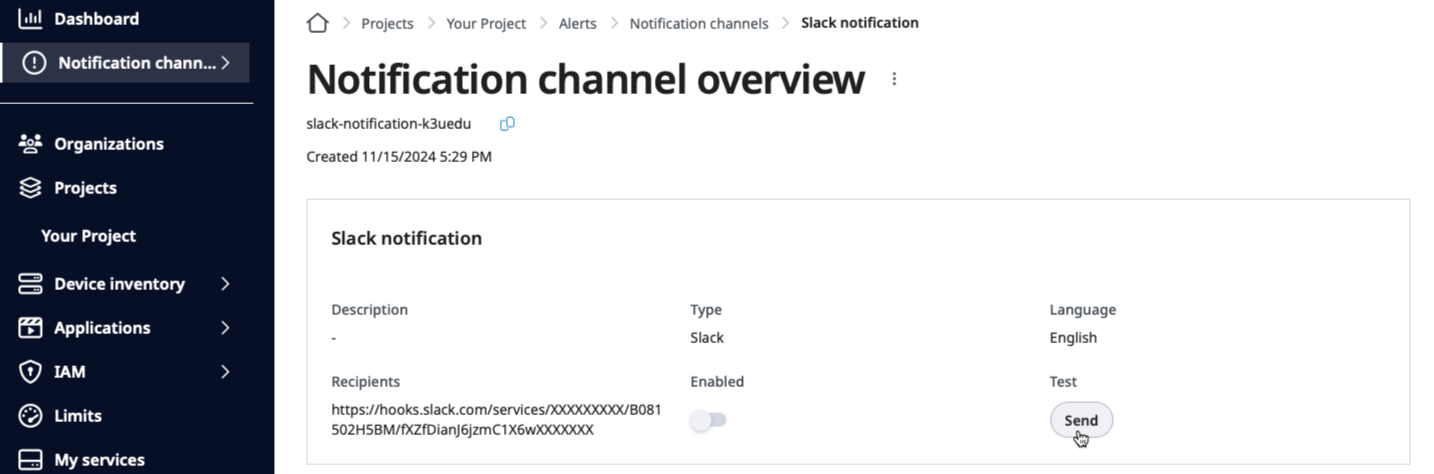
Once the slack notification channel is created, let’s verify it by sending the
test slack notification.
Go to the Notification channel overview page and click the Send button
to send the test Slack notification.
Clicking the Send button to send the test slack notification.
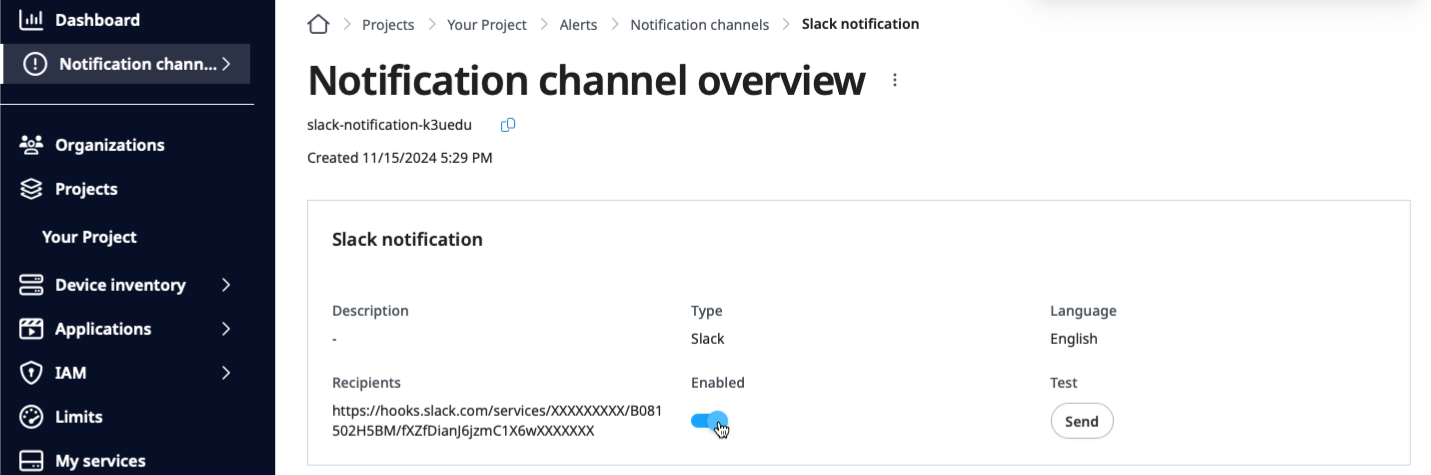
Enable the notification channel by clicking the Enabled switch once
you verify receiving the test Slack notification from SPEKTRA Edge.
Enabling the slack notification channel.
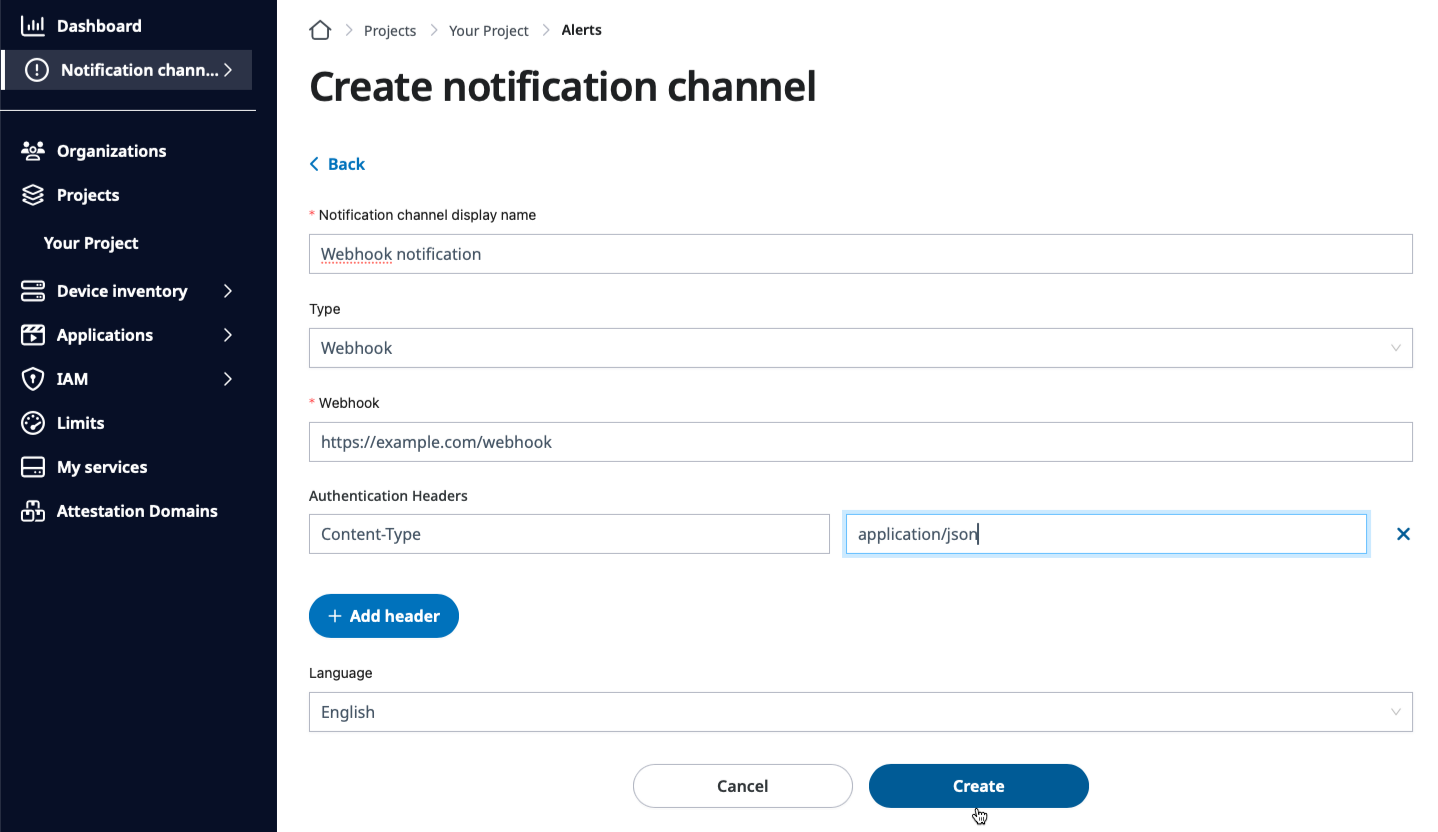
To create the webhook notification channel, you need to
select Webhook in the type field
provide the webhook endpoint in the Webhook field
add the Content-Type: application/json header in the Add headers field
and click the Create button.
Fill in the webhook endpoint and click the Create button.
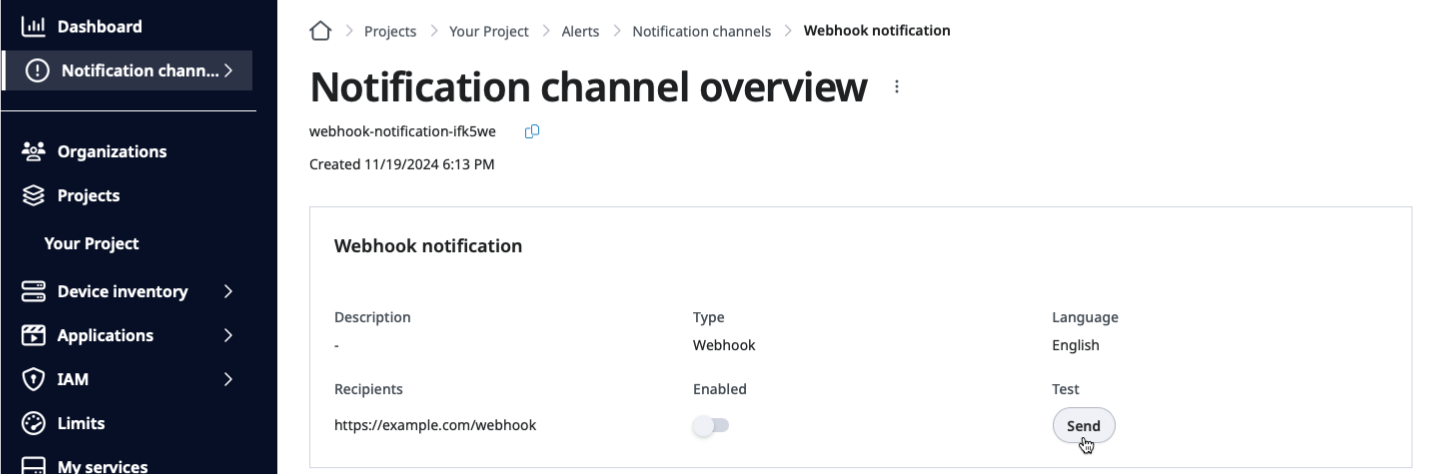
Click the Send button to send the test webhook notification to verify the
configuration.
Clicking the Send button to send the test webhook notification.
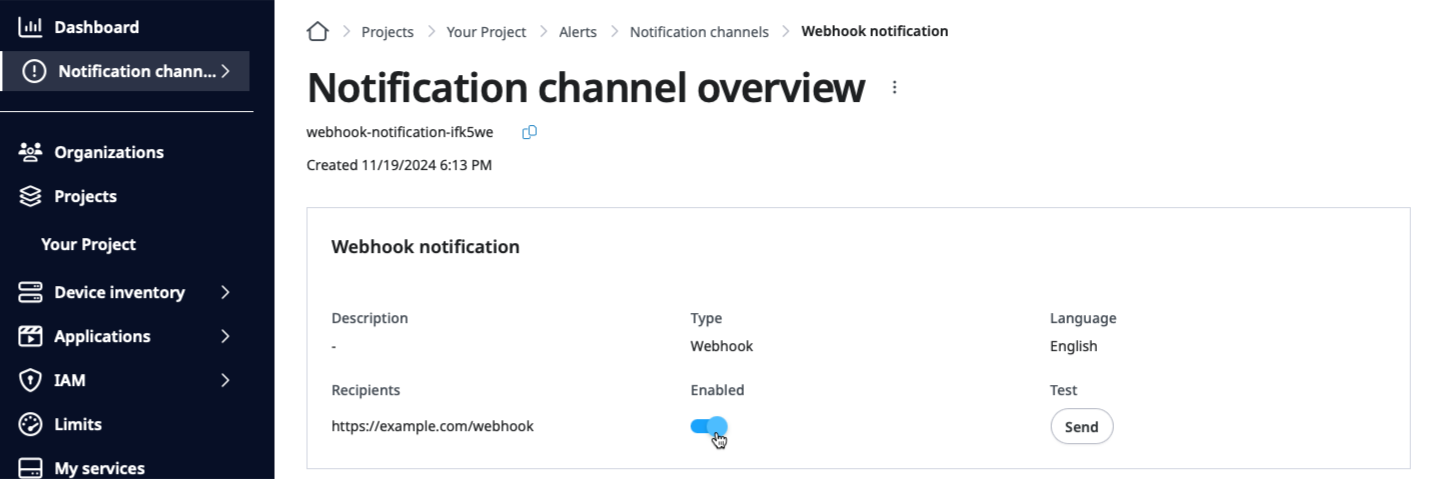
Enable the notification channel by clicking the Enabled switch once
you verify receiving the test webhook notification from SPEKTRA Edge.
Enabling the webhook notification channel.
Here is the sample alert JSON data sent over to the webhook endpoint for
the device connection status alerting condition.
With all those three components configured, We’re ready to enable the alerting
policy to monitor the device connection status for all the devices under the
project.
Go to the Alerting overview page by selecting the Alerting policies option
of the Alerts pulldown menu.
Selecting the Alerting policies option from the Alerts pull down menu.
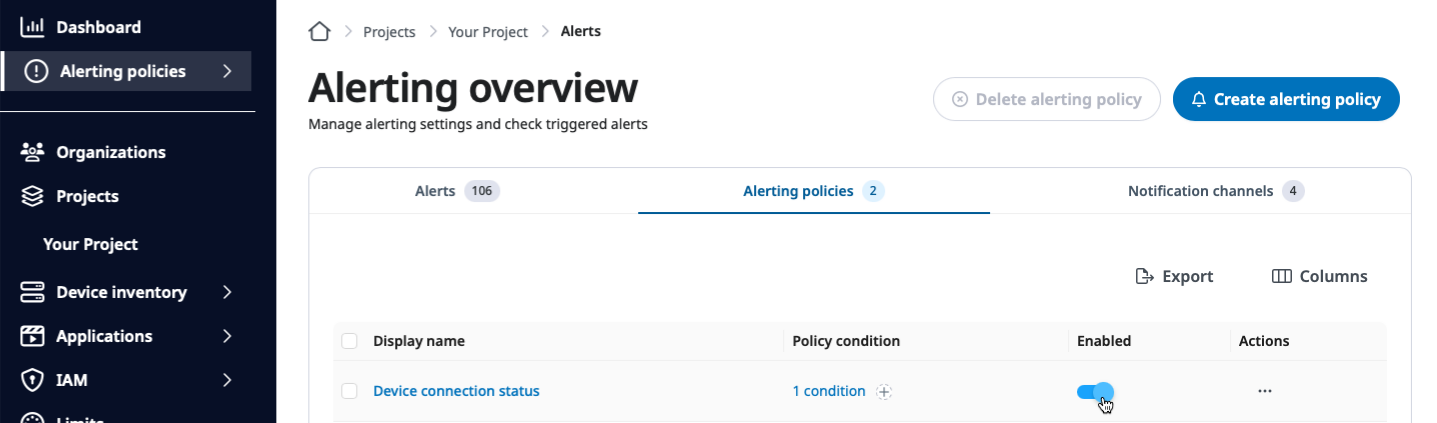
Enable the alerting policy by sliding the Enabled switch to be on for
the Alerting policy you created named Device connection status.
Enabling the alerting policy by sliding the Enabled switch.
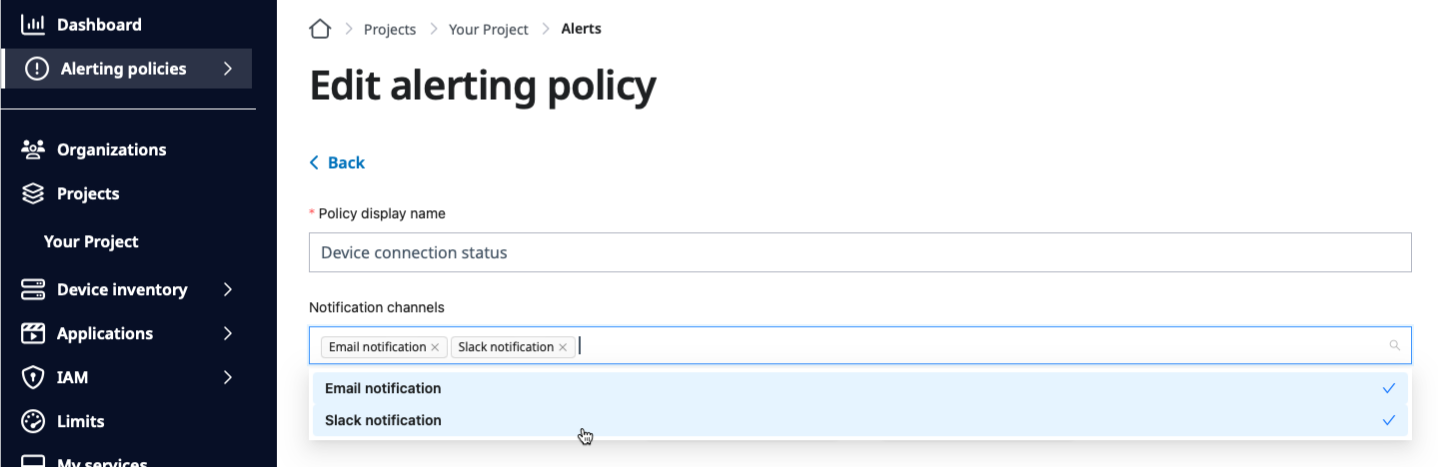
And also, let’s link the notification channels to the alerting policy so that we
get notified whenever alerting status changes. Select the Edit details option
of the alerting policy menu and provide the notification channels in the Notification
channels field.
Great!
You’ve configured the alerting policy to detect the device offline status
on SPEKTRA Edge.
Let’s simulating the offline connection status and observe what kind of
information you can get from the SPEKTRA Edge alerting system.
Monitor alerts
Let’s pull the cable from one of your devices and see how the alert looks like.
After waiting for five minutes, you should be able to see the alert raised on the
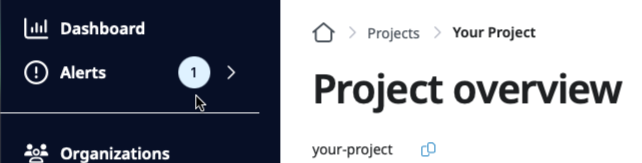
sidebar of the dashboard page.
The circle alert number right next to the Alerts section of the sidebar.
Why five minutes?
The SPEKTRA Edge alerting system triggers alerts when the condition is true
for the specified duration of time. Since we configured the alerting condition
with five minutes duration time, you need to wait for roughly five minutes after
pulling the cable.
Set the shorter duration time and you will see the alert happens much quicker.
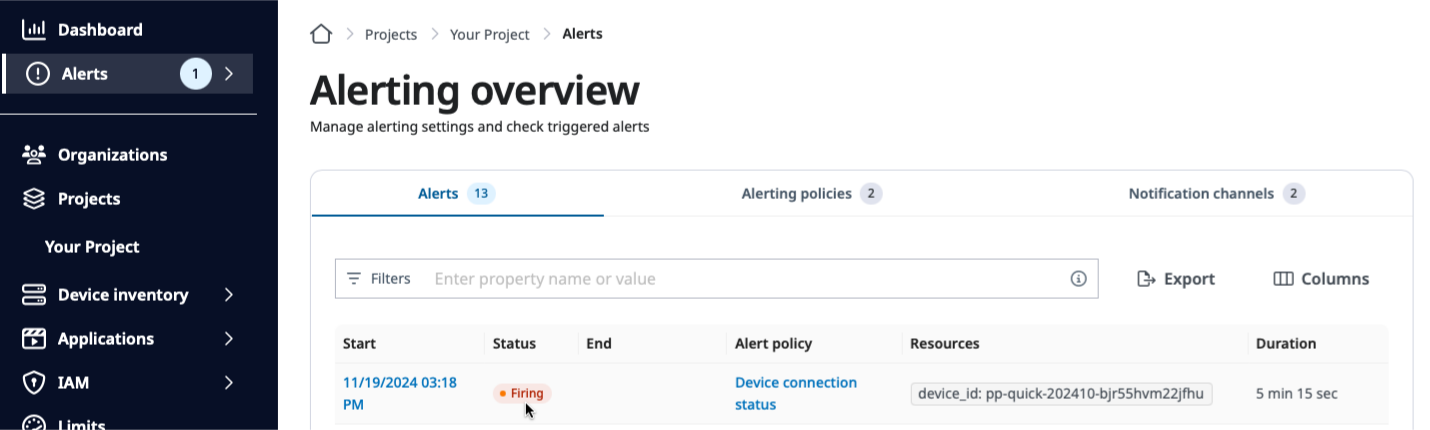
Go to the Alerts page by selecting the Alerts option of the Alerts pull-down
menu. You will see the Fireing alert of the Device connection status
alerting policy with the on-going alert duration and the device information.
The Fireing alert on the Alerting overview page.
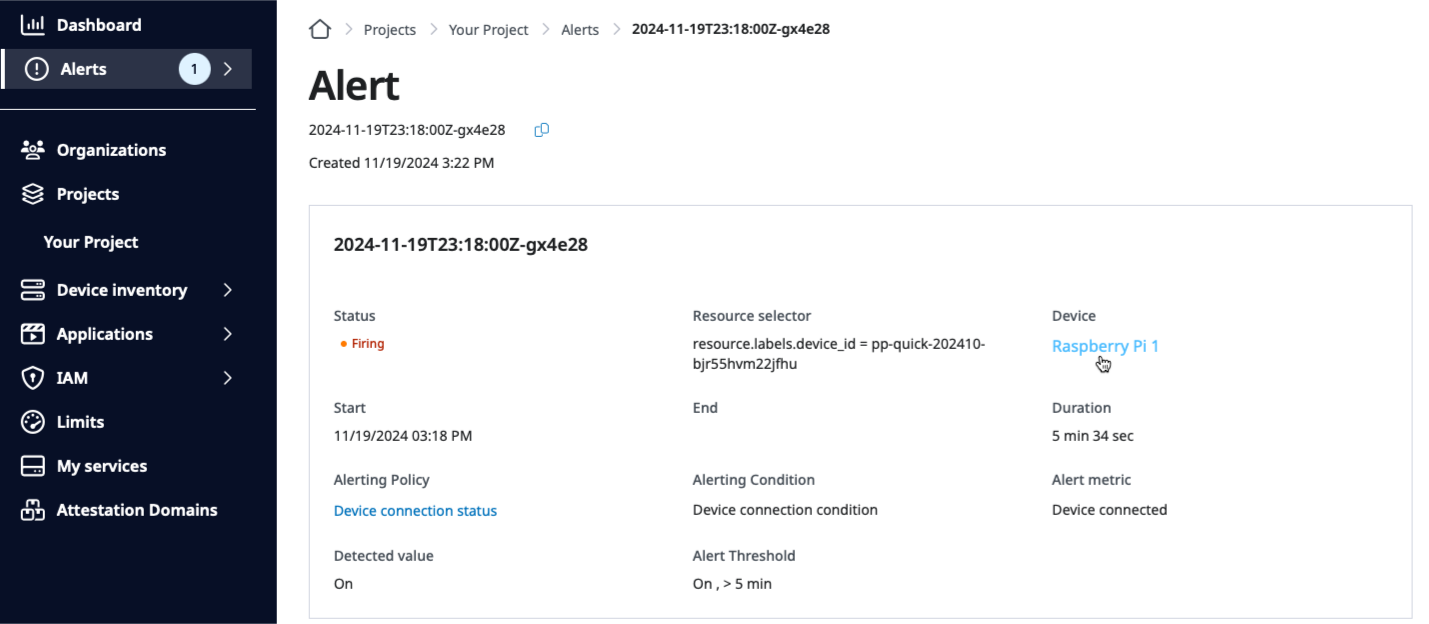
Click the start time of the firing alert and get the detailed information of the
alert. You can observe much more information of the alert firing including the
link to the Device overview page of the device without the connection.
Deivce information of the alert firing on.
Example: CPU utilization alerting condition
Before wrapping up, let’s take a look at another example to understand
how to configure alerting condition on SPEKTRA Edge.
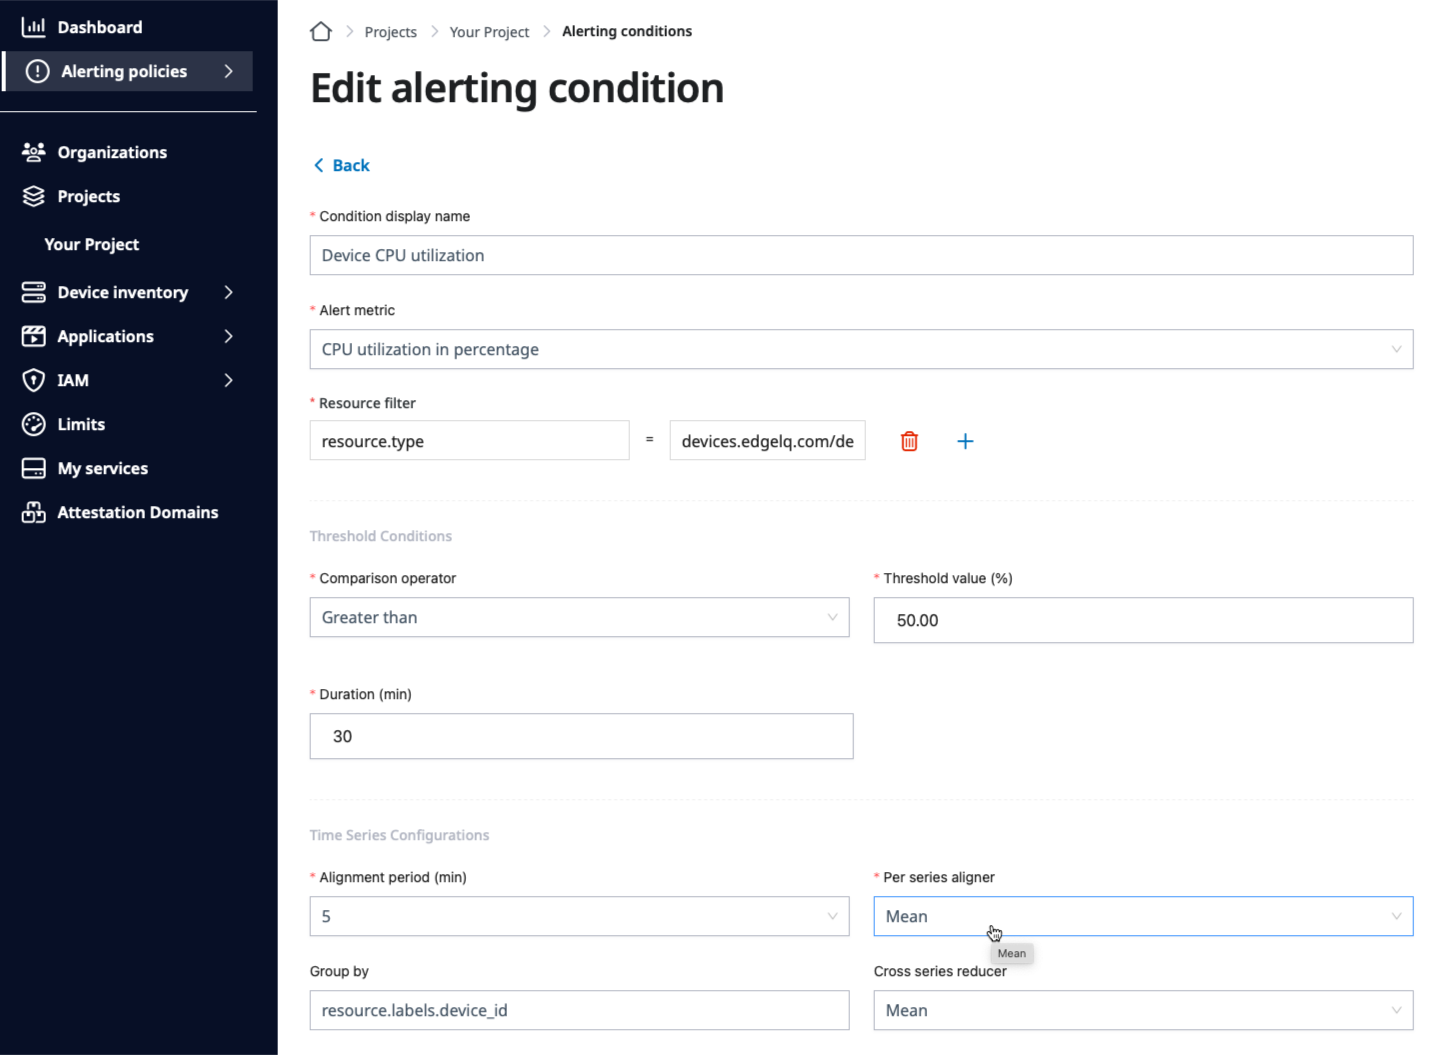
Here is the CPU utilization alerting condition, which triggers alert whenever
the average CPU utilization is more than 50% for half an hour.
The CPU Utilization alerting condition example for your reference.
Here is some of the highlight:
Threshold condition
Greater than is used as the comparison operator
50% as the threshold value
30 minutes as the duration time
Time series configuration
five minutesalignment period with Meanper-series aligner
Group bydevice_id with Meancross-series reducer
Here is the summary of the time series configuration parameters.
using the Meanper-series aligner to get the average of the CPU utilization
of the five munites time period
using the Meancross-series reducer to get the average of the multiple
CPU time series to be treated as the devices CPU utilization data point
With those two aggregations, the system compares the aggregated data point to compare
to the threshold condition, more than 50%, and raises an alert when it’s true for
more than the duration time, 30 minutes.
Next step
Congratulations for creating and monitoring alerts on SPEKTRA Edge. It’s a little
long explanation but we hope you understand the insight of the SPEKTRA Edge alerting
system as well as be ready to create your own alerting policies and conditions.
Let’s learn which metrics you can alert on with SPEKTRA Edge, and how to use
them to keep an eye on remote devices without checking them by hand.
The Manage alerts page shows you how to build an alerting policy,
using the Device connected metric as the example. This page focuses on the
opposite question: which metric should you pick, and what each one is good
for. Use it as a catalog when you create your own alerting conditions.
Where these metrics appear
When you create an alerting condition (Alerts → Alerting policies →
[your policy] → Create condition), the Alert metric field lists the
metrics available for the selected resource type (Device or Pod). The
metrics below are the ones you will find there.
Why alert on more than “Device connected”
A device can stay connected and still be in trouble: a disk fills up, the
CPU is pinned at 100%, a sensor overheats, an application stops responding, or a
cellular link degrades to the point of dropping data. Connection status alone
won’t tell you any of that.
By alerting on resource and health metrics, you get notified of these
conditions before they turn into an outage, so you can act on a device that
may be in a remote, hard-to-reach location.
Device metrics
These metrics describe the health of the device itself (resource type
devices.edgelq.com/device).
Availability
Metric
What it tells you
Typical condition
Device connected
Whether the device is online (1) or offline (0).
Less than 1 for 5 minutes.
Uptime
How long the device has been running since its last boot.
A sudden drop signals an unexpected reboot.
A low Uptime value (for example, uptime resetting to near zero) is a good
way to catch devices that are rebooting unexpectedly, even when they reconnect
quickly enough that the connection alert never fires.
Compute
Metric
What it tells you
Typical condition
CPU utilization
Percentage of CPU in use.
Greater than 80% for 30 minutes.
CPU load (1m)
1-minute load average.
Greater than the device’s core count for a sustained period.
Sustained high CPU is the classic sign of a runaway process or an application
consuming more than expected. Use a duration (for example, 30 minutes) so that
short, legitimate spikes don’t trigger noise.
Memory
Metric
What it tells you
Typical condition
Memory utilization
Percentage of RAM in use.
Greater than 90% for 15 minutes.
Memory used
Bytes of RAM in use.
Useful when you care about absolute headroom.
High memory utilization warns you before the device starts killing processes
under memory pressure.
Storage
Metric
What it tells you
Typical condition
Disk utilization
Percentage of disk space in use, per mount point.
Greater than 85%.
Disk used
Bytes of disk space in use.
Useful for absolute thresholds.
A full disk is one of the most common causes of failed application deployments
and stalled log forwarding. Alert early (for example, at 85%) to leave time to
clean up. The disk metrics are reported per mount point, so you can tell
whether it’s the system area, the data area, or an additional partition that is
filling up.
Hardware sensors
Metric
What it tells you
Typical condition
Hardware temperature
Temperature readings in °C, per chip/sensor.
Greater than a safe limit for the hardware.
Fan speed
Cooling fan RPM readings.
A drop toward zero can indicate a failing fan.
Voltage
Voltage rail readings.
Out-of-range values indicate power problems.
Power
Power consumption readings.
Unusual draw can indicate a hardware fault.
Thermal alerts are especially valuable for fanless or enclosed devices deployed
in environments where ambient temperature isn’t controlled.
Network interfaces
Metric
What it tells you
Typical condition
Bytes received / sent
Throughput per interface.
A drop to zero can mean a link is down; a spike can mean unexpected traffic.
Packets received / sent
Packet rate per interface.
Same as above, at packet granularity.
Incoming / outgoing drops
Dropped or errored packets per interface.
Greater than 0 over an interval signals a degraded link.
These are grouped per interface, so you can monitor a specific uplink (for
example, the wired interface) independently from others.
Cellular signal
For devices with a cellular modem, these metrics help you catch a connection
that is slowly degrading before it fails.
Metric
What it tells you
Typical condition
Modem RSSI
Received signal strength.
Less than a weak-signal threshold.
Modem RSRP
Reference signal received power.
Less than a weak-signal threshold.
Modem RSRQ
Reference signal received quality.
Less than a weak-signal threshold.
Modem SNR
Signal-to-noise ratio.
Less than a poor-quality threshold.
A device on a weakening cellular link may still report connected, but
alerting on signal quality lets you schedule maintenance (for example,
repositioning an antenna) before it goes offline.
Health checks
If you configure host-level health checks on a device, their results are also
available as metrics.
Metric
What it tells you
Typical condition
Health check status
Result of each configured check (1 healthy, 0 unhealthy).
Less than 1.
Health check HTTP response time
Response time of HTTP checks.
Greater than an acceptable latency.
Health check network RTT
Round-trip time of ICMP/network checks.
Greater than an acceptable latency.
Health checks let you turn “is this specific service or endpoint reachable from
the device” into an alert.
Application metrics
These metrics describe the applications (pods) running on your devices
(resource type applications.edgelq.com/pod). Select Pod as the
resource type when creating the alerting condition.
Metric
What it tells you
Typical condition
Pod CPU utilization
CPU used by the application.
Greater than an expected ceiling.
Pod memory utilization
Memory used by the application.
Greater than an expected ceiling.
Pod memory used
Absolute memory used by the application.
Useful for absolute thresholds.
Pod health
Whether the application is healthy (1) or not (0).
Less than 1.
Pod health check status
Result of the application’s health checks.
Less than 1.
Pod health check HTTP response time
Response time of the application’s HTTP checks.
Greater than an acceptable latency.
Pod health check network RTT
Round-trip time of the application’s network checks.
Greater than an acceptable latency.
These let you alert on the workload itself — for example, an application that is
unhealthy or consuming far more CPU than usual — rather than only on the device
hosting it.
A recommended starting set
If you’re not sure where to begin, these conditions cover the most common
problems for a fleet of remote devices:
Condition
Metric
Suggested trigger
Device offline
Device connected
Less than 1 for 5 minutes
Disk filling up
Disk utilization
Greater than 85%
Memory pressure
Memory utilization
Greater than 90% for 15 minutes
CPU saturation
CPU utilization
Greater than 80% for 30 minutes
Overheating
Hardware temperature
Greater than the hardware’s safe limit
Application down
Pod health
Less than 1
Tips for fleet-wide alerts
Group by device. In the time series configuration, group by
resource.labels.device_id so each device is evaluated independently and a
single policy covers your whole fleet. See the
time series configuration section on the alerts page for details
on aligners and reducers.
Use a duration. Requiring a condition to hold for a few minutes filters
out transient spikes and keeps notifications meaningful.
Attach notification channels. Connect Slack, email, or a webhook so
alerts reach you wherever you work. See notification channels.
Let the platform tune thresholds for you. If picking exact thresholds is
hard, consider AI Alerting, which adds anomaly detection and
adaptive thresholds on top of these same metrics.
Next step
Now that you know what to monitor, learn how the platform can investigate and
even remediate alerts for you with AI Alerting.
4.6 -
AI Alerting
Let’s learn how to use AI Alerting on SPEKTRA Edge to detect problems
without hand-tuned thresholds, and to have an AI agent investigate and remediate
alerts for you.
Managing remote devices means you can’t watch every dashboard all the time.
AI Alerting is designed for exactly this: it notices unusual behavior on its
own, figures out what is likely wrong, and either fixes it or escalates to a
human with a written explanation.
This page has two parts:
Concepts — what AI
Alerting is, its architecture, and how a fired alert is handled end to end.
Read this first to build a mental model.
Setup — a hands-on walkthrough
that builds one policy, field by field. Our example detects abnormal CPU
behavior on devices and lets the AI agent restart the offending pod after
your approval.
Concepts: what AI Alerting is and how it works
This part explains the moving pieces and how they fit together. No
configuration yet — that’s Setup.
AI Alerting vs. Alerts
SPEKTRA Edge has two complementary alerting areas in the dashboard sidebar:
Area
Best for
Alerts
Classic threshold alerts. You pick a metric and a fixed threshold (for example, CPU > 80%). See Manage alerts and Alert metrics.
AI Alerting
Anomaly and adaptive-threshold detection, plus an optional AI agent that investigates and remediates fired alerts.
This page covers AI Alerting. You’ll find it under the AI Alerting
entry in the sidebar (the AI Alerting overview page).
Architecture and end-to-end flow
AI Alerting reuses the same building blocks as classic Alerts — an
alerting policy that groups conditions and notification channels —
and adds two things on top:
Smarter conditions. In addition to fixed thresholds, a condition can use
adaptive thresholds or anomaly detection. These are two different
things — see Adaptive thresholds vs. anomaly detection below.
An AI agent that handles fired alerts. When an alert fires, the agent
investigates, decides what is going on, and takes an action — see
How the AI agent handles alerts below.
Putting those together, this is the end-to-end flow. However the alert is
triggered — a fixed threshold, an adaptive threshold, or an anomaly detector —
it enters the same AI handling pipeline: the agent gathers context (including
your supporting docs and queries), decides what is going on, and then the outcome
flows into whatever you configured — a notification, an automatic or approved
remediation, or an escalation to a human.
flowchart TD
    %% --- Detection ---
    FT["Fixed threshold"]
    AT["Adaptive threshold"]
    AD["Anomaly detection"]
    FT --> FIRE
    AT --> FIRE
    AD --> FIRE
    FIRE(["Alert fires<br/>(after 'Raise after')"])

    %% --- Investigation ---
    FIRE --> INV["AI agent investigates"]
    LIVE["Metrics, logs,<br/>resource state"] --> INV
    DOCS["Supporting docs"] --> INV
    SQ["Supporting queries"] --> INV
    SSH["Read-only checks over SSH<br/>(if connectivity enabled)"] --> INV

    %% --- Decision ---
    INV --> DEC{"AI agent decides"}
    DEC -->|"transient blip"| IGN["Ignore"]
    DEC -->|"over-sensitive"| ADJ["Adjust condition"]
    DEC -->|"fixable"| REM["Remediation:<br/>Fix in SSH or Reboot"]
    DEC -->|"cannot resolve"| ESC["Escalate to operator"]

    %% --- Remediation approval gate ---
    REM --> AA{"Auto-accept<br/>enabled?"}
    AA -->|"no"| WAIT["Await operator approval"]
    AA -->|"yes"| APP["Apply automatically"]
    WAIT -->|"approved"| APP
    APP --> RECHECK{"Still firing?"}
    RECHECK -->|"yes"| ESC

    %% --- Outcomes notify channels ---
    IGN --> NOT
    ADJ --> NOT
    APP --> NOT
    ESC --> NOT
    NOT[["Notify channels:<br/>Slack / email / webhook"]]
Adaptive thresholds vs. anomaly detection
Both go beyond a fixed threshold, but they answer different questions.
Adaptive thresholds are still thresholds — an upper and/or lower bound.
The only difference from a fixed threshold is that the platform computes the
bound for you from recent history (by default, the last week) instead of you
typing a fixed number. It looks at the range the metric actually reached, adds
some buffer, and alerts when the value crosses that band. The question it
answers is “is the value too high or too low right now?” — it just keeps the
“too high / too low” line up to date as the device’s normal level drifts.
Anomaly detection is a learned model of behavior, not a bound. A small
AI model (an LSTM autoencoder) is trained on the metric’s history and learns its
normal shape over time — including how it rises and falls through the day. It
then flags readings that don’t match that learned pattern. The question it
answers is “does this look like how this device normally behaves?” — so it can
catch a value that is unusual even though it never leaves the normal band
(for example, CPU sitting flat at 40% overnight when it normally idles near 5%).
Adaptive threshold
Anomaly detection
What it is
An auto-maintained upper/lower bound
An AI model of normal behavior over time
Detects
Value crossing a band
Deviation from the learned pattern (shape, timing)
How the “normal” is set
Historic min/max range + buffer
Model trained over a training period
Catches in-range oddities?
No — only out-of-band values
Yes — unusual patterns even within the band
Setup input
Auto-adapt upper/lower (+ optional guard rails)
Analysis window + training period
Cost / lead time
Cheap, available quickly
Needs a training period (at least a day) before it detects
They also complement each other: while an anomaly detector is still training
(or if it isn’t defined), the adaptive thresholds keep watch, so you have
coverage from day one and sharper detection once the model is ready. A common
setup is to enable adaptive thresholds and one or more anomaly detectors on the
same condition.
How the AI agent handles alerts
When an alert fires — from any of the detection methods above — the AI agent runs
a short loop: investigate → decide → act.
What the agent looks at
To diagnose an alert, the agent pulls together several sources of context:
Live signals — the device’s metrics, logs, and resource state around the
time of the alert.
Supporting queries — predefined metric, log, or resource lookups attached
to the policy. They run automatically when an alert fires and their results
are handed to the agent, so it always starts with the data you consider
relevant (see Add supporting queries).
Supporting documents — natural-language references the agent reads while
diagnosing (see the next section).
Read-only device checks — only if you enabled agent connectivity, the
agent may run safe, read-only commands on the device over the secure SSH
tunnel.
How supporting documents are used
Supporting documents are natural-language references — runbooks, operational
notes, known-issue write-ups — that you attach to a policy or condition. The
agent reads them as context while diagnosing an alert; they are not code and
they don’t run. They shape the agent’s understanding and its decision.
For example, a short runbook that says:
If the processor service spikes CPU right after a config push, it’s a known
issue — restarting the pod is safe and resolves it.
lets the agent recognize the situation, explain it in its diagnosis, and
confidently choose the Reboot remediation instead of escalating. Without
that note, the same symptom might be escalated to a human because the agent has
no way to know the restart is safe.
Good supporting documents are specific and action-oriented: they describe a
symptom, what it usually means, and what a safe response is. They’re the main
way you transfer your team’s operational knowledge to the agent. You attach them
during setup (see Attach supporting documents).
What the agent decides and does
After investigating, the agent chooses one outcome:
Ignore — the cause looks transient and harmless.
Adjust — the condition was too sensitive; the platform retunes it.
Remediate — apply a Fix in SSH command or Reboot the affected
pod. If auto-accept is off, the agent only proposes the fix and waits
for an operator to approve it; if it’s on, the fix is applied automatically.
If a remediation is applied and the alert keeps firing, the agent escalates.
Escalate — it can’t resolve the issue and hands off to a human.
Every step is recorded as an AI diagnosis note on the alert, so you can read
how the agent reached its conclusion.
Guardrails: keeping the agent safe
A few guardrails are built in and worth knowing:
The agent only connects to a device when you enable agent connectivity;
otherwise it works from collected metrics and logs alone.
You can restrict which command-line tools the agent may use during
investigation, limiting it to a known-safe set.
Remediations are limited to the kinds you allow (Fix in SSH and/or
Reboot), and — unless you enable auto-accept — require your approval before
anything runs.
Setup: create and configure a policy
Now the hands-on part. We’ll build the CPU example from the top of the page:
detect abnormal device CPU, and let the agent restart the offending pod after
your approval.
Go to AI Alerting → Policies in the sidebar to open the AI Alerting
overview page, then click Create policy in the top-right corner.
The Create policy page is a single form. We’ll walk through it top to bottom.
1. Choose a template and name the policy
Template — start from a predefined set of conditions (for example, a base
device or pod template). Templates come with sensible conditions already
filled in, which you can tune later. For our example, pick a device template.
Note that the template cannot be changed after the policy is created.
Display name — a human-readable name, for example Device CPU anomaly.
Description — optional free text describing what the policy is for.
2. Attach supporting documents and notification channels
Supporting docs — attach the runbooks or notes the agent should read while
diagnosing an alert (this is the feature described in
How supporting documents are used). It’s
optional but makes the agent noticeably better.
Notification channels — select the same Slack, email, or webhook
notification channels you use elsewhere. You can leave this empty
and add channels later.
3. Enable the AI agent and pick remediations
This is the heart of AI Alerting. Turn on AI agent enabled to switch on
AI-powered analysis and remediation for alerts raised by this policy. Two more
controls appear once it is on:
Setting
What it does
AI agent enabled
Turns on AI-powered analysis and remediation for alerts raised by this policy.
Enable agent connectivity
Lets the agent connect to the device (over the platform’s secure SSH tunnel) to investigate beyond the collected metrics and logs.
Enable auto accept AI agent remediation
Applies the agent’s proposed fix automatically, without waiting for a person to approve it (fully autonomous mode).
Remediations
The kinds of fixes the agent may perform: Fix in SSH (run a remediation command on the device — requires agent connectivity) and/or Reboot (restart the affected pod — requires the policy to identify a pod).
For our example, enable the AI agent, enable connectivity, leave auto-accept
off, and select both Fix in SSH and Reboot as allowed remediations.
Start with a human in the loop
Leave auto accept off at first. The agent will then propose a remediation
and wait for your approval, so you can review what it intends to do before
anything changes on the device. Turn on auto-accept only once you trust the
policy’s behavior.
4. Set the processing location and resource
Remediations and Processing location sit side by side on the form.
For Processing location, choose Backend (in the cloud) or Edge (on
the device itself). Edge processing keeps detection working locally even when
connectivity to the cloud is intermittent; Backend is the right choice for
metrics that only make sense centrally (such as connectivity). This field
cannot be changed after creation. For our anomaly-detection example, keep it
on Backend — on-device anomaly detection is coming soon, but today anomaly
models run in the backend (adaptive and fixed thresholds work in either
location).
Resource — the resource type this policy monitors, for example Device
or Pod. The Reboot remediation is only available when the policy can
identify a pod.
5. (Optional) Add supporting queries
Supporting queries are the predefined lookups described in
What the agent looks at. They are gathered
automatically and handed to the agent as context whenever an alert fires. Click
Add query and choose a Type:
Time series query — a metric lookup with a filter and aggregation
(alignment period, per-series aligner, cross-series reducer, group-by fields).
Log query — a log lookup with a filter.
REST get / REST list query — fetch a resource (or a list of resources)
from a SPEKTRA Edge service, using an endpoint, path, view, and field mask.
Filters use templates, so you can reference the alert’s labels with
<label_key> placeholders (for example resource.labels.device_id="<device_id>").
The built-in <project_id> and <region_id> placeholders are always available.
When the form is complete, click Create to save the policy.
Add conditions
A policy without conditions never fires. Open your new policy from the
AI Alerting overview page and add a time series condition (the template you
picked may have already added some, which you can edit or delete).
Each condition defines one or more queries (metric filter + aligner +
reducer) and how they turn into alerts. You can use fixed thresholds, adaptive
thresholds, and anomaly detection — together if you like. For the difference,
see Adaptive thresholds vs. anomaly detection.
Threshold and adaptive thresholds
Set a Threshold to alert when a value crosses a fixed bound. To make that
bound adapt to the device’s own history instead of being a fixed number, turn
on:
Auto adapt upper — the platform maintains the upper bound for you.
Auto adapt lower — the platform maintains the lower bound for you.
With adaptive thresholds you can still set hard guard rails (a maximum upper and
a minimum lower bound) so the adaptive value never becomes too tolerant or too
sensitive. The platform derives the adaptive bound from historic data (by
default the last week) plus a configurable buffer.
Anomaly alerting
Add an entry to the Anomaly alerting list to catch deviations from the
metric’s learned pattern. This trains a small AI model on the metric’s history,
so it needs a training period before it starts detecting. The key fields are:
Analysis window — the sliding window of data the model looks at each time.
Training period — how much history the model learns from before it starts
flagging deviations (at least one day).
A good starting pattern is one wide, coarse detector (a long analysis window
with a larger step) to catch slow drifts, plus one narrow, fine detector to
catch sudden spikes.
Anomaly detection runs in the backend for now
On-device (Edge) anomaly detection is coming soon. Today, anomaly detection
runs in the backend, so keep the policy’s Processing location on
Backend when you use anomaly alerting. Adaptive and fixed thresholds work
regardless.
Raise after / silence after
For both methods you can set:
Raise after (sec) — how long the condition must hold before an alert fires
(noise reduction).
Silence after (sec) — how long after violations stop before the alert
clears.
Save the condition when you’re done.
Enable the policy
Back on the AI Alerting overview page, slide the Enabled switch on for your
policy. Detection (and, once alerts fire, the AI agent) is now live.
Reading alert state
On the AI Alerting overview page, the alerts tables show the handling state:
Open an alert to see the full AI diagnosis, the proposed remediation, and
the controls to Approve a remediation or Acknowledge the alert.
Choosing which events notify you
For AI Alerting you can pick exactly which lifecycle events send a notification
on each channel, including:
New firing — a new alert started.
AI escalated to operator — the agent needs a human.
AI remediation awaiting approval — a fix is proposed and waiting for you.
AI remediation applied / Operator remediation applied — a fix was
applied by the agent or by a person.
Stopped firing — the alert cleared.
Next step
Combine AI Alerting with well-chosen alert metrics for broad
coverage, and route everything through your notification channels so
you hear about remote devices the moment something looks wrong.
5 -
Manage user accounts
Let’s learn how to manage users on SPEKTRA Edge.
SPEKTRA Edge offers the Identify and Access Management (IAM) framework
for the user management, which is based on the Role-Based Access Control (RBAC)
mechanism. In other words, you apply the certain role or roles to the users or
groups, which is called the role binding, to give the certain permissions to
the particular individual or group of individuals.
It also has a concept of scope of role binding, which is that the permissions
for the particular role only applicable in the certain scope. This means that the
role binding happened at the project is only effective under that project, or
sub-projects if those available, but not others, like parent projects.
This means that you can create a really powerful and effecive user management
mechanism with the well-organized projects or organization structure.
User authentication
The role-binding process is one side of the whole user management process on
SPEKTRA Edge. The other side is the user authentication.
There is no order dependency between the two but it just needs to happen to let
users have access to SPEKTRA Edge.
What you need
To grant access to users and groups, you need the followings.
First, let’s learn how to grant access to users on SPEKTRA Edge.
Click the Grant access button in the Manage resources and access of
this project blue bar on the Project overview page, which will ask you
following things:
the E-mail address of the person you want to give access to the project
Selecting the role for the user in the Grant access to project dialog on the Project overview page.
Now, let’s learn what those user roles mean and what kind of operations can
be granted for each role next.
Roles
Here is the pre-existing user roles offered by SPEKTRA Edge.
Role name
Resource name
Permissions
Owner
scope-admin
All operations on core and third party services
Admin operator
admin-operator
All operations on core services
Device operator
devices-operator
All operations on device and applications services
Application operator
apps-operator
All operations on applications services
Viewer
viewer
Read-only operations on core services
The owner role has full access to the services offered by SPEKTRA Edge
under particular scope.
The admin operator role is similar to the owner role but does not have
an access to the third-party services, for example the watchdog service offered
by Service Experience Insight. This is a good role for someone who
manages the entire service, e.g., user management.
The devices and application operator roles are both for the application
management. The devices operator role is good for someone who manages both
devices and applications but the application operator is for the application
management only.
The viewer role doesn’t have any write access but have read access to
core services. This is a good role for someone who only monitors or observes
core services.
Organize users by groups
You can create a group to manage multiple users in one-shot.
One good example of the group usage is to grant access to multiple users
in a single operation, as explained in the following section.
To create a group, click the Create group button on the Project overview
page and fill in the required information, such as the name and the region, as
well as the E-mail addresses of the members managed in the group.
Creating Your team group under Your project.
Grant access to groups
You can grant access to the group, which is a great way to grant access to
multipe users in the efficient fashion.
To do that, use the group E-mail address to grant access instead of the
individual person’s E-mail. The group E-mail address is constructed by
SPEKTRA Edge with the following convention.
[Group name]@[Project name].groups.iam.edgelq.com
You can also get the group E-mail address on the groups overview page
under your project.
The group E-mail address on the groups overview page.
Grant access by clicking the Grant access button on the
Project overview page. Give the group E-mail address,
your-team@your-project.groups.iam.edgelq.com for this example, and the role
you want to grant access to the group.
Granting access to the group with the group’s E-mail address.
You can check the roles for the group members by going to the Access page under
the IAM section. You can see all the group members have the same role of
the group’s role.
All the group members have the same role of the group’s one.
Group role binding
It takes a while, a minute or two, before the role binding completes on
the group members because it is done by the SPEKTRA Edge controllers behind-
the-sceans in the eventual consistency fashion.
Next step
Congratulations on understanding how to manage users on SPEKTRA Edge.
With the power of the scope based role binding, you can conduct the
user management with achieving the high security standard.
The role binding is one side of the user management coin. The other
side of the user management is the user sign-up and sign-in.
Let’s dive in the user authentication to understand the
full picture of the user management on SPEKTRA Edge.
5.1 -
User authentication
Let’s learn how to sign-up and sign-in on SPEKTRA Edge.
The previous topic, the user and group management, discussed how to
manage users with groups and role bindings. In fact, that’s one side of the
coin of the user management. The other side, the user sign-up and sign-in,
is the topic in this page.
SPEKTRA Edge user authentication is the multi-factor authentication
(MFA) with Google Sign-in support. Let’s learn how it
works step-by-step both for the Google accounts and for the E-mail/password
based authentication.
What you need
For the user authentication on SPEKTRA Edge, you need the following.
Let’s learn the sign-up process on SPEKTRA Edge first.
Select Google accounts or Email and password tab below to learn the process
for each case.
Select the Sign Up tab and click Sign up with Google option.
Clicking Sign up with Google to sign-up with Google accounts.
You will be asked to select the MFA app. Select your preferred MFA app and
move on to the MFA setup step next.
Selecting the Google Authenticator to move on to multi-factor authentication setup step.
Scan the QR code by the MFA app on your phone and fill in the six-digit pass code
generated by the app.
Scan the QR code with the MFA app and fill in the six-digit pass code generated by the app.
That’s it. You’ve successfully sign-up on SPEKTRA Edge and will be re-directed to
the SPEKTRA Edge dashboard.
Select the Sign Up tab and click SIGN UP after filling in the E-mail,
password, and the full name.
Clicking SIGN UP after filling in the E-mail, password, and the full name.
You will be asked to select the MFA app. Select your preferred app and move on
to the MFA setup step next.
Selecting the Google Authenticator to move on to multi-factor authentication setup step.
Scan the QR code by the MFA app on your phone and fill in the six-digit pass code
generated by the app.
Scan the QR code with the MFA app and fill in the six-digit pass code generated by the app.
You’ve successfully setup the MFA setup for your account. The last thing is to
verify your E-mail address. Click continue and move on to the E-mail verification
step.
Click Continue to move on to the E-mail verification step.
Open your E-mail application and search for the verification E-mail sent by SPEKTRA
Edge in your inbox. Click the Verify email address box in the verification
E-mail to complete the sign-up process.
Clicking the Verify email address to complete the sign-up process.
You will be directed to the SPEKTRA Edge dashboard and successfully complete
the SPEKTRA Edge sign-up process.
Sign-in
Select the account type below to go through the sign-in process on SPEKTRA Edge.
Click the Sign In with Google button to sign-in to SPEKTRA Edge.
Clicking Sign in with Google to sign-in with Google.
You will be asked to fill in the MFA pass code. Open your MFA app and paste
the code generated by the app, then click the right arrow
button to complete the sign-in process.
Fill in the MFA code to complete the sign-in process.
You will be re-directed to the SPEKTRA Edge dashboard.
Fill in your E-mail address and the password you gave during the sign-up process
and click LOG IN button to proceed.
Sign-in with your E-mail address and password.
You will be asked to fill in the MFA pass code. Open your MFA app and paste
the code generated by the app, then click the right arrow button to complete
the sign-in process.
Fill in the MFA code to complete the sign-in process.
You will be re-directed to the SPEKTRA Edge dashboard.
Remember this browser option
You can check the Remember this browser option when you sign-in to the
SPEKTRA Edge to by-pass the MFA process for the next time on this browser.
Please refrain from this option on public browsers, e.g. browsers offered
at hotels, which will be shared by multiple people and leads to the security
breach.
Next steps
Congratulations to successfully complete the user authentication process on
SPEKTRA Edge.
Let’s go to the resource limits page to learn how to manage
resources on SPEKTRA Edge, next.
Onwards.
5.2 -
Manage resource limits
Let’s learn how to manage resource limits on the SPEKTRA Edge platform.
First step to manage the resource limits is to request the limit change.
Let’s go to the Limits overview page by clicking the Limits option from
the side bar menu.
Clicking the Limits icon on the dashboard side bar menu.
Click the Change limits button to open the Request resource limit change
dialog.
Clicking the Change limits button on the Limits overview page.
Let’s request the Pod resource increase from 25 pods to 50.
Request the Pod resource increase.
That’s it for the resource limit request.
What is the maximum resource limit you can request?
The resource limit applies not only to the current project but also any child projects exists
underneath. For example, if the current project’s pod resource limit is 25 pods, the total
number of pods for the current project and those under the child projects is limited to 25 pods.
Approve resource limit changes
After the resource limit requests, the remaining task is to approve the request to make
it effective.
Click the Change limits requests tab to show the list of change limit requests.
Click the Change limits requests tab to show the list of change limit requests.
Approve the request by selecting the Approve option of the Actions column.
Approving the pod resource limit request by selecting the Approve option of the Actions menu.
That’s it!
6 -
6.1 - Installing the cuttle CLI
How to download and install the cuttle CLI.
You can install the cuttle CLI by following the instruction below for your
particular operating system:
In Windows environments, a security warning may appear when downloading the
cuttle command executable.
If you receive the following warning in Microsoft Edge, follow the screenshot
to save the file.
Example of the security alert message.
Mouse cursor over the message to see ….
Click on … and select Keep.
An additional warning message appears, click Show More.
Keep anyway will appear, click to save the file.
the cuttle command is invoked using Command Prompt
or PowerShell. For the command prompt, type “cmd” in the Start menu
to display the application.
Type cmd in the Start menu search window.
Download the cuttle CLI either for Intel or ARM
architecture.
Change the downloaded file’s permission to be executable:
chmod a+x cuttle
Place the file to be reachable, as under /usr/local/bin:
sudo mv cuttle /usr/local/bin
Next steps
Once you install the cuttle command, please authenticate your account
or optionally configure your cuttle context.
6.2 - Authenticating with the cuttle CLI
How to authenticate with the cuttle CLI.
To authenticate using the cuttle command, execute the following command:
$ cuttle auth login
Please log in in the newly opened browser tab and confirm verification code:  PFDT-BHFD
Waiting for successful authentication...
Confirm button of the Device Confirmation pane.
confirm the verification code above matches the one on the browser and
finish the oAuth step with your Authenticator app on your phone.
Successful authentication of your account.
After successful authentication, cuttle will store refresh tokens in local
config. It will use them to obtain fresh auth tokens when accessing EdgeLQ.
However, when refresh tokens eventually expire, you will get errors like these:
request failed: rpc error: code = Unauthenticated desc = transport: per-RPC creds failed due to error: oauth2: "invalid_grant" "Unknown or invalid refresh token."
In that case, you will need to use the cuttle auth login command
again.
If you have multiple accounts, it is advisable to specify which account you
refresh with:
cuttle auth login --account-name <AccountName>`
This account name may usually have email format xyz@mail.com, but
verify with cuttle config account list.
To verify current account you are using, you can list current contexts
and see which one is ACTIVE - it will show associated account name:
cuttle config context list.
6.3 - Configuring the cuttle CLI
How to configure the cuttle CLI.
SPEKTRA Edge Context
The cuttle command can switch between multiple settings (called contexts);
one context is associated with an Environment and an Account.
To retrieve contexts, use cuttle config context list. This command
displays all contexts contained in the configuration file. Contexts that
are currently enabled are marked with ACTIVE.
Use the cuttle config context set command to add or change contexts.
This command creates a new context if the specified context does not exist,
or updates the existing value if it already exists.
The following is an example of a command that sets the environment and
account respectively in a context named $CONTEXT_NAME.
Use the current context instead of specifying a context name. In the above example, ߋ$CONTEXT_NAME is no longer needed.
--environment
Specify the name of the environment to use in the relevant context.
--active-environment
Set the environment enabled for the current context to the relevant context.
--account
Specifies the name of the account to use in the relevant context.
--active-acount
Set the account enabled in the current context to the relevant context.
--default-values
Specifies the values to use by default in the relevant context (see below).
--default-value-set
Specify values to be used by default in the relevant context (see below).
To see list of environments or accounts, you can use:
$ cuttle config environment list
$ cuttle config account list
Context Default Values
Use --default-values or --default-value-set to set default values
for projects and regions used in context. This way you can avoid specifying
--project or --region params when accessing EdgeLQ API.
The following is an example of how to set up a project with $PROJECT and
a region with $REGION.
cuttle config context set --active --default-value-set project=$PROJECT,region=$REGION
To set individual values, specify --default-values.
cuttle config context set --active --default-values project=$PROJECT
If you want to remove the default value, give only the key.
cuttle config context set --active --default-values project
SPEKTRA Edge Environments
The environment (Environment) does not need to be edited by the user if
only the commercial environment is used. The settings for the commercial
environment are automatically set by default.
If you need an access to staging environment, you can add it with the
following command:
## Add environmentcuttle config environment set stg01b \
--auth-domain auth-dev.edgelq.com \
--domain stg01b.edgelq.com \
--auth-client-id zQvQ3Js18JLKwySX3haxGLhQ4QgRle4Z
## Add context using new environment. Use current account.cuttle config context set stg01b --environment stg01b --active-account
## activate contextcuttle config context activate stg01b
## go back to default (production)cuttle config context activate default
SPEKTRA Edge Accounts
The cuttle command allows you to switch between multiple accounts
(including service accounts).
A list of accounts can be obtained at cuttle config account list.
To register a new account, use cuttle auth login.
To switch the account used in the current context, give the
cuttle config context set command --account or --active-account.
Login Automation
When using the cuttle command in an environment without human
intervention to automate the process, the use of a service account
avoids the periodic re-login with cuttle auth login and the MFA
processing required for it.
Using ServiceAccount as an Account
By default, cuttle uses User as an Account when accessing EdgeLQ. It is
possible also to use ServiceAccount, more recommended for automated access.
You can create ServiceAccount in a project, if you don’t have one. Note it
requires you already have configured cuttle:
# Create service account resource. Each ServiceAccount has its own region,# but it can use still all the regions (public keys are shared).$ cuttle iam create service-account $ACCOUNT_ID --parent projects/$PROJECT/regions/$REGION
# Create service account key - and store creds in a file.$ cuttle iam create service-account-key $KEY_ID --parent projects/$PROJECT/regions/$REGION/serviceAccounts/$ACCOUNT_ID \
--algorithm RSA_2048 --credentials-output-file credentials.json
Assigning roles to ServiceAccount is out of scope of this document, refer to
IAM specification.
Once you have credentials.json file, you can add it to the cuttle:
You can see new account in the list obtained by cuttle config account list.
You may then create new context using this new account name:
$ cuttle config context set <contextName> --environment <envName> --account <accountName>
6.4 - Operating with the cuttle CLI
How to operate with the cuttle CLI.
The SPEKTRA Edge controller consists of multiple services, and the cuttle
command also consists of corresponding subcommands. For example,
the subcommands cuttle devices, cuttle limits, cuttle iam, and
cuttle monitoring directly correspond to the devices, iam, limits, and
monitoring services. Default cuttle offers access to core SPEKTRA Edge
services.
For specialized ones, built-on top of SPEKTRA Edge (like watchdog), cuttle is
slightly different: cuttle-watchdog v1alpha2 <subcommand> <collection> ....
Note that this specialized cuttle requires API version to be provided as
first argument. Regular cuttle as of now does offer only the newest (v1)
version.
Almost all resources related to SPEKTRA Edge support the Create, Read, Update,
and Delete (CRUD) operations. cuttle supports the create, get, batch-get,
list, watch, update, and delete subcommands, respectively.
Usually, after specifying service and command, you need to specify resource type.
As an example, if you want to list all device resources on the devices service
in a project, run the command cuttle devices list devices --project $PROJECT.
Similarly, to retrieve the Role Binding resource named
projects/test/role-bindings/rb01 on the IAM service, execute the command
cuttle iam get role-binding projects/test/role-bindings/rb01.
Apart from standard CRUD, cuttle exposes custom API calls as well, like
cuttle devices ssh <deviceName>. To see custom commands in a service, you
can invoke cuttle <service> --help.
Command restrictions
Some of the features provided by the cuttle command may have limitations
depending on the operating system. The following is a list of commands
that are restricted on the certain environment:
Command
Supported OS
cuttle os install
Linux environment only (for file system operations)
cuttle os edit
Linux environment only (for file system operations)
cuttle devices ssh
Linux environment only (for file system operations)
cuttle devices ssh
Linux and macOS environments only (for terminal control)
Cuttle provides operations output using table or JSON format, table is the
default. To see a response in JSON, add -o json to arguments when invoking
commands. JSON is able to display structures more properly in many cases.
You can add prettifier to the cuttle output if you use json formatting using
| jq . like:
$ cuttle iam list devices --project $PROJECT -o json | jq .
Standard write operations are create, update and delete. Note that create
operations allow multiple syntaxes when specifying resource name.
# Create a device resource with specified ID and parent name (containing# project and region)$ cuttle devices create device dev-id-1 --parent projects/your-project/regions/us-west2 \
<FIELD-ARGS> -o json
# Create a device resource with a bit different syntax than before.$ cuttle devices create device dev-id-2 --project your-project --region us-west2 \
<FIELD-ARGS> -o json
# Create a device with a RANDOM ID (since we do not specify ID of a device).# This command naturally can be invoked with --project and --region too.$ cuttle devices create device --parent projects/your-project/regions/us-west2 \
<FIELD-ARGS> -o json
# Update a device$ cuttle devices update device projects/your-project/regions/us-west2/devices/dev-id-1 \
<FIELD-ARGS> <UPDATE-MASK-ARGS> -o json
# Delete a device (no output is provided if no error happens)$ cuttle devices delete device projects/your-project/regions/us-west2/devices/dev-id-1
Resources usually belong to a project (like resource Distribution in
applications.edgelq.com), or project with region (like resource Device in
devices.edgelq.com). Occasionally some resources have more parent segments:
monitoring.edgelq.com/AlertingCondition has parent projects/{project}/regions/{region}/alertingPolicies/{alertingPolicy}.
monitoring.edgelq.com/Alert has parent projects/{project}/regions/{region}/alertingPolicies/{alertingPolicy}/alertingConditions/{alertingCondition}.
iam.edgelq.com/ServiceAccountKey has parent projects/{project}/regions/{region}/serviceAccounts/{serviceAccount}.
Some resources may have multiple parent types (but specific instance can have
only one). For example, resource iam.edgelq.com/RoleBinding has following
parent name patterns:
projects/{project}: Specifies RoleBinding in a Project scope.
organizations/{organization}: Specifies RoleBinding in a Organization scope.
services/{service}: Specifies RoleBinding in a Service scope.
``: Specifies RoleBinding in a system (root) scope (they have internal purpose).
$ cuttle iam create role-binding rb-id --parent 'projects/your-project' -o json
$ cuttle iam create role-binding rb-id --parent 'organizations/your-org' -o json
$ cuttle iam create role-binding rb-id --parent 'services/your-service' -o json
$ cuttle iam create role-binding rb-id # In a system scope -o json
Refer to a resource documentation to check possible name patterns.
Resource name serves as an identifier and cannot be changed.
Inside object, all field names must use lowerCamelCase.
When updating
If you are specifying fields for update operations, be careful not to overwrite
sub-fields in nested objects by accident! See Update mask arguments.
Other top field types (than strings and objects) are:
booleans (true/false), no quoting needed
numbers (integers or floats), no quoting needed
enums - they work like strings
durations - you need to pass an string with s. For example 300s is a
Duration of 300 seconds.
timestamps - format is YYYY-MM-DDTHH:MM:SS.xxxxxxxxxZ (you can omit
sub-seconds though).
Occasionally, you may need to set an array field. For example, there is a field
enabled-services in a iam.edgelq.com/Project resource. Suppose you want
to create a project with 2 services enabled:
If you are making an UPDATE operation on an array, be extra careful.
As of now, whole array is being replaced. For example, you have created
a project using one service:
Specifying only added service will remove previous items.
Update mask arguments
When updating (using update command) a resource using the cuttle command,
be careful about setting unintended zero values.
The update command defines only the top-level fields as arguments, and sets
the lower-level fields as JSON objects in the value. To update only specific
fields in the JSON object and ignore omitted fields, you must specify
an Update Mask.
The following is an example command for setting the value of the
spec.osVersion field of the Device resource to 1.0.7.
## This command is dangerous (other fields in the spec are set to zero values)cuttle devices update device $FULL_NAME \
--spec '{"osVersion": "1.0.7"}'## run with update mask to achieve intended operationcuttle devices update device $FULL_NAME \
--update-mask 'spec.osVersion'\
--spec '{"osVersion": "1.0.7"}'\
Clearing a field
If you want to clear a field from a resource, specify update mask argument:
# This will set description to an empty string, whatever value is there.$ cuttle iam update organization organizations/org-id --update-mask description -o json
# Get a resource$ cuttle devices get device projects/your-project/regions/us-west2/devices/dev-id-1 \
<FIELD-MASK-ARGS> -o json
# Get 2 resources (note you need to specify param name each time)$ cuttle devices batch-get devices \
--names projects/your-project/regions/us-west2/devices/dev-id-1 \
--names projects/your-project/regions/us-west2/devices/dev-id-2 \
<FIELD-MASK-ARGS> -o json
# List operation (you can also specify --project and --region instead of --parent)$ cuttle devices list devices --parent projects/your-project/regions/us-west2 \
--filter '<FILTER STRING>' --order-by '<ORDER BY STRING>' <FIELD-MASK-ARGS> -o json
# Search is like list, but allows for additional --phrase argument. Be aware not# all resources support search operations. Phrase must always be a string.$ cuttle devices search devices --parent projects/your-project/regions/us-west2 \
--phrase 'PHRASE STRING' --filter '<FILTER STRING>' --order-by '<ORDER BY STRING>' <FIELD-MASK-ARGS> -o json
Naturally filter, field mask and order by can be omitted if not needed.
Number of resources returned will be limited (100 by default), unless custom
page size is configured.
Field mask arguments
By default, if you don’t specify any field mask arguments, service will provide
pre-configured list of fields in a resource that developer configured in advance.
If you compare cuttle output with resource specification, you will see some fields
are usually missing. To provide an additional fields, you can specify extra paths
using --field-mask <lowerCamelCase.nested> arguments (as many as you need).
In the result, returned resources will contain pre-configured fields plus additional
specified by --field-mask arguments.
If you don’t want to receive pre-configured paths, just the paths you need, you can
add --view argument:
$ cuttle devices list devices --parent 'projects/your-project/regions/us-west2' -o json \
  --view NAME --field-mask 'status.connectionStatus' --field-mask 'spec.osVersion'
View NAME informs a service that it should return only name field of a resources matching
specified parent name. You can then add specific field paths as needed.
Under the hood, cuttle uses actually --view BASIC if you don’t specify a view
at all.
Collection reads within specific scope
Collection requests (list, search) typically require scope specification,
for example using --parent argument. Optionally, specific segments like
--project or --region.
$ cuttle devices list devices --parent 'projects/your-project/regions/us-west2' -o json
# This is equivalent$ cuttle devices list devices --project 'your-project' --region 'us-west2' -o json
It is also possible to specify wildcards. For example, if we want to query
devices from all the regions within a project, we can use - value:
$ cuttle devices list devices --parent 'projects/your-project/regions/-' -o json
# This is equivalent$ cuttle devices list devices --project 'your-project' --region '-' -o json
Filtering
Some reading commands allow to use --filter arg. It must be a string with
set of conditions connected using AND operator (if more than one condition
is needed): fieldPath <OPERATOR> <VALUE> [AND ...]. Operator OR is not
supported.
Field path may contain nested paths, each item must be connected with dot ..
Field path items should use lowerCamelJson style.
Operators are:
Equality (=, !=, <, >, <=, >=)
In (IN, NOT IN)
Contains (CONTAINS, CONTAINS ANY, CONTAINS ALL)
Is Null (IS NULL) - this type does not require Value.
Certain operators require array value (IN, NOT IN, CONTAINS ANY/ALL). User
needs to use [<ARG1>, <ARG2>, <ARG3>...] syntax.
# List connected devices within specified label$ cuttle devices list devices --parent 'projects/your-project/regions/us-west2'\
--filter 'status.connectionStatus="CONNECTED" AND metadata.labels.key = "value"' -o json
# List devices using IN conditions$ cuttle devices list devices --parent 'projects/your-project/regions/us-west2'\
--filter 'metadata.labels.key IN ["value1", "value2"]' -o json
# List devices without specified spec.serviceAccount field path.$ cuttle devices list devices --parent 'projects/your-project/regions/us-west2'\
--filter 'spec.serviceAccount IS NULL' -o json
# List devices using CONTAINS operation$ cuttle devices list devices --parent 'projects/your-project/regions/us-west2'\
--filter 'metadata.tags CONTAINS "value"' -o json
# List devices using CONTAINS ANY operation$ cuttle devices list devices --parent 'projects/your-project/regions/us-west2'\
--filter 'metadata.tags CONTAINS ANY ["value1", "value2"]' -o json
# List alerts with state.lifetime.startTime after 2025 began in UTC (all policies and conditions)$ cuttle monitoring list alerts --parent 'projects/your-project/regions/us-west2/alertingPolicies/-/alertingConditions/-'\
--filter 'state.lifetime.startTime > "2025-01-01T00:00:00Z"' -o json
Note that name arguments like --parent, --project, or --region are kind
of filter too!
Pagination
Collection requests like list/search offer pagination capabilities. Relevant arguments
are: --order-by, --page-size and --page-token.
To retrieve first page of devices we can do the following:
# Fetch top 10 devices. Since --order-by is not specified, it automatically orders by name# field in ascending order$ cuttle devices list devices --parent 'projects/your-project/regions/us-west2'\
--page-size 10 -o json
# This is equivalent command as above, with explicit order$ cuttle devices list devices --parent 'projects/your-project/regions/us-west2'\
--page-size 10 --order-by 'name ASC' -o json
# This sorts by display name instead in descending order.$ cuttle devices list devices --parent 'projects/your-project/regions/us-west2'\
--page-size 10 --order-by 'displayName DESC' -o json
It is allowed to sort by one column only as of now. If order by is specified by
other field than name, service will sort additionally by name as secondary
value though.
After receiving first response, you should see next page token if number of
resources is greater than value provided by page size:
Then, you need to use --page-token argument to fetch the next page. Filter, parent
and order by arguments must be same as before, otherwise results are not defined.
Page size may be optionally changed. Tokens must be treated as opaque strings, not
to be decoded.
Unfortunately, as of now --include-paging-info does not work without
--raw-response, which slightly changes output (stdout gets just full
raw response as JSON).
In the JSON output from response, look out for totalResultsCount value. If
you are paginated results, you will also see currentOffset.
Watch operations
Watch operations are long-running read operations (subscription for updates).
There are 3 types:
Single resource watch
Stateful collection watch (paged)
Stateless collection watch (non-paged)
Note: All watch commands require -o json. Without this, you will not get
anything on stdout. You can add | jq . at the end of any command for easier
to read output.
# Watch specific device$ cuttle devices watch device projects/your-project/regions/us-west2/devices/dev-id-1 -o json
# Watch first 10 devices (stateful)$ cuttle devices watch devices --parent projects/your-project/regions/us-west2 \
--type STATEFUL \
--page-size 10 --order-by 'displayName ASC' -o json
# Watch devices in a project (stateless). Specify max number of devices in each# response.$ cuttle devices watch devices --parent projects/your-project/regions/us-west2 \
--type STATELESS --max-chunk-size 10 -o json
After sending request, user will receive first response (snapshot). Cuttle
process however will not quit, but instead hang on, appending more responses to
the stdout - real time updates.
Single resource watch
It is very simple watch of a single, specific resource. It works very similar
to get requests, except it provides real-time updates after initial response.
User can specify --field-mask arguments (and --view), just like with get.
Server will skip real time updates if changed fields are not affecting watched fields.
Initial response will contain JSON like (assuming device is a resource name):
In stateful watch type, returned resources are sorted, therefore they have
positions. Each added entry contains position in viewIndex field. They
are 0 indexed!
Apart from resource list, additional fields are:
isCurrent: Always true, not relevant for stateful watches
snapshotSize: Always -1, not relevant for stateful watches
pageTokenChange: Contains next/prev page tokens, if they changed from
previous response. Always included in initial response.
Second and next stateful watch responses will contain only changes that
happened on the page that is being observed. It means that:
Changes on resources outside --parent or --filter are not received.
Changes within --parent and --filter that are in the relevant scope,
but outside --order-by, --page-size, --page-token, are also not
received.
Only inserted/modified/removed resources are within changes list. For
example, if initial list contained 100 objects, and 2 changed later on,
subsequent response will contain just 2 objects. Client should update
fetched page accordingly. Watch does not send full snapshot each time.
added: Informs that selected resource was inserted into the list on
some specified position. It includes pre-existing resources that
were got position into the list due to the modification.
modified: Informs that selected resource on the list was modified.
If resource changed position on the list (due to changes in fields
pointed by --order-by), then viewIndex will be different from
previousViewIndex.
removed: Informs that selected resource was removed from the list.
It includes cases when resource modifications that result in
resource no longer matching --filter argument. Moreover, it
includes cases when resource falls out of a view due to
an insertion of a new resource above.
Notes about removed are important: They include not only
deletions and modifications, but also can be sent for resources
that did not change at all. All it takes, is for resource to fall
outside of a view. For example, if we observe top 10 resources,
and new one is created on position 3, two events will be in a
change list:
removed, with viewIndex of value 9
added, with viewIndex of value 3
In stateful watch, change list must be applied in same order as in a response
object. This is why, when new resource is inserted, we first have removal,
then addition. If addition was executed first (and view index was 3),
then item in removed object would need to have viewIndex equal to 10, not 9.
Stateless watch
Stateless watch is another collection-type watch (observes list of resources),
but has following differences compared to the stateful one:
Pagination is not supported. Params --order-by, --page-size and
--page-token have no meaning.
View indices in responses are meaningless as well, since resources are
not ordered at all.
Initial snapshot may be sent in multiple responses, because they may
contain potentially thousands of thousands of resources. This is
chunking.
Responses will contain resume tokens. If connection is lost, client
can reconnect and provide last received token to continue receiving
updates from the last point.
Request object can specify resume token, or starting time from which we
want to receive updates.
Response uses different change object types: current and removed, not
added, modified. View index in removed has no meaning.
This watch type is not limited by page size - caller will receive all objects
as long as they satisfy parent and filter fields.
There are multiple ways to establish this watch session:
# This will fetch full snapshot of devices in specified project/region# Then, it will continue with real-time updates.$ cuttle devices watch devices --parent projects/your-project/regions/us-west2 \
--type STATELESS --max-chunk-size 10 -o json
# This will fetch historic updates from specified timestamp till now, then# it will hang for real-time updates.$ cuttle devices watch devices --parent projects/your-project/regions/us-west2 \
--type STATELESS --max-chunk-size 10 --starting-time '2025-01-01T00:00:00Z' -o json
# This will fetch historic updates from resume token till now, then# it will hang for real-time updates.$ cuttle devices watch devices --parent projects/your-project/regions/us-west2 \
--type STATELESS --max-chunk-size 10 --resume-token 'sjnckcml4r' -o json
Highlights:
Max chunk size is optional, 100 if not specified.
Resume token and starting time should not be used at the same time
If neither resume token or starting time were specified, backend will deliver
full snapshot of resources.
Resume token can be obtained from previous watch only. It should be
treated as opaque string, not to be decoded.
If resume token or starting time is too far into the past, backend
may respond with an error. In that case, it is better to restart watch
without neither specified, to get full snapshot.
If full snapshot is specified, then initial responses will look like:
However, be aware that field isCurrent may be false, and resumeToken empty,
if snapshot turns larger than max chunk size. In that case, client will receive
multiple responses, and only the last one will have isCurrent equal to true,
and resumeToken populated.
In fact, if client receives response without isCurrent equal to true, client
must wait for more responses until this condition is satisfied! This is true
not only for initial snapshot, but any further updates.
After snapshot is received, next responses will have following form:
Basically, clients should expect two change types:
current: Can describe creation or update. Resource may, or may not exist
prior to the event.
removed: This can be deletion, or update that resulted in resource no
longer satisfying filter field.
Client should keep track of the last resume token if needed.
Stateless watch type may deliver following special responses:
{
"isSoftReset": true,
"snapshotSize": "-1"}
If isSoftReset is set to true, client must discard all received changes
after last isCurrent was set to true. Let’s look at scenarios:
No-op scenario:
Client receives response with non-empty change list, and isCurrent
is true
Client receives response with isSoftReset set to true.
Client does not need to discard anything, since there were no updates
between soft reset event and last update with isCurrent equal to true.
With actual reset scenario:
Client receives response with non-empty change list, and isCurrent
is true
Client receives response with non-empty change list, and isCurrent
is false
Client receives response with isSoftReset set to true.
Client should discard second message, where isCurrent was false.
If isSoftReset is received during snapshot, it means whole snapshot needs
to be discarded.
Other special response that client may receive, is hard reset:
{
"isHardReset": true,
"snapshotSize": "-1"}
If hard reset is received, client must discard whole data it has. Hard
reset will be followed by fresh snapshot.
Finally, there is a possibility of another special message, where snapshot size
is equal or greater than 0:
{
"snapshotSize": "1234"}
If client receives this message, they must check if number of unique resources
they have is equal to the snapshot size. If yes, nothing needs to be done. But,
if number is wrong, client must disconnect and reconnect without resume token
or starting time. This mismatch indicates that some events were lost.
This special message type however is limited to firestore backend type. If
service uses mongo, this wont happen.
6.5 - Help commands
How to get help on the cuttle CLI
When invoking the cuttle command, you can add the --help option
to see details on how to use each subcommand. This will help you
perform your daily operations more smoothly.
7 -
SPEKTRA Edge OS
SPEKTRA Edge OS is the operating system that runs on your edge devices. It is
purpose-built for unattended, remotely managed fleets: it boots into a known,
read-only system, keeps your configuration and data on dedicated persistent
storage, and reconciles its settings from the SPEKTRA Edge platform so you can
manage thousands of devices the same way you manage one.
This guide explains how the OS is structured and how to configure it so that you
can set up and operate your own devices. Most settings are applied from the
SPEKTRA Edge dashboard (or through the API); a few are chosen when
you create the install image.
a device (or hardware you intend to provision) under the project
New to the platform?
If you have not provisioned a device yet, start with the
getting started guide. It walks you through creating a
project, downloading an OS image, and bringing your first device online.
How this guide is organized
The guide is grouped by what you are trying to accomplish.
Understand how the OS is laid out, how persistence works (what survives a reboot
and what survives an upgrade), and which hardware platforms are supported.
Configure wired, Wi-Fi, and cellular connectivity, understand how the device
falls back between uplinks, set a proxy, and review the connectivity and time
synchronization requirements.
Run the fleet day to day: OS upgrades and rollback, reboot and recovery,
logging, health checks, status indicators, boot/shutdown hooks, and workloads.
Look things up quickly: the full configuration field reference, ports and
connectivity table, persistent file locations, troubleshooting playbooks, and a
glossary.
Bring an existing Debian/Ubuntu Linux under management without the full OS image:
install the droplet agent from a .deb package and onboard it with a
project-scoped service account.
7.1 -
Overview
This section explains the ideas you need before configuring a device: how the OS
is structured, how persistence works, and which platforms are supported.
A managed, reconciled operating system
SPEKTRA Edge OS is designed to be operated remotely and at scale. Instead of
logging into each device to make changes by hand, you describe the desired state
of a device on the SPEKTRA Edge platform, and the device continuously reconciles
itself to match. This is the same model whether you manage one device or
thousands.
Two consequences are worth keeping in mind from the start:
The system runs from a read-only image. The core operating system is not
meant to be modified in place. This keeps every device in a known, consistent
state and makes upgrades and rollback reliable.
Your configuration and data live on separate, persistent storage. Anything
you need to keep across reboots is stored outside the system image.
How persistence works
Understanding what persists is the single most useful thing to know about the
OS, because it explains why some changes “disappear” and others stick.
There are three kinds of storage on a device:
Storage area
Contents
Survives reboot?
Survives OS upgrade?
System image
The operating system itself
Yes (read-only)
Replaced by the new version
Configuration
Device identity, network, storage, time, and other settings; administrator password; boot/shutdown hooks
Yes
Yes
Data
Container images, workload data, logs
Yes
Yes
The practical rules that follow:
Ad-hoc changes to the live system do not persist. If you log into a device
and edit a file that belongs to the system image, your change is gone after the
next reboot. This is intentional.
To make a durable change, use the configuration mechanisms described in
this guide — the dashboard/API for most settings, and files in the
configuration area for the rest.
Upgrades and rollback are safe by design. Because the system image is
swapped as a unit while your configuration and data are preserved, you can move
between OS versions without losing your setup. See
OS upgrades.
Why did my change revert?
If a manual change to a device reverted after a reboot, it almost certainly
modified the read-only system image. Apply the change through configuration
instead so it is reapplied automatically on every boot.
Supported platforms
SPEKTRA Edge OS runs on two hardware families. When you create an image or
register hardware, the platform is identified by its device type, which
combines the hardware family with the CPU architecture.
Hardware family
CPU architecture
Generic
x86-64
Raspberry Pi (3/4)
ARM64
The device type determines which OS images are compatible with a given device.
You select it when creating an install image and when pinning an OS version.
This section takes a device from blank hardware to a managed device: creating an
install image, onboarding the device so it joins your project, setting the
administrator password, and confirming it is online.
Setup at a glance
Create an install image for the target device type, with the defaults you
want baked in (encryption, network, storage, time).
Write the image to installation media and boot the device from it.
Onboard the device so it obtains an identity and joins your project.
Set the administrator password for local and console access.
Verify the device is online on the dashboard.
The rest of this page covers each step.
Create an install image
You create install images from the SPEKTRA Edge dashboard. When you
create an image you choose:
the device type (hardware family and architecture) — see
supported platforms
provisioning credentials, so the device can onboard automatically on first
boot (see onboarding methods below)
The values you embed at image creation become the device’s initial
configuration. Almost all of them can be changed later from the dashboard once
the device is online — the image just provides sensible starting defaults so a
device is useful the moment it boots.
Write the image and boot
Write the downloaded image to your installation media, then boot the target
hardware from that media. The device boots into SPEKTRA Edge OS, applies the
embedded configuration, and begins onboarding.
Tip
Keep the same install image for a batch of identical devices. Per-device
differences (name, location, network specifics) are best applied after the
device is online, so a single image can serve a whole fleet.
Onboarding methods
Onboarding is how a device obtains its identity and joins your project. There are
three approaches; choose based on how much you want to pre-arrange versus letting
devices self-register.
Zero-touch provisioning
With zero-touch provisioning, a device that has never been configured can find
the right SPEKTRA Edge deployment, prove its hardware identity, and receive its
credentials automatically — no per-device setup required. This is the preferred
method for large fleets and for hardware that is shipped directly to a site.
Zero-touch provisioning relies on the device’s hardware security module to
establish a trustworthy identity. See TPM & device attestation for how
that identity is verified.
Provisioning policy
A provisioning policy lets devices self-register into a project using a
shared credential and a template that describes how each new device should be
configured. Policies operate in one of two modes:
Mode
Behavior
Unattended
A device that presents the policy credential is registered automatically and created from the policy’s template.
Manual approval
A device that presents the policy credential creates a pending request that an operator must approve before the device becomes active.
The policy template carries the desired device configuration (network, SSH,
logging, and so on), so every device created through the policy starts from the
same baseline.
Pre-registering hardware
You can pre-register specific hardware ahead of time and bind it to a
provisioning target. A field technician can then bring the hardware online using
a registration token without needing project credentials in hand. This is
useful when installation is performed by someone who should not have broad access
to the project.
Set the administrator password
Each device has a local administrator account used for console and SSH
access. For security, devices ship without a usable default password — you set
the password yourself.
You can set the administrator password:
at image creation, so it applies to every device built from that image, or
when preparing installation media, on a per-device basis.
The password must be non-empty, and it is stored only as a salted hash on the
device’s configuration storage. See User accounts for details and
for how to reset a lost password.
Verify the device is online
Once the device boots and onboards, it appears in the dashboard under your
project. A device is Online when the platform detects it as connected.
On the device overview page you can confirm:
connection status (Online / Offline)
device information — OS version, hardware details, disks, and network
interfaces
This section describes how device storage is laid out by default and how to add
your own partitions and mounts or expand storage to use the whole disk.
Default disk layout
A device’s primary disk is divided into a small number of areas, each with a
distinct role:
The data area takes the remaining space on the disk, so most of the disk is
available to your workloads. The configuration and data areas hold everything
you set up; the boot and system-image areas belong to the OS and are managed for
you across upgrades.
Configuring additional partitions and mounts
You can attach extra storage and control where it is mounted using a
storage mapping. The mapping is a YAML document that lists the partitions a
device should ensure exist and where each should be mounted, plus any bind
mounts that redirect a directory to persistent storage.
You can provide the storage mapping when you create an install image
(so it applies from first boot) or push it from the dashboard.
Mapping format
A storage mapping has two sections: diskmappings (partitions to ensure and
mount) and bindmounts (directories to redirect).
The target disk or partition (for example, /dev/sdb).
partition_number
When disk is a whole disk
Which partition to create or use.
mountpoint
Yes
Absolute path, or a logical name (see below).
size
For new partitions
Size with an SI suffix (500M, 1G, 2T), or -1 to use all remaining free space.
filesystem
For new partitions
Filesystem to create, for example ext4.
Behavior to keep in mind:
If a partition already exists, it is mounted as specified; size and
filesystem are ignored (existing data is not reformatted).
If a partition does not exist and there is room, it is created with the
requested size and filesystem, then mounted.
A partition with size: -1 grows to fill the free space available on its
disk.
Logical mount names
For convenience, a few common destinations can be referenced by name instead of
an absolute path:
Logical name
Mounts at
logs
/var/log
docker
/var/lib/docker
droplet
the device agent’s working directory
Bind mounts
A bind mount redirects a directory onto persistent storage so its contents
survive reboots and upgrades. By default, the standard runtime directories
(container storage, logs, and the agent’s working directory) are already bound to
the data area; add your own entries only when you want additional directories to
persist or to live on a separate disk.
Reformatting is never automatic
The device never reformats a partition that already exists. To repurpose a disk
that already has data on it, clear it first; otherwise the mapping will simply
mount what is already there.
Expanding storage
When you install onto a disk that is larger than the image, the data area can be
grown to use the extra space:
During installation you can request that the last partition be expanded to
fill the disk.
A storage mapping entry with size: -1 grows the data partition to consume the
remaining free space.
This lets a single image target disks of different sizes while still using all
available capacity for workloads and data.
Next steps
Turn on disk encryption to protect the configuration and data
areas.
This section covers how a device connects to the network and to the SPEKTRA Edge
platform: how you describe network configuration, how the device falls back
between connections, how to route through a proxy, what the device needs to reach
on the network, and how time is kept in sync.
Device networking is described as a Netplan-format YAML document. This is a
clean, declarative way to configure wired, Wi-Fi, and cellular connections, as
well as advanced setups such as bonds, bridges, VLANs, and tunnels.
You can supply the network configuration when you
create an install image (so the device has connectivity from first
boot) and you can update it later from the dashboard. When you push
configuration from the platform, you choose how it combines with what is already
on the device:
Mode
Behavior
Merge
The pushed configuration is merged with the device’s existing configuration.
Replace
The pushed configuration replaces the device’s existing configuration.
Netplan reference
For configuration syntax and examples for each connection type, see the official
Netplan documentation. SPEKTRA Edge accepts standard Netplan YAML.
The device reports its observed network state back to the platform — active
interfaces, IP addresses, and carrier information — which you can view on the
device overview page.
Wired, Wi-Fi, and cellular
All three connection types are configured through the same network
configuration document:
Wired connections typically use DHCP by default and need no configuration
to come up.
Wi-Fi connections are configured with the network name and credentials.
Cellular connections are configured for the modem; a device can also be
associated with a SIM in the platform for inventory and activation tracking.
A field device often has more than one way to reach the network, and its
configuration can be changed remotely. To keep a configuration mistake or a link
outage from taking a device permanently offline, the OS has several layers of
fallback — network configuration fallback, uplink (interface and cellular)
failover, and proxy fallback. These are covered in detail on the
Connection fallback page.
In this section
Connection fallback — how the device stays reachable across bad
config pushes, link outages, and proxy failures.
Devices are often deployed where connectivity is imperfect: a misapplied network
change, a flaky uplink, or a proxy that goes down. SPEKTRA Edge OS has several
fallback behaviors that keep a device reachable and recoverable. This page
explains the three that matter most: network configuration fallback, uplink
(interface and cellular) failover, and proxy fallback.
Network configuration fallback
When you push a new network configuration to a device, there is always a risk
that the new configuration is wrong and takes the device offline — which would
also prevent you from pushing a correction.
To guard against this, a device can fall back to a known-good network
configuration that was established when the device was set up. If a
platform-supplied configuration leaves the device unable to reach the platform,
the device can revert to this baked-in configuration so it can be reached again.
You can control this behavior:
Setting
Effect
Fallback enabled (default)
If platform-supplied network configuration fails, the device reverts to its known-good configuration.
Fallback disabled
The device always uses the platform-supplied configuration and never reverts.
Disable fallback with care
Disabling fallback means a bad network configuration can make a remote device
unreachable until someone visits it physically. Leave fallback enabled unless you
have a specific reason and a way to recover the device locally.
Uplink failover (interfaces and cellular)
A device can have more than one uplink — for example wired Ethernet plus
cellular, or wired plus Wi-Fi. When multiple uplinks are configured, the device
prefers the primary uplink and uses the others as backups, switching to a working
uplink when the preferred one is unavailable.
A common, robust pattern is:
Wired Ethernet as the primary uplink (DHCP).
Wi-Fi or cellular as a backup that takes over when the wired link is
down.
Cellular is especially useful as a last-resort uplink because it does not depend
on local site infrastructure. Associate a SIM with the device during hardware
registration, configure the cellular connection in your network YAML, and the
device can fall back to it to stay manageable.
Proxy fallback
When a device is configured to reach the platform through a
proxy, it still needs to stay reachable if that proxy becomes
unavailable. The device evaluates the available paths to the platform and uses a
working one, so a single failed proxy does not necessarily cut the device off
from management.
This means you can introduce a proxy for normal operation without making it a
single point of failure for device management, provided a viable path to the
platform remains.
Putting it together
For a remote, hard-to-reach device, a resilient setup combines all three:
Keep network configuration fallback enabled so a bad push self-corrects.
Provide a backup uplink (cellular is ideal) so a single link failure does
not isolate the device.
If you use a proxy, ensure a viable path to the platform remains so proxy
problems do not block management.
If your devices reach the internet through a forward proxy, configure the proxy
so that both the device’s connection to the SPEKTRA Edge platform and your
workloads’ traffic are routed correctly.
What you can set
Proxy configuration consists of the standard proxy settings:
Setting
Meaning
http_proxy
Proxy URL for plain HTTP traffic.
https_proxy
Proxy URL for HTTPS traffic.
no_proxy
Hosts and networks that should bypass the proxy (comma-separated).
In addition, you can specify which network interfaces the device should use to
reach the platform through the proxy, so control-plane traffic uses the intended
path.
Where to set it
You can configure the proxy:
at image creation, so devices use the proxy from first boot, or
from the dashboard for a device that is already online.
The proxy applies both to the device’s own communication with the platform and to
container workloads running on the device.
Fallback behavior
The device determines the best route to the platform and will fall back to a
direct connection when the proxy is not usable, so a proxy outage does not
necessarily take a device offline. If you require that all traffic traverse
the proxy, ensure direct egress is blocked at the network level rather than
relying on device configuration.
no_proxy recommendations
Add to no_proxy any destinations that must not go through the proxy, such as:
on-site services the device talks to directly (local registries, local APIs)
link-local and private ranges used on the device’s LAN
Next steps
Review connectivity & ports to confirm what the device must reach
through (or around) the proxy.
7.4.3 -
Connectivity & ports
This page lists what a device needs to reach on the network and what it accepts
on its own interfaces, so you can plan firewall rules for the sites where your
devices run.
Outbound connectivity (required)
A device reaches the SPEKTRA Edge platform over secure, outbound connections.
Devices do not need any inbound connections from the platform — all
communication is initiated by the device.
Destination
Port
Purpose
SPEKTRA Edge platform endpoints
TCP 443
Provisioning, configuration, telemetry, log forwarding, and remote access — all over TLS.
At minimum, allow outbound TCP 443 to the platform and outbound UDP 123
to your time sources. If you use a proxy, the device’s platform traffic
egresses through it.
Inbound (on the device)
By default a device exposes only what is needed to administer it locally:
Port
Purpose
TCP 22
SSH access. Can be restricted or disabled — see SSH access.
The device also responds to local network discovery (mDNS) so it can be found by
name on the local segment; this can be turned off with the device discovery
setting.
Any ports your workloads expose are determined by the workloads you deploy,
not by the OS.
Remote access does not require inbound ports
Operator actions such as opening a remote shell, transferring files, or
streaming logs are carried over the device’s existing outbound connection to the
platform. You do not need to open inbound ports to use them. See
Remote access.
Firewall planning checklist
Allow outbound TCP 443 to the SPEKTRA Edge platform (directly or via
proxy).
Allow outbound UDP 123 to your NTP sources.
Allow outbound UDP to your chosen STUN servers (or accept that external
IP discovery is unavailable).
Decide whether local TCP 22 (SSH) should be reachable on your LAN.
Open any ports your workloads require, per workload.
7.4.4 -
Time synchronization
Accurate time is important for secure connections, certificate validation, log
correlation, and device attestation. Devices keep their clocks synchronized over
the network using NTP.
Default behavior
Out of the box, a device synchronizes against public time sources, so a device
with internet access keeps accurate time without any configuration.
Setting custom NTP servers
If your environment requires specific time sources — for example, internal NTP
servers on an isolated network — you can provide your own NTP configuration. You
can set it:
at image creation, so it applies from first boot, or
by placing an NTP configuration on the device’s configuration storage.
When custom NTP settings are provided, they take effect early in the boot process
so the device’s clock is correct before it contacts the platform.
Recommendations
On networks without internet access, always configure reachable internal
NTP servers; otherwise the device cannot correct its clock, which can cause
secure connections and attestation to fail.
Make sure outbound UDP 123 to your time sources is allowed — see
Connectivity & ports.
Clock errors and connectivity
A device whose clock is far off may be unable to establish TLS connections to the
platform and may fail attestation. If a device cannot come online and you suspect
time, verify it can reach an NTP source.
7.5 -
Security
SPEKTRA Edge OS is built for devices that run unattended, often in physically
exposed locations. This section explains the security controls available to you
and how to configure them.
Remote access — operator access through the platform and what is
recorded.
7.5.1 -
Disk encryption
Disk encryption protects the data at rest on a device, so that a lost or stolen
device does not expose your configuration or workload data. This page explains
what is encrypted, how a device unlocks itself, and how to recover access.
What is encrypted
When encryption is enabled, the two areas that hold your information are
encrypted:
the configuration area (device settings, identity, administrator password,
hooks)
the data area (container images, workload data, logs)
The boot and system-image areas are not encrypted; they contain only the
operating system, which is public and identical across devices.
Enabling encryption
Encryption is chosen when you create an install image. You can also set
an initial recovery passphrase at that time. Because enabling encryption affects
how the disk is laid out, it is selected at image creation rather than toggled on
a running device.
How a device unlocks itself
Encrypted devices unlock automatically at boot using the device’s hardware
security module (TPM). The encryption keys are bound to the device’s hardware and
to the integrity of its boot state, so the disk unlocks only on the same
device, booted normally. There is no passphrase to type at the console during a
normal boot, which is what allows encrypted devices to run unattended.
Because the keys are tied to the hardware, moving an encrypted disk to different
hardware will not unlock it. This is the intended protection.
Recovery passphrase
In addition to automatic hardware unlock, a device can hold a backup recovery
passphrase. This is a human-known passphrase you can use to unlock a device if
automatic unlock is unavailable — for example after certain hardware changes.
Recommendations:
Set a recovery passphrase (at least 12 characters) when you enable encryption.
Store it securely, separately from the device.
Treat it as a break-glass credential — it can unlock the encrypted areas.
Devices use a hardware security module — a TPM (Trusted Platform Module) — to
establish a strong, hardware-rooted identity and to protect sensitive material.
This page explains what the TPM is used for and how attestation works during
provisioning.
What the TPM is used for
Device identity. The TPM holds keys that uniquely and verifiably identify
the device. These keys cannot be copied off the device.
Attestation. During provisioning, the device proves its
identity and reports its integrity to the platform before it receives
credentials.
Disk unlock. When disk encryption is enabled, the TPM stores
the keys that unlock the encrypted areas, bound to the device’s boot state.
Attestation during provisioning
When a device onboards using zero-touch provisioning or a provisioning
policy, it presents hardware-backed identity to the platform and responds to a
challenge that proves the keys really live in this device’s TPM. Only after this
succeeds does the device receive its credentials. This is what makes it safe to
ship unconfigured hardware directly to a site: an attacker cannot impersonate a
device without its TPM.
For attestation to succeed, the platform must trust the device’s TPM. This is
established through the manufacturer’s certificates, which an administrator
registers in the platform so that devices from a given manufacturer or product
line can be verified.
Attestation configuration and status
You can configure attestation expectations for a device, and the device reports
its measured integrity values back to the platform, where you can review them on
the device. Use this to confirm that devices booted in the expected state.
Requirements
The device must have a functioning TPM.
The device’s clock must be reasonably accurate for the secure exchange to
succeed — see Time synchronization.
Secure Boot — complements attestation by verifying the boot
chain.
7.5.3 -
Secure Boot
Secure Boot is a firmware feature that ensures a device only runs boot software
that is cryptographically signed and trusted. SPEKTRA Edge OS supports Secure
Boot so that the boot chain — from firmware through to the operating system — is
verified before it runs.
Why use Secure Boot
Secure Boot protects against tampering with the boot path. Combined with
disk encryption and device attestation, it raises the bar
for an attacker with physical access: the device will refuse to boot modified or
untrusted boot software.
What you need to do
On most generic x86 hardware, SPEKTRA Edge OS works with Secure Boot enabled
using trust that is already present in the firmware, so you can simply leave
Secure Boot enabled in the device’s firmware (UEFI) settings.
To enable or disable Secure Boot, enter the device’s firmware setup at boot and
change the Secure Boot setting, as you would for any UEFI system. Refer to your
hardware vendor’s documentation for how to reach firmware setup.
Locked-down firmware and certificate enrollment
Some hardware is locked down to trust only a specific set of signing
certificates. In those environments you may need to enroll the SPEKTRA Edge
signing certificate into the firmware’s trusted database so that the device
will boot the OS.
If you operate such hardware, contact your SPEKTRA Edge representative for the
signing certificate and enrollment guidance for your platform.
If a device will not boot with Secure Boot on
If a device fails to boot only when Secure Boot is enabled:
Confirm the firmware is up to date.
If the firmware requires explicitly trusted certificates, enroll the SPEKTRA
Edge signing certificate (see above).
As a diagnostic step, temporarily disable Secure Boot to confirm it is the
cause, then re-enable it once trust is established.
Secure Boot and encryption
Disk encryption does not require Secure Boot, and toggling Secure Boot is handled
so that an encrypted device can still unlock. You can adopt them independently.
7.5.4 -
SSH access
A device runs an SSH server so you can reach its console for administration. You
control whether SSH is enabled, how users authenticate, and where connections may
originate. SSH settings are managed from the dashboard (or the API)
and applied to the device automatically.
Enabling or disabling the SSH server
You can turn the SSH server off entirely for devices that should never accept
direct shell access. With the server disabled, you can still administer the device
through remote access over the platform connection.
Authentication
You can control how users authenticate:
Setting
Effect
Disable password authentication
Require keys; passwords are not accepted.
Disable key authentication
Accept only password authentication.
Authorized keys
The set of public keys allowed to log in.
Authorized keys
You can provide one or more authorized public keys. Each key entry supports the
usual SSH key options, including:
marking a key as a certificate authority, so SSH certificates it signs are
accepted
restricting a key to specific source addresses
forcing a specific command
applying restrictions and principals
Using a certificate authority is recommended for fleets: you can issue
short-lived SSH certificates to operators instead of distributing individual keys
to every device.
Restricting where connections come from
You can limit which source addresses may connect:
an allow list of addresses/ranges permitted to connect
a deny list of addresses/ranges that are blocked
This is the closest thing to a host firewall for SSH and is the recommended way
to limit exposure when SSH must remain reachable on a LAN.
Brute-force protection
The device protects the SSH service against repeated failed login attempts by
temporarily banning offending sources. You can tune this behavior through the
device configuration, including:
the ban duration applied to an offending source
an ignore list of trusted sources that are never banned
Recommendations
Prefer key or certificate authentication and disable passwords where
possible.
Use source restrictions to limit who can reach SSH.
Keep an ignore list for your own management hosts so administrative tooling
is not banned.
Related
User accounts — the administrator account used for login.
Remote access — administer devices without exposing SSH on the LAN.
7.5.5 -
User accounts
Each device has a local administrator account used for console and
SSH access. This page explains how its password is set and stored, and how
to recover access if the password is lost.
The administrator account
The administrator account (admin) has the privileges needed to operate the
device locally. For security, devices ship without a usable default password —
the administrator password is something you set yourself, so there is no
well-known credential to exploit.
Setting the password
You can set the administrator password:
at image creation, so it applies to every device built from that image, or
when preparing installation media, on a per-device basis.
The password must be non-empty. It is stored only as a salted hash on the
device’s configuration storage — the plaintext password is never
written to the device. When the configuration area is encrypted,
the stored hash is protected at rest as well.
Resetting a lost password
Because the password is stored on the device’s configuration storage rather than
inside the read-only system image, it can be reset:
by re-applying an administrator password to the device’s installation media,
or
by re-imaging the device if you also want to reset the rest of its
configuration.
If the device is reachable through the platform, you can also continue to operate
it via remote access while you arrange a local password reset.
Recommendations
Use a strong, unique administrator password per fleet or per device.
Enable disk encryption so the stored password hash and all
configuration are protected at rest.
USB device control lets you restrict which USB peripherals a device will accept,
protecting against unauthorized devices being plugged into hardware in the field.
It is configured from the dashboard (or the API).
How it works
When USB device control is enabled, the device accepts only USB peripherals that
match your allow rules; everything else is rejected. When it is disabled, USB
devices are accepted normally.
Allow rules
Each allow rule describes the USB devices it permits. You can match on:
Criterion
Matches on
Device ID
The USB vendor/product identifier.
Device name
The device’s reported name.
Connected port
The physical port path the device is attached to.
Interface
The USB interface class the device exposes.
Connection type
How the device is connected.
Rules can match a specific value or one of a set of values, so you can, for
example, allow a specific approved peripheral on any port, or allow only devices
connected to a particular internal port.
Recommendations
Enable USB device control on devices in physically exposed locations.
Allow only the specific peripherals your deployment needs (for example, an
approved cellular modem or sensor), and reject everything else.
Account for peripherals that are part of the device itself when writing rules,
so enabling control does not disable required internal devices.
Test before wide rollout
Apply your USB rules to a representative device first and confirm all required
peripherals still work before rolling the policy out to a fleet.
7.5.7 -
Remote access
You can administer devices remotely through the SPEKTRA Edge platform without
exposing any inbound ports on the device. Operator actions are carried over the
device’s existing outbound connection to the platform.
What you can do remotely
Through the platform you can:
open a remote shell on a device
transfer files to and from a device
stream system logs and container logs
start, stop, and restart workloads
reboot or shut down a device
These work from the dashboard and from the cuttle command-line
tool.
No inbound ports required
Because remote access rides on the device’s outbound connection to the platform,
you do not need to open inbound ports or expose the device to reach it. This
is what lets you administer devices behind NAT or restrictive firewalls. See
Connectivity & ports.
Relationship to SSH
SSH access governs direct connections to the device’s SSH server on
the local network. Remote access through the platform is separate and works even
when SSH is restricted to a LAN or disabled entirely — making “SSH disabled on
the device, administer through the platform” a viable hardening posture.
Auditing
Operator access through the platform is associated with the authenticated user
who initiated it, so administrative actions can be attributed. Combine remote
access with your organization’s account controls to govern who may reach devices.
7.6 -
Operations
This section covers running devices day to day: upgrading the OS and rolling
back, rebooting and recovering, collecting logs, checking device health, reading
status indicators, running scripts at boot and shutdown, and deploying
workloads.
In this section
OS upgrades — move devices to a new OS version, and roll back.
You upgrade a device’s operating system by setting the OS version you want; the
device downloads the new version, switches to it, and reboots. Because the
system image is separate from your configuration and data, your
setup is preserved across the change, and you can roll back to a previous version.
How upgrades work
You set the target OS version for a device (or a group of devices) from
the dashboard.
The device downloads the requested version and prepares it alongside the
current one.
The device switches to the new version and reboots.
After reboot, the device reports its new version, and your configuration and
data are intact.
A device keeps more than one OS version on disk — the one it is running and the
one it can fall back to — which is what makes switching versions and rolling back
fast and safe.
Detailed dashboard walkthrough
For a step-by-step walkthrough with screenshots of upgrading and downgrading a
device from the dashboard, see Manage SPEKTRA Edge OS releases.
Release channels and compatibility
OS versions are published per device type, so a device is only
offered versions compatible with its hardware.
Some upgrades may require a minimum current version before you can move to
the target, to ensure a supported upgrade path.
Rolling back
If a new version misbehaves, you can roll a device back to the version it was
running before, or to its original factory version. Because the previous version
is retained on the device, rollback does not require re-downloading it.
Set the desired (earlier) version the same way you set an upgrade; the device
switches back and reboots.
Encrypted devices
Managed upgrades preserve automatic unlock on encrypted devices —
no manual action is required to keep an encrypted device unlocking across an
upgrade.
If an upgrade does not complete
Confirm the device has connectivity to download the new version
(including through any proxy).
A device that fails to start a new version can fall back to the retained
previous version.
This page covers power actions you can take remotely and the options for
recovering a device that is not behaving as expected.
Reboot and shutdown
You can reboot or shut down a device remotely from the
dashboard or with the cuttle command-line tool. These actions
are carried over the device’s connection to the platform and require no inbound
access to the device.
A device that loses power or is reset returns to its configured state on next
boot, because configuration and data are persistent and the system image is
read-only.
Automatic recovery
The OS is designed to keep itself running unattended:
It restarts automatically after an unexpected fault rather than waiting at an
error.
Workloads configured to run are brought back up after a reboot.
If a network configuration change does not produce a working connection, the
device can fall back to known-good network settings — see
connection fallback.
Recovery options
When a device needs hands-on recovery, the options in increasing order of impact:
If a device is offline and unreachable through the platform, work through the
troubleshooting playbooks — most often the cause is
connectivity, time, or a network configuration change.
7.6.3 -
Logging
Devices can forward their logs to the SPEKTRA Edge platform and you can also pull
logs on demand. This lets you observe devices and workloads without logging into
each one.
Forwarding logs to the platform
You can configure a device to forward its system logs and its
container (workload) logs to the platform. The logging configuration lets you
control:
the minimum severity to forward, so you can keep volume manageable
which system components to include
whether container logs are exported
Forwarded logs are available on the dashboard and through the
cuttle command-line tool.
Detailed dashboard walkthrough
For a step-by-step walkthrough of setting the device log forwarding level from the
dashboard, see Manage device log forwarding.
Pulling logs on demand
Independently of forwarding, you can stream a device’s system or container logs on
demand through remote access — useful for live troubleshooting without
raising the forwarding level for the whole fleet.
Recommendations
Forward at a moderate severity by default and raise it temporarily when
investigating an issue.
Use on-demand log streaming for live debugging rather than forwarding
everything.
Remember that logs stored on the device live on the data area; very
verbose logging consumes data-area space.
7.6.4 -
Health checks
Health checks let a device continuously verify that it — or something running on
it — is healthy, and report the result to the platform. You define health checks
from the dashboard (or the API).
Types of checks
You can define host-level checks of several types:
Type
Verifies
HTTP
An HTTP endpoint responds as expected.
TCP
A TCP port accepts a connection.
gRPC
A gRPC service reports healthy.
ICMP
A host responds to ping.
Command
A command on the device exits successfully.
Device file
An expected device file or path is present.
How results are used
Each check’s result contributes to the device’s reported conditions, which
you can see on the device overview page. Use health checks to detect problems
such as a dependent service being unreachable, a required peripheral missing, or
a local endpoint failing — and to surface them centrally instead of discovering
them per device.
Recommendations
Check the things that matter for the device’s role (for example, the local
application endpoint, or a sensor’s device file).
Keep checks lightweight and give them sensible intervals so they reflect real
health without adding load.
7.6.5 -
Status & indicators
A device reports its state both to the platform and, on supported hardware,
through a physical LED. This page explains how to read each.
Connection status
On the platform, a device is shown as:
Status
Meaning
Online
The platform detects the device as connected.
Offline
The device is not detected, or is detected as disconnected.
Device information and metrics
The device reports details and resource usage you can view on the
dashboard, including:
OS version, hardware details, disks, and network interfaces
CPU, memory, and storage usage
temperature
These help you spot devices that are low on storage, running hot, or pinned at
high resource usage.
Detailed dashboard walkthrough
For where to find status, details, and metrics on the dashboard, see
Manage devices.
LED indicator
On hardware with a status LED, the device signals its lifecycle and health
through the LED so an on-site technician can tell at a glance what state a device
is in — for example, still starting up, working normally, or needing attention.
Use the LED for quick on-site triage, and the dashboard for detail.
Conditions from health checks
Health checks you define contribute to the device’s reported
conditions, giving you application- and peripheral-level health alongside the
built-in status.
7.6.6 -
Boot & shutdown hooks
Hooks let you run your own scripts at defined points in the device lifecycle —
for example to prepare hardware, mount a special device, or clean up on
shutdown. They are the supported way to extend device behavior without modifying
the read-only system image.
Available hooks
You can provide a script for each of these points:
Hook
Runs
On boot
Early in startup, before the device agent starts.
After the agent starts
Once the device agent is up.
On shutdown
When the device is shutting down or rebooting.
How to provide a hook
Place an executable script in the hooks location on the device’s
configuration storage. Because it lives on configuration storage,
the script persists across reboots and OS upgrades and is run
automatically at the corresponding point. See the
persistent paths reference for the exact location.
Guidelines
Keep hooks fast and resilient. A slow or failing boot hook delays startup;
make hooks idempotent and have them exit cleanly.
Do not rely on modifying the system image. Use hooks to act on
configuration and data, not to patch the OS — image changes do not persist.
Log from your hook so you can see what it did via logging.
Test on one device first before distributing a hook to a fleet.
Hooks run with elevated privileges
Hook scripts run with the privileges needed to administer the device. Treat them
as trusted code and control who can place them on your devices.
7.6.7 -
Running workloads
Devices run your applications as containers. You deploy and manage them from the
SPEKTRA Edge platform; this page covers only how workloads interact with the OS.
For the full application deployment workflow, see the Deploy guide.
How workloads use device storage
Container images and workload data live on the device’s data area,
which uses most of the disk.
A workload can mount paths from the device into its containers when it needs
access to host data or hardware.
Credentials a workload needs (such as registry pull secrets) are delivered
through the platform rather than stored in the image.
Networking for workloads
Any network ports a workload exposes are determined by the workload itself, not
by the OS — open them in your site firewall as needed. See
Connectivity & ports.
Because container images and data share the data area, a device that fills its
data area can fail to start new workloads. Watch storage usage in
device metrics, and keep logging levels reasonable so logs
do not consume the space your workloads need.
Lifecycle across reboots and upgrades
Workloads configured to run are brought back up after a reboot, and persist
across OS upgrades because their images and data are on persistent
storage.
7.7 -
Reference
Quick lookups for configuring and operating SPEKTRA Edge OS.
In this section
Configuration reference — the device settings you can manage,
grouped by area, with links to where each is documented.
Image settings — what you choose when creating an install image.
Persistent paths — locations on the device you may place files in.
This is an index of the device settings you can manage, grouped by area. Most are
set from the dashboard or the API once a device is online; a few are
chosen at image creation. For exact API field names and types, see the
Devices API reference.
Runtime settings (dashboard / API)
These are reconciled to the device while it is online — change them at any time.
A few settings are provided as files on the device’s configuration storage — see
Persistent paths.
7.7.2 -
Image settings
When you create an install image from the dashboard, you choose the
device type, the OS version, and a set of defaults that are embedded in the image
so a device is useful the moment it boots. This page summarizes those choices.
Image settings provide a device’s starting configuration. Once a device is
online, almost everything can be changed from the dashboard — so a single image
can serve a whole fleet, with per-device differences applied afterward.
7.7.3 -
Persistent paths
Most configuration is applied through the dashboard or API. A few
things, however, are provided as files on the device’s configuration storage —
the persistent area that survives reboots and OS upgrades. This page
lists the file-based settings you may need to place on a device.
File-based settings
Purpose
What to place
Documented in
Storage mapping
A storage mapping document defining partitions and mounts.
Files on configuration storage persist across reboots and OS upgrades; this
is why they are the right place for durable, file-based settings.
Do not place durable settings on the read-only system image — changes there
do not survive a reboot. See how persistence works.
When disk encryption is enabled, files on configuration storage
are protected at rest.
Prefer the dashboard where possible
File-based configuration exists for cases the dashboard does not cover (such as
hooks) and for baking defaults into images. For everything available in the
dashboard or API, prefer that route so configuration is centrally tracked.
7.7.4 -
Troubleshooting
Playbooks for the problems you are most likely to hit. Each lists the usual
causes in the order worth checking.
A device will not come online
Connectivity. Confirm outbound TCP 443 to the platform is allowed
(directly or via proxy). See Connectivity & ports.
Time. A badly wrong clock breaks secure connections and attestation.
Ensure the device can reach an NTP source — see
Time synchronization.
Network configuration. A recent network change may have broken
connectivity; the device should fall back to its image network settings unless
fallback is disabled. See connection fallback.
Onboarding. Confirm the device has valid provisioning credentials or a
working onboarding method.
A network change broke connectivity
If network configuration fallback is enabled, the device should
revert to its image network settings after a failed change.
If fallback is disabled, push a corrected configuration, or recover the
device on-site.
Configure a backup uplink (such as cellular) so a wired/Wi-Fi mistake does not
isolate the device — see uplink fallback.
An encrypted device will not unlock
After a hardware change (motherboard/TPM), automatic unlock no longer
matches. Use the recovery passphrase.
If the recovery passphrase is lost and automatic unlock is unavailable, the
device must be re-imaged (encrypted data is not recoverable).
Locked out of SSH
Your management host may have been banned after failed logins. Add it to
the SSH ignore list to prevent this.
Check the source allow/deny lists — your address may not be permitted.
Administer the device through remote access while you fix SSH
settings.
A USB device is rejected
USB device control is enabled and the device does not match an allow
rule. Add a rule for it, or confirm an existing rule matches its ID, port, or
interface.
An OS upgrade did not complete
Confirm the device can download the new version (connectivity and any
proxy).
A device that fails to start a new version can fall back to the retained
previous version; you can also roll back explicitly.
The device is out of storage
Container images, workload data, and logs share the data area. Check
storage usage in device metrics.
The process by which a device proves its identity and reports its integrity to
the platform using its TPM, before receiving credentials. See
TPM & device attestation.
Configuration storage
The persistent area that holds device settings, identity, the administrator
password, and hooks. Survives reboots and OS upgrades. See
how persistence works.
Data area
The persistent area that holds container images, workload data, and logs. Uses
most of the disk. See Storage.
Device type
The combination of hardware family and CPU architecture that identifies a
platform and determines image compatibility. See
supported platforms.
Disk encryption
Encryption of the configuration and data areas at rest, unlocked automatically
by the TPM. See Disk encryption.
Hook
A user-provided script run at a defined lifecycle point (boot, after the agent
starts, or shutdown). See Boot & shutdown hooks.
Onboarding / provisioning
How a device obtains an identity and joins a project — via zero-touch
provisioning, a provisioning policy, or pre-registered hardware. See
Device setup & provisioning.
Provisioning policy
A rule that lets devices self-register into a project from a template, either
unattended or with manual approval. See onboarding methods.
Recovery passphrase
A human-known break-glass passphrase that can unlock an encrypted device when
automatic unlock is unavailable. See Disk encryption.
Secure Boot
A firmware feature that allows only signed, trusted boot software to run. See
Secure Boot.
System image
The read-only operating system a device boots from. Replaced as a unit during
upgrades; not meant to be modified in place. See
how persistence works.
TPM (Trusted Platform Module)
A hardware security module that provides device identity and protects keys,
including the keys used for disk unlock. See
TPM & device attestation.
Zero-touch provisioning
Onboarding in which unconfigured hardware automatically finds the platform,
proves its identity, and receives credentials with no per-device setup. See
onboarding methods.
7.8 -
Install the droplet agent (.deb package)
Most fleets run the purpose-built SPEKTRA Edge OS image. If instead you
want to bring an existing Debian/Ubuntu Linux under management, you can
install the droplet agent from a .deb package. The machine then joins your
project and runs managed workloads, while you keep your own operating system.
This page walks you through the whole flow: install the package, create a
provisioning policy and a service account, grant the service account a role,
download its key, convert the key into a project_config.json, and place that
file where the agent reads it.
OS image vs. agent package
This is a different install method from the full [SPEKTRA Edge OS][os] image.
With the .deb package, OS-level management is intentionally off — the agent
manages workloads and reports telemetry, but it does not manage SSH, USB, the
network, or OS upgrades on your host. See
Default-enabled functions below.
Prerequisites
Architecture:x86-64 (amd64) or ARM64 (arm64). These match the
supported platforms for the OS image.
Operating system: a Debian-based Linux (Debian or Ubuntu) with systemd
and root/sudo access.
Package dependency:wireguard (pulled in as a dependency of the package).
Container runtime: Docker with Docker Compose, used by the default pod
driver to run workloads.
Platform access: the SPEKTRA Edge dashboard and an active
project, with permission to manage provisioning policies, service accounts,
service account keys, and role bindings.
Local tools:jq (used to build project_config.json).
Default-enabled functions
The packaged systemd unit starts the agent with the pod driver and with
OS management disabled:
Metrics, log forwarding, health checks, hardware/inventory and status reporting.
OS management
Disabled
--disable-os-management turns off SSH, USB, Avahi, OS versioning/upgrades, and network management, since the agent runs on your own OS.
If you want to enable additional capabilities, edit the ExecStart line in
/lib/systemd/system/droplet.service (each capability has its own
--disable-* flag) and reload with sudo systemctl daemon-reload.
Not available with the package install
The .deb agent runs on your operating system, so the platform features that
are properties of SPEKTRA Edge OS itself are not available. You remain
responsible for the host OS. In particular, the following are not supported:
installs the service unit at /lib/systemd/system/droplet.service,
creates the working directory /var/lib/droplet,
enables and starts the droplet service automatically.
At this point the service is running but has no identity yet. It will keep
retrying until you supply project_config.json, which you provide in the next
section.
Create the agent’s identity (project_config.json)
The agent onboards using a project-scoped project_config.json. There are two
ways to obtain it — pick one:
Reuse from an existing device (fastest). If you already have a device that
onboards against the same project and provisioning policy, its
project_config.json is a shared credential you can copy as-is. Grab it from
that device — /etc/droplet/project_config.json on a package install, or
/isodevice/config/project_config.json on SPEKTRA Edge OS — and skip straight
to Install the identity file. See
Reuse across devices for why this is safe.
Create from scratch. If this is a new project or you want a dedicated
credential, follow the numbered steps below to create a provisioning policy, a
service account with the right role, and a key, then convert it.
The steps below cover the create-from-scratch path.
Step 1 — Create a provisioning policy
A provisioning policy lets a device self-register into your project. Create
one in the dashboard and choose a mode:
Mode
Behavior
Unattended
A device that presents the policy credential is registered automatically.
Manual approval
The device creates a pending request that an operator approves before it becomes active.
The policy also defines the role bound to each newly created device identity
(default: services/devices.edgelq.com/roles/v1-device-agent). See
provisioning concepts for background.
Step 2 — Create a service account
In the dashboard, open your project and create a Service Account (for
example fleet-provisioner). This is the shared, project-scoped identity that
devices will present in order to self-provision.
Step 3 — Assign the provisioning role and attach it to the policy
For the service account to be allowed to provision devices, it needs the
Device provisioner role:
This role grants the provisionDeviceViaPolicy and
requestProvisioningApproval permissions (scoped by project, region, service
account, and provisioning policy).
Bind the Device provisioner role to the service account from Step 3.
Associate the service account with the provisioning policy from Step 2, so
devices using this account are matched to that policy.
Step 4 — Create and download a service account key
Open the service account → Service Account Keys → Create. On creation the
dashboard downloads a JSON key file (shown only once). Save it as
service-account-key.json. It looks like:
The agent expects the key wrapped in a config with a droplet service set. Build
it from the downloaded key, setting defaultDomain to the controller endpoint
your device connects to (for example apis.edgelq.com, or your dev/staging
domain):
Keep private_key on one line with its \n escapes intact (valid JSON).
defaultDomain is the controller endpoint the agent connects to — not the
IAM host inside the email.
Install the identity file
Whether you reused an existing project_config.json or created one above, install
it where the packaged service reads it, and lock down its permissions (it
contains a private key):
For the .deb package install, the agent reads the file from
/etc/droplet/project_config.json (as configured in the systemd unit).
On SPEKTRA Edge OS, the same file lives at
/isodevice/config/project_config.json instead. If you copy a config between the
two, adjust the path accordingly.
Reuse across devices
project_config.json is a shared, project-scoped credential — it is not tied
to any single machine. That means:
You can reuse an existing project_config.json taken from another device
that already onboards against the same project and policy.
You can copy the same file to many devices. Each device presents this
shared identity only to self-provision; on success it receives its own,
device-scoped identity (/etc/droplet/device_config.json) and uses that from
then on.
This is why a single install image or a single copied config can serve an entire
fleet, with no per-device credential preparation.
Keep it secret
Treat project_config.json like any other private key: restrict it to 0600,
do not commit it to source control, and rotate or delete the service account key
if it is exposed. Revoking the key (or removing the provisioning policy) stops
new devices from onboarding with it.
Verify
Watch the agent logs:
journalctl -u droplet -f
The agent should load the project config and attempt self-provisioning.
In the dashboard, under your project:
Unattended: a new Device appears automatically.
Manual approval: a pending provisioning request appears — approve it.
Once provisioned, the device shows as Online and reports its OS version,
hardware, and network details.
SEI runs on the SPEKTRA Edge platform and shares some basic components,
such as IAM and Monitoring. Therefore, to manage the SEI, it is necessary
to manipulate these components using cuttle.
Note that you need a separate cuttle tool to download: cuttle-watchdog.
It uses the same configuration files as regular cuttle, so make sure you use
proper context (environment and account) using regular cuttle.
Managing access privileges
“Users” managed on the SEI dashboard correspond to “Role Binding” on IAM;
there is also a “User” resource on IAM, but be careful not to confuse the two.
Similarly, user invitations correspond to “Project Invitation” on IAM.
Note that some of the Roles displayed on the SEI dashboard have simplified
names for simplicity. For example, the actual “administrator” privilege
corresponds to services/watchdog.edgelq.com/roles/operator-admin.
Agent, Target, and Probing Assignments
The basic resources used by SEI reside on the watchdog service. Agents on the
dashboard exist as “Probe”, targets as “ProbingTarget”, and probing allocation
as “Probing Distribution” resources.
Each created resource can be listed with the following commands
## agentcuttle-watchdog v1alpha2 list probes --project $PROJECT
## targetscuttle-watchdog v1alpha2 list probing-targets --project $PROJECT
## Probing assignmentcuttle-watchdog v1alpha2 list probing-distributions --project $PROJECT
Getting Metrics Information
The metrics information (time series data) displayed on the SEI dashboard is
stored on the Monitoring service, not on the Watchdog service; see the section
on “Managing Time Series Data (Monitoring)” for information on how to query
the Monitoring service. section on how to query the Monitoring service.
Below is a list of commonly used resources and metrics at SEI.
Resources
Resource Name
Overview
watchdog.edgelq.com/probe
network metrics information measured by SEI agent
watchdog.edgelq.com/host
SEI agent hardware information (WiFi signal strength, CPU usage, etc.)
Specifies the full name of the agent performing path discovery.
--target
Specifies the full name of the target for path discovery.
--intervale
Specifies the period of time to retrieve.
Configure SEI agent delivery to SPEKTRA Edge devices
To distribute the SEI agent on an SPEKTRA Edge device, use the Distribution
resource. This resource automatically creates a Pod resource for any SPEKTRA
Edge device that matches the criteria; the Pod resource is the smallest unit
that makes up the application and describes the container’s startup
configuration.
Note that the creation of a Distribution resource requires the role
applications-admin or equivalent, and cannot be created by
services/watchdog.edgelq.com/roles/operator-admin alone.
Generate Shared Token
Prior to the creation of a distribution resource, a token is generated to
register the SEI agent on the controller. Shared Token allows you to register
multiple agents at once. Shared Tokens can be used to register multiple agents
at once. Shared Tokens cannot be managed on the SEI Dashboard, so the cuttle
command must be used.
First, create a text file (shared_token.yaml) with the following contents.
Refer to the Watchdog SDK API reference for the role of each field.
Now note the value of the SECRET field in the reply from the controller.
This value is the token needed to activate the SEI agent.
Creating a Distribution
Next, create a Distribution to deliver the SEI agent. Save the following
contents to a file (dist.yaml). Replace $TOKEN in the file with
the appropriate value.
After saving the file, create the resource with the following command
cuttle applications create distribution -f dist.yaml
If an SPEKTRA Edge device is already registered in the Project and a Device
resource exists, a Pod resource will be automatically generated when the
Distribution is created. Confirm that the Pod resource has been created with
the following command.